Climate for Station: Jan Mayen, Jan Mayen [Norway]
Loading live weather...
Climate Analysis & Overview
Jan Mayen's climate is characterised by a subtle long-term warming trend, despite a recent decade of cooling. Precipitation has become more evenly distributed, reflecting a shift in weather patterns on this remote Norwegian island.
Arctic Maritime Climate
Jan Mayen, a remote island in the Norwegian Sea, is classified under the Köppen climate classification as ET, or tundra climate. This classification is typical for regions where the warmest month averages below 10.0°C (50.0°F). Jan Mayen's geographic isolation and proximity to the Arctic Circle result in a climate heavily influenced by oceanic currents and prevailing winds. The island's rugged terrain, dominated by the volcanic Beerenberg, further shapes its weather patterns, often resulting in rapid changes in temperature and precipitation.
Temperature Trends: A Tale of Two Scales
The climate data for Jan Mayen reveals a nuanced picture of temperature trends. Over the all-time record, there is a slight warming, with high temperatures increasing by 0.20°C (0.36°F) and low temperatures rising by 0.17°C (0.31°F). This long-term warming is contrasted by the past decade, which shows a cooling trend with high temperatures decreasing by 1.01°C (1.82°F) and lows by 1.32°C (2.38°F). This divergence suggests a complex interplay of regional climatic forces, possibly linked to broader Arctic changes.
Precipitation Patterns: Even Distribution
The Precipitation Concentration Index (PCI) for Jan Mayen has decreased from a baseline of 11.21 to a current value of 9.15. This indicates that precipitation events have become more evenly distributed throughout the year. The PCI is a measure of how precipitation is spread over time; a lower value suggests less concentration in a few intense events and more regular rainfall. This shift could be attributed to changes in atmospheric circulation patterns affecting the North Atlantic.
Record Extremes: A Window into Variability
Jan Mayen's recorded temperature extremes provide a glimpse into the island's climatic variability. The highest temperature ever recorded is 17.0°C (62.6°F), while the lowest plummeted to -28.4°C (-19.1°F). These records underscore the island's capacity for significant thermal oscillations, influenced by both its maritime setting and polar location.
Regional Climate Goals and Context
Norway's commitment to reducing greenhouse gas emissions and adapting to climate change provides a backdrop for understanding Jan Mayen's climate dynamics. As part of Norway's broader environmental strategy, monitoring stations like Jan Mayen play a crucial role in tracking changes in the Arctic, a region particularly sensitive to global warming. Recent weather events, such as increased storm activity in the North Atlantic, further highlight the importance of continuous climate monitoring on this isolated island.
Station Statistics
10-Year Trend
High: -1.73 °F/decade
Low: -1.90 °F/decade
Rain: +0.005 in/decade
25-Year Trend
High: +0.37 °F/decade
Low: +0.56 °F/decade
Rain: +0.002 in/decade
50-Year Trend
High: +0.93 °F/decade
Low: +1.21 °F/decade
Rain: -0.002 in/decade
All-Time Trend
High: +0.36 °F/decade
Low: +0.32 °F/decade
Rain: +0.002 in/decade
Percentage Above-Average Days
Last 12 Months: 60.3%
This Year: 36.4%
Precipitation Concentration Index (PCI) ℹ️
Last 12 Months: 10.6
Historical Average: 10.9
Percentile Rank of Last 12 Months ℹ️
High: 95th percentile
Low: 97th percentile
Rain: 52nd percentile
Change in Variance ℹ️
High: -20.2%
Low: -22.4%
Intraday: -32.8%
Data Coverage
81.9%
First Year of Data
1921
Station Location
Historical Weather Records
| Max High | Avg High | Min High | Max Avg | Avg Avg | Min Avg | Max Low | Avg Low | Min Low | Max Precipitation | Avg Precipitation | Max Snow | Avg Snow | |
|---|---|---|---|---|---|---|---|---|---|---|---|---|---|
| Record | 62.60 °F | — | -12.64 °F | 55.76 °F | — | -13.36 °F | 61.16 °F | — | -19.12 °F | 3.43 in | — | — | — |
| January | 49.10 °F | 28.98 °F | -7.96 °F | 41.54 °F | 25.26 °F | -13.36 °F | 61.16 °F | 20.46 °F | -16.42 °F | 2.35 in | 0.07 in | — | — |
| February | 50.00 °F | 28.13 °F | -12.64 °F | 42.08 °F | 24.80 °F | -11.56 °F | 56.30 °F | 19.29 °F | -19.12 °F | 1.26 in | 0.07 in | — | — |
| March | 46.94 °F | 27.88 °F | -10.48 °F | 40.46 °F | 24.66 °F | -12.10 °F | 40.46 °F | 19.23 °F | -16.24 °F | 1.43 in | 0.06 in | — | — |
| April | 50.54 °F | 30.80 °F | 4.46 °F | 42.62 °F | 27.31 °F | 4.82 °F | 38.66 °F | 22.85 °F | -6.52 °F | 1.56 in | 0.05 in | — | — |
| May | 57.92 °F | 35.20 °F | 16.88 °F | 51.08 °F | 32.10 °F | 15.08 °F | 41.00 °F | 28.75 °F | 10.40 °F | 2.01 in | 0.04 in | — | — |
| June | 59.54 °F | 40.44 °F | 27.68 °F | 50.54 °F | 36.97 °F | 26.42 °F | 45.14 °F | 33.78 °F | 22.82 °F | 1.22 in | 0.04 in | — | — |
| July | 59.00 °F | 44.80 °F | 33.44 °F | 54.68 °F | 41.53 °F | 31.10 °F | 50.18 °F | 38.41 °F | 26.24 °F | 3.43 in | 0.05 in | — | — |
| August | 62.60 °F | 45.57 °F | 33.80 °F | 55.76 °F | 42.77 °F | 34.16 °F | 50.36 °F | 39.63 °F | 27.86 °F | 1.73 in | 0.07 in | — | — |
| September | 57.56 °F | 41.81 °F | 27.86 °F | 50.54 °F | 39.18 °F | 26.42 °F | 50.54 °F | 35.97 °F | 22.64 °F | 2.70 in | 0.10 in | — | — |
| October | 59.00 °F | 36.89 °F | 11.30 °F | 48.92 °F | 33.88 °F | 15.80 °F | 45.86 °F | 30.00 °F | -0.40 °F | 1.83 in | 0.09 in | — | — |
| November | 50.00 °F | 32.41 °F | 4.10 °F | 42.26 °F | 29.16 °F | 4.28 °F | 42.44 °F | 25.01 °F | -3.10 °F | 1.56 in | 0.09 in | — | — |
| December | 54.14 °F | 29.78 °F | -6.34 °F | 45.86 °F | 26.00 °F | -7.96 °F | 53.78 °F | 21.65 °F | -11.56 °F | 1.50 in | 0.08 in | — | — |
Data Visualisations
Remove WatermarksCurrent Year Climate Trends vs Historical


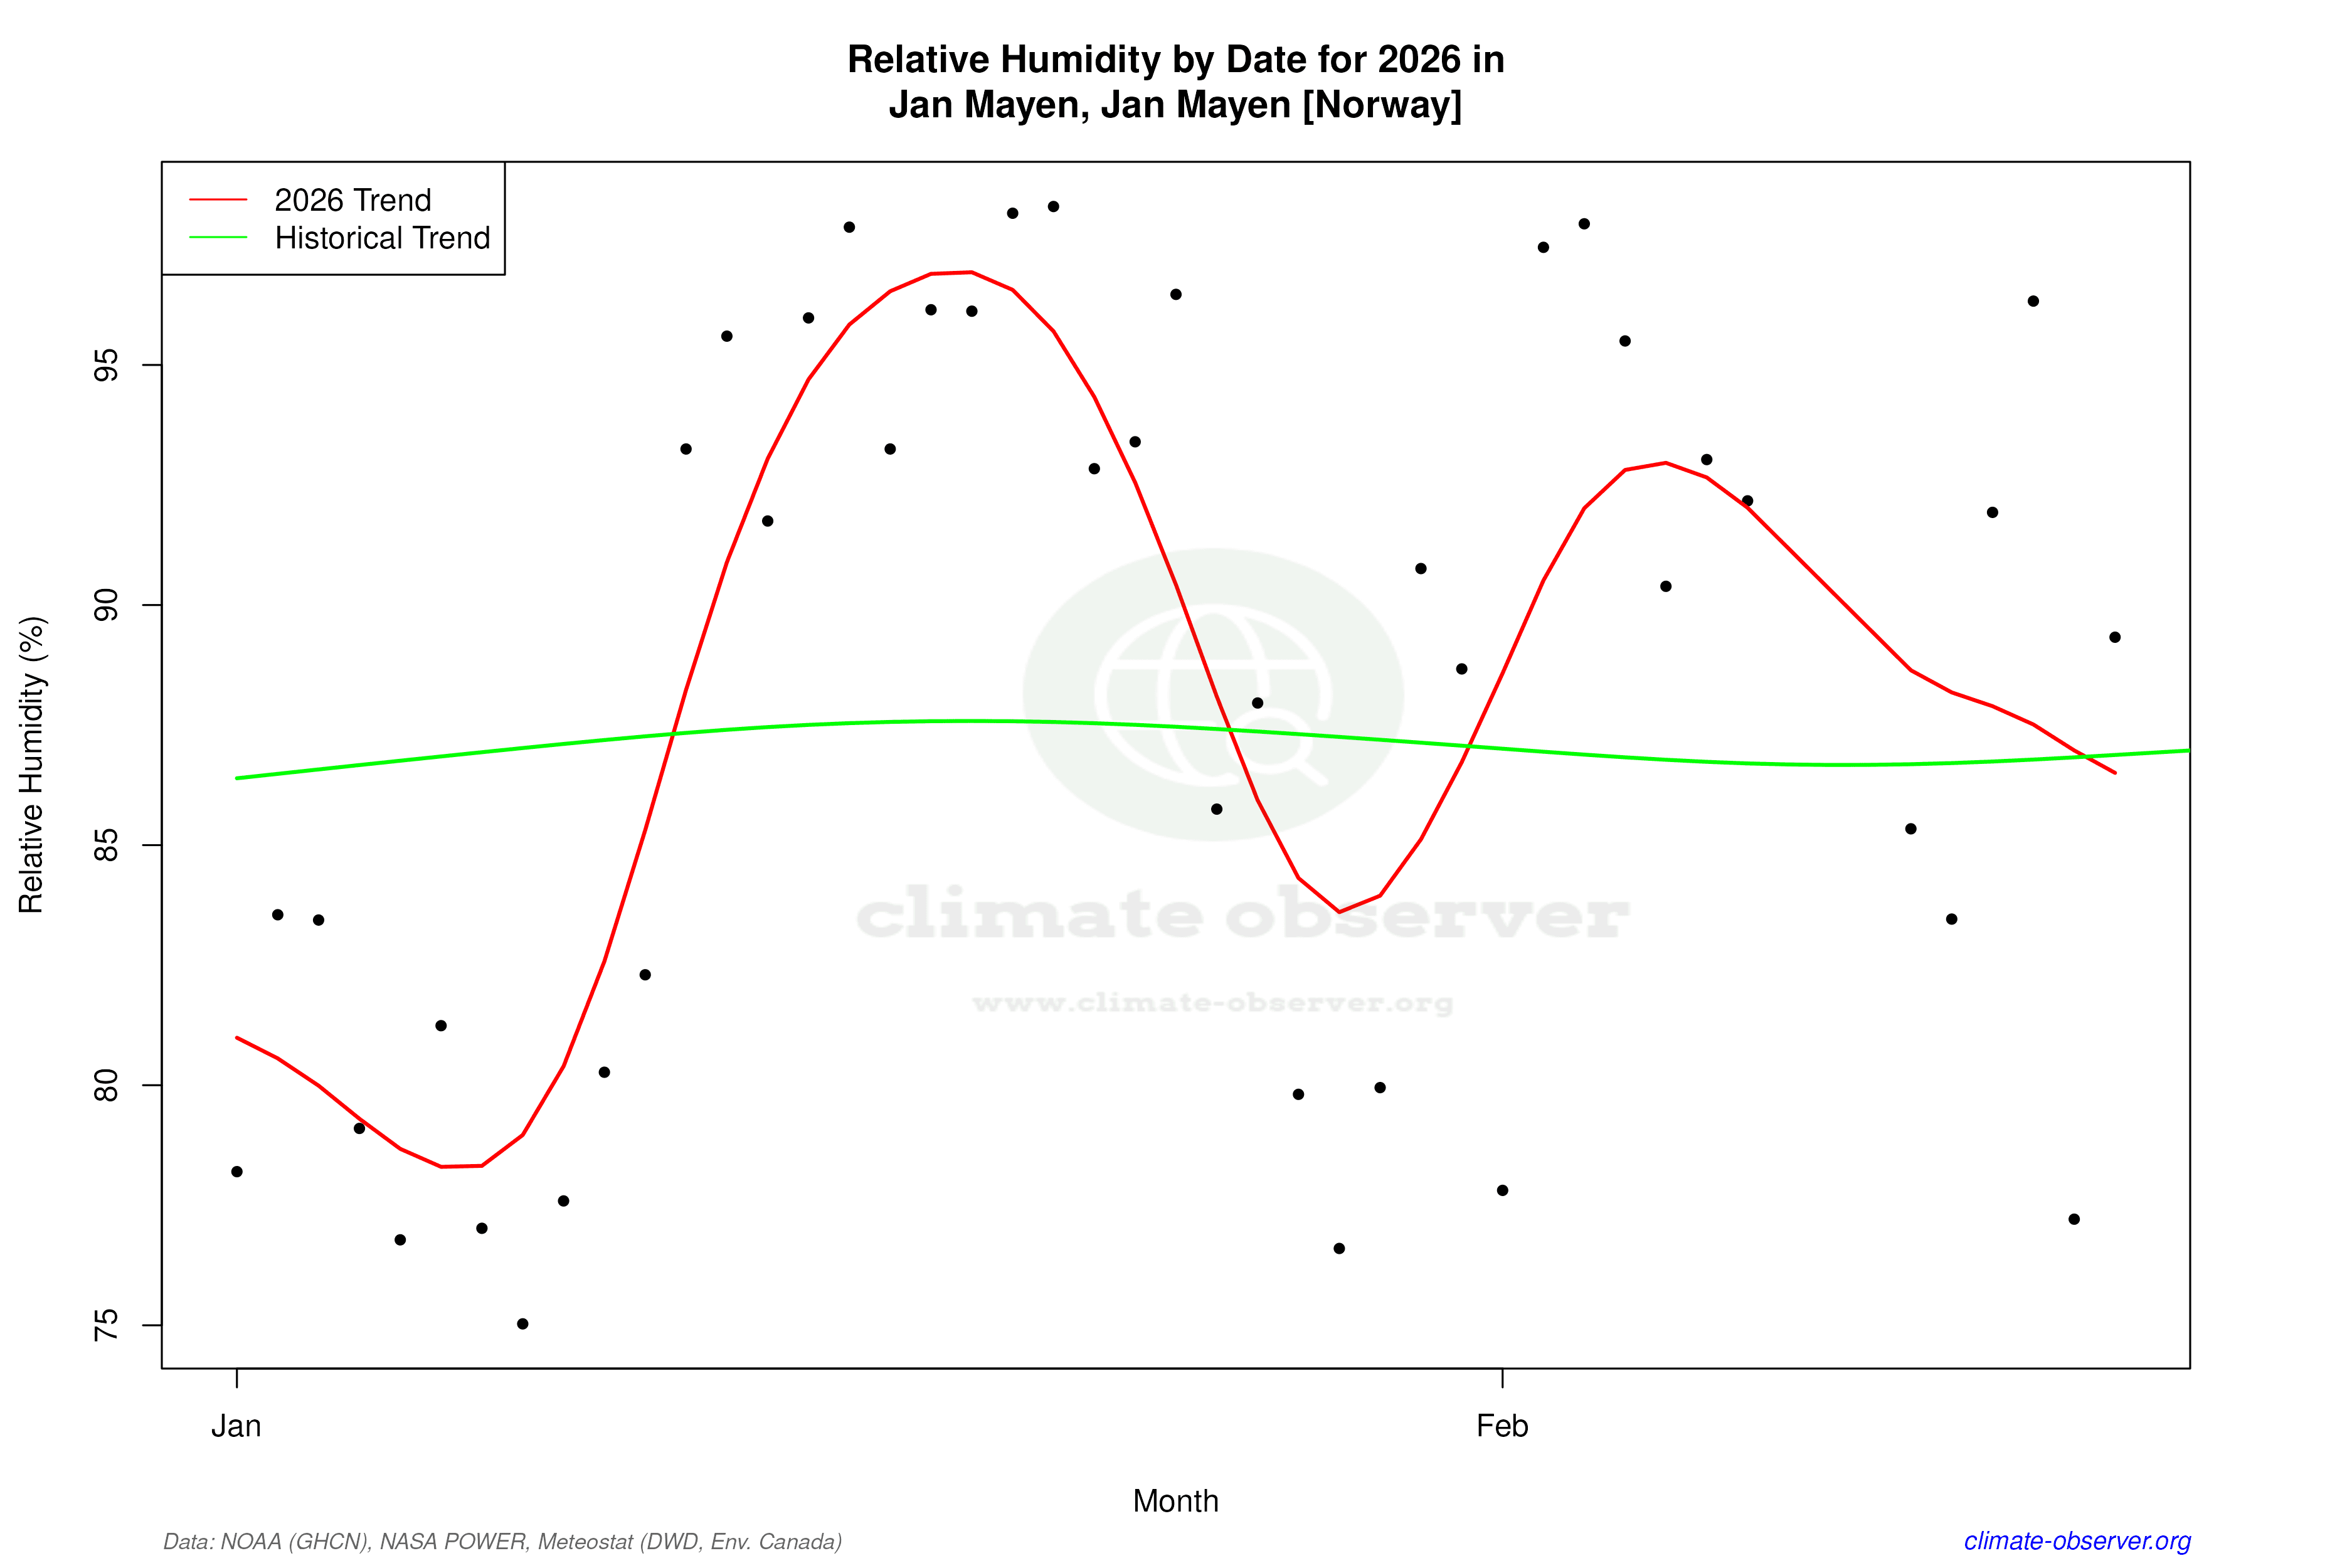

Max Temperature this Year | 1 of 6
Climate 12-Month Moving Averages


Max Temperature 12-Month MA | 1 of 6
Daily Data Points and Averages Throughout the Year

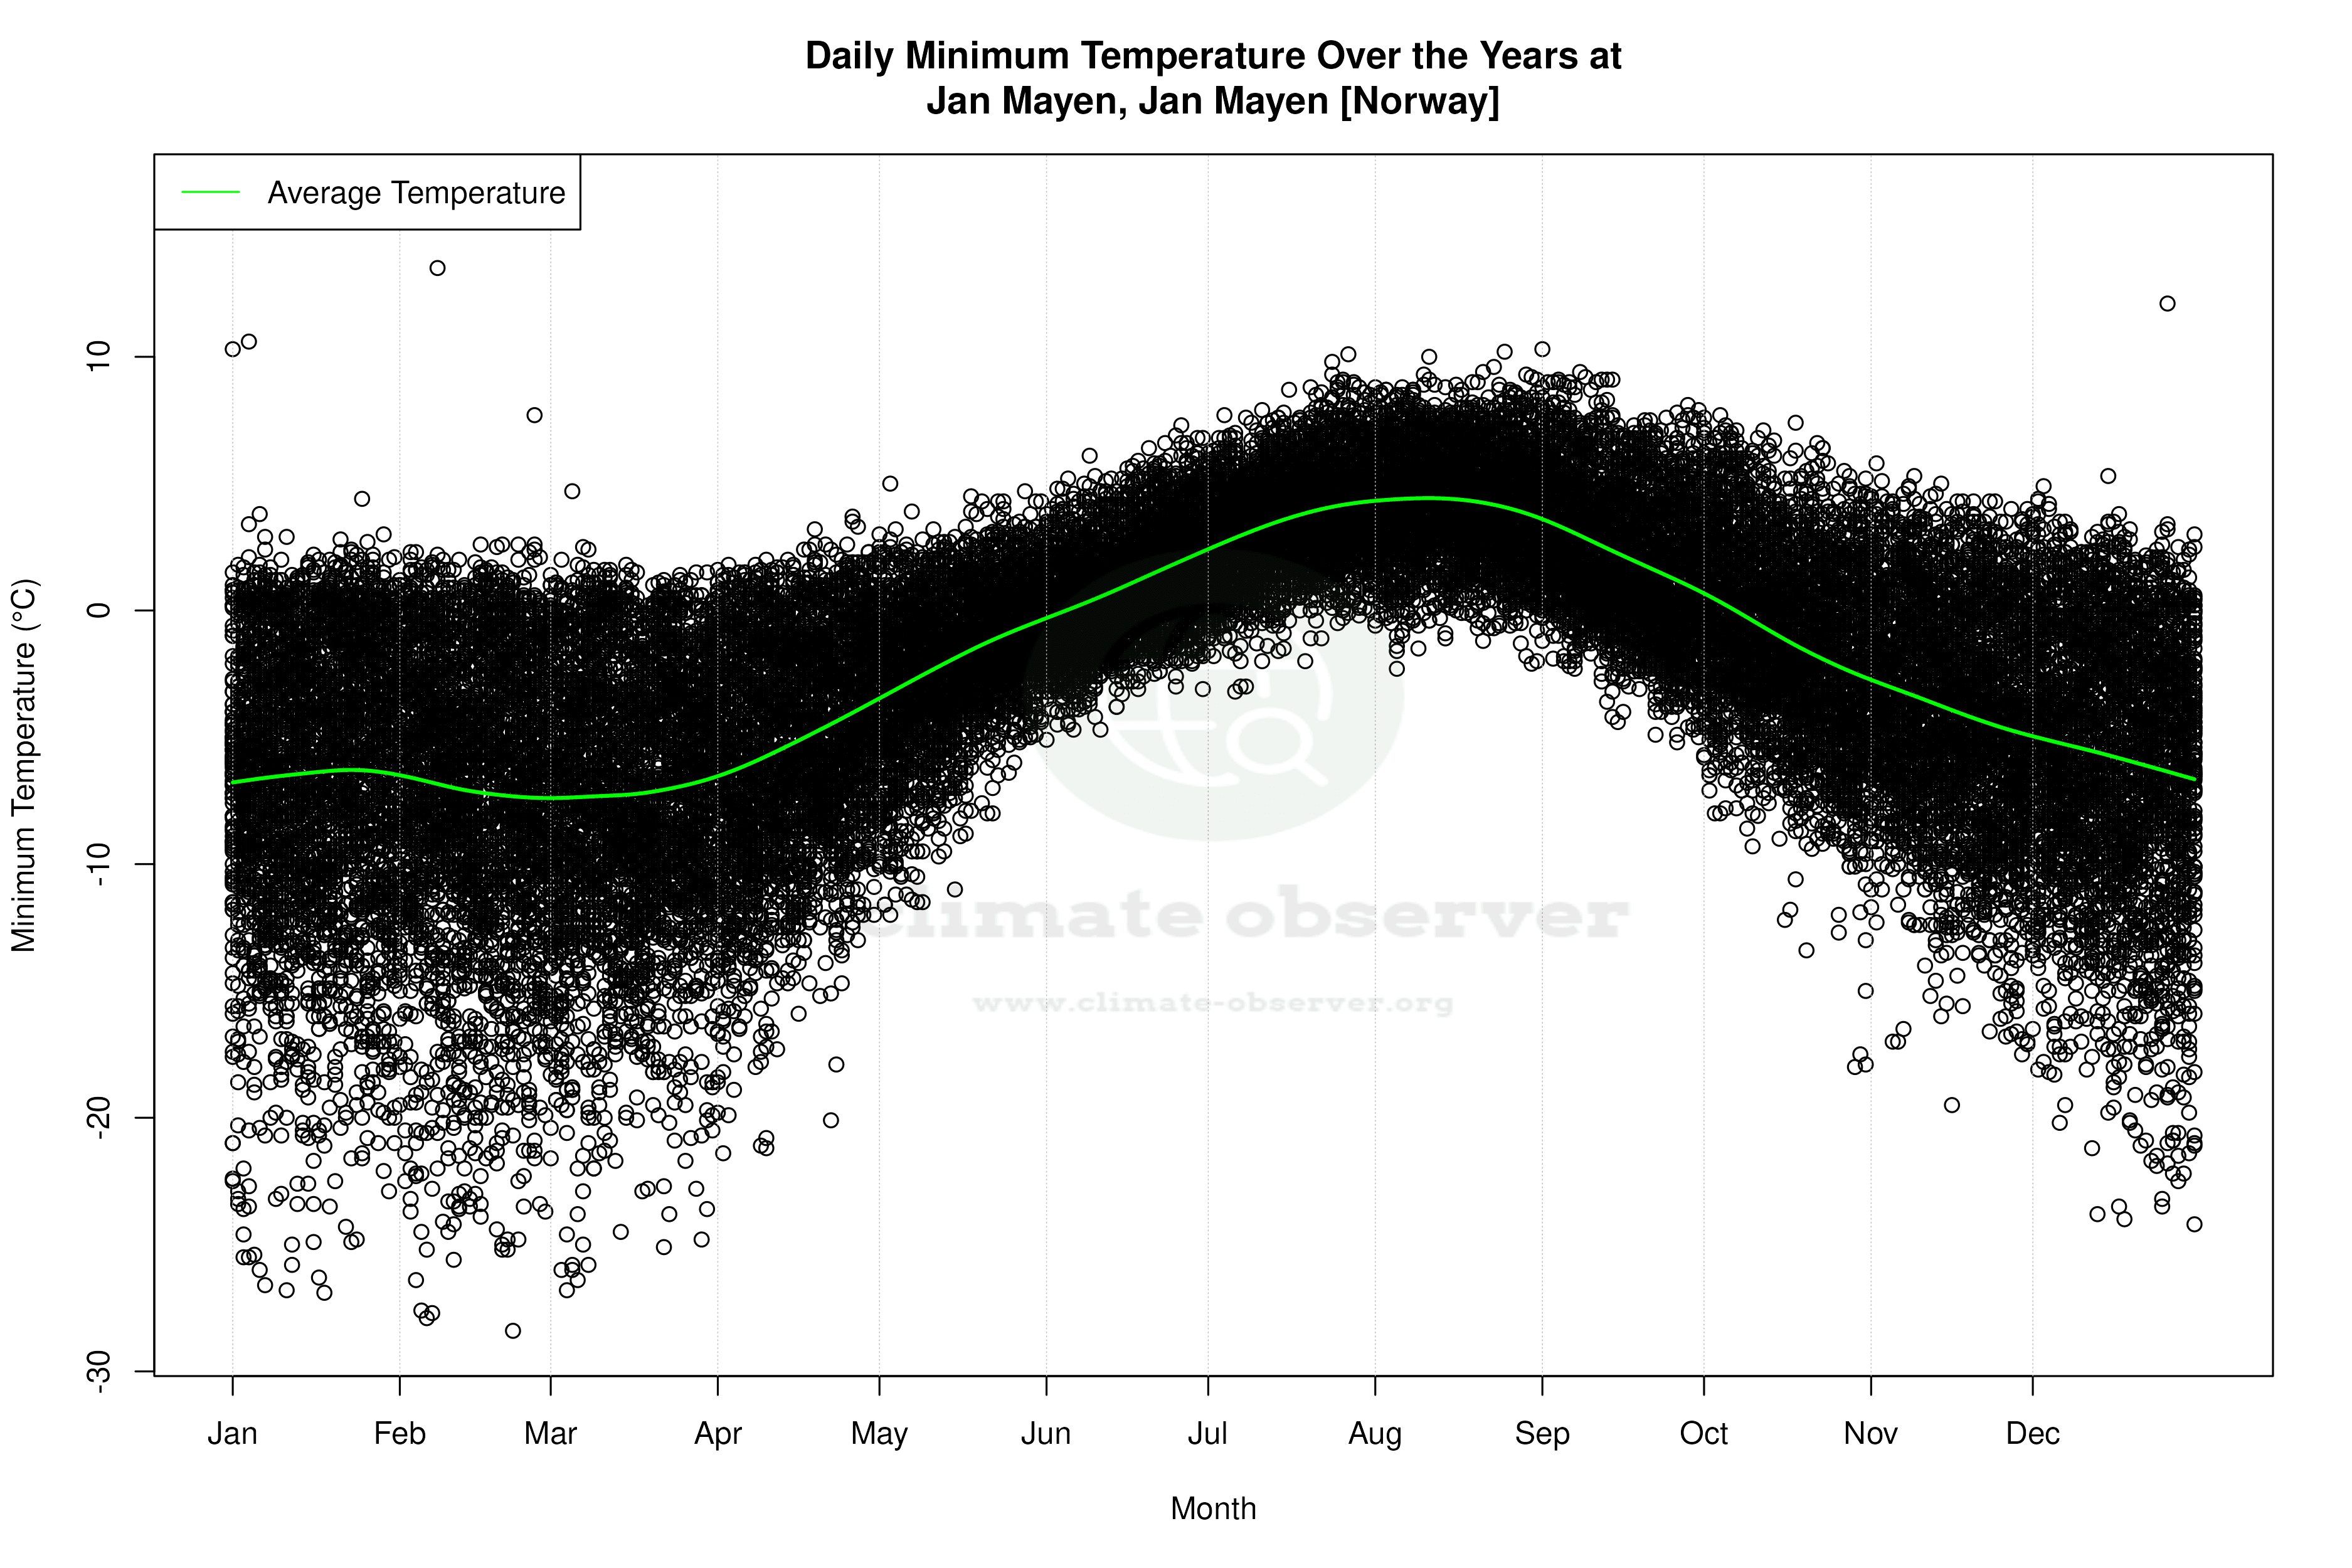

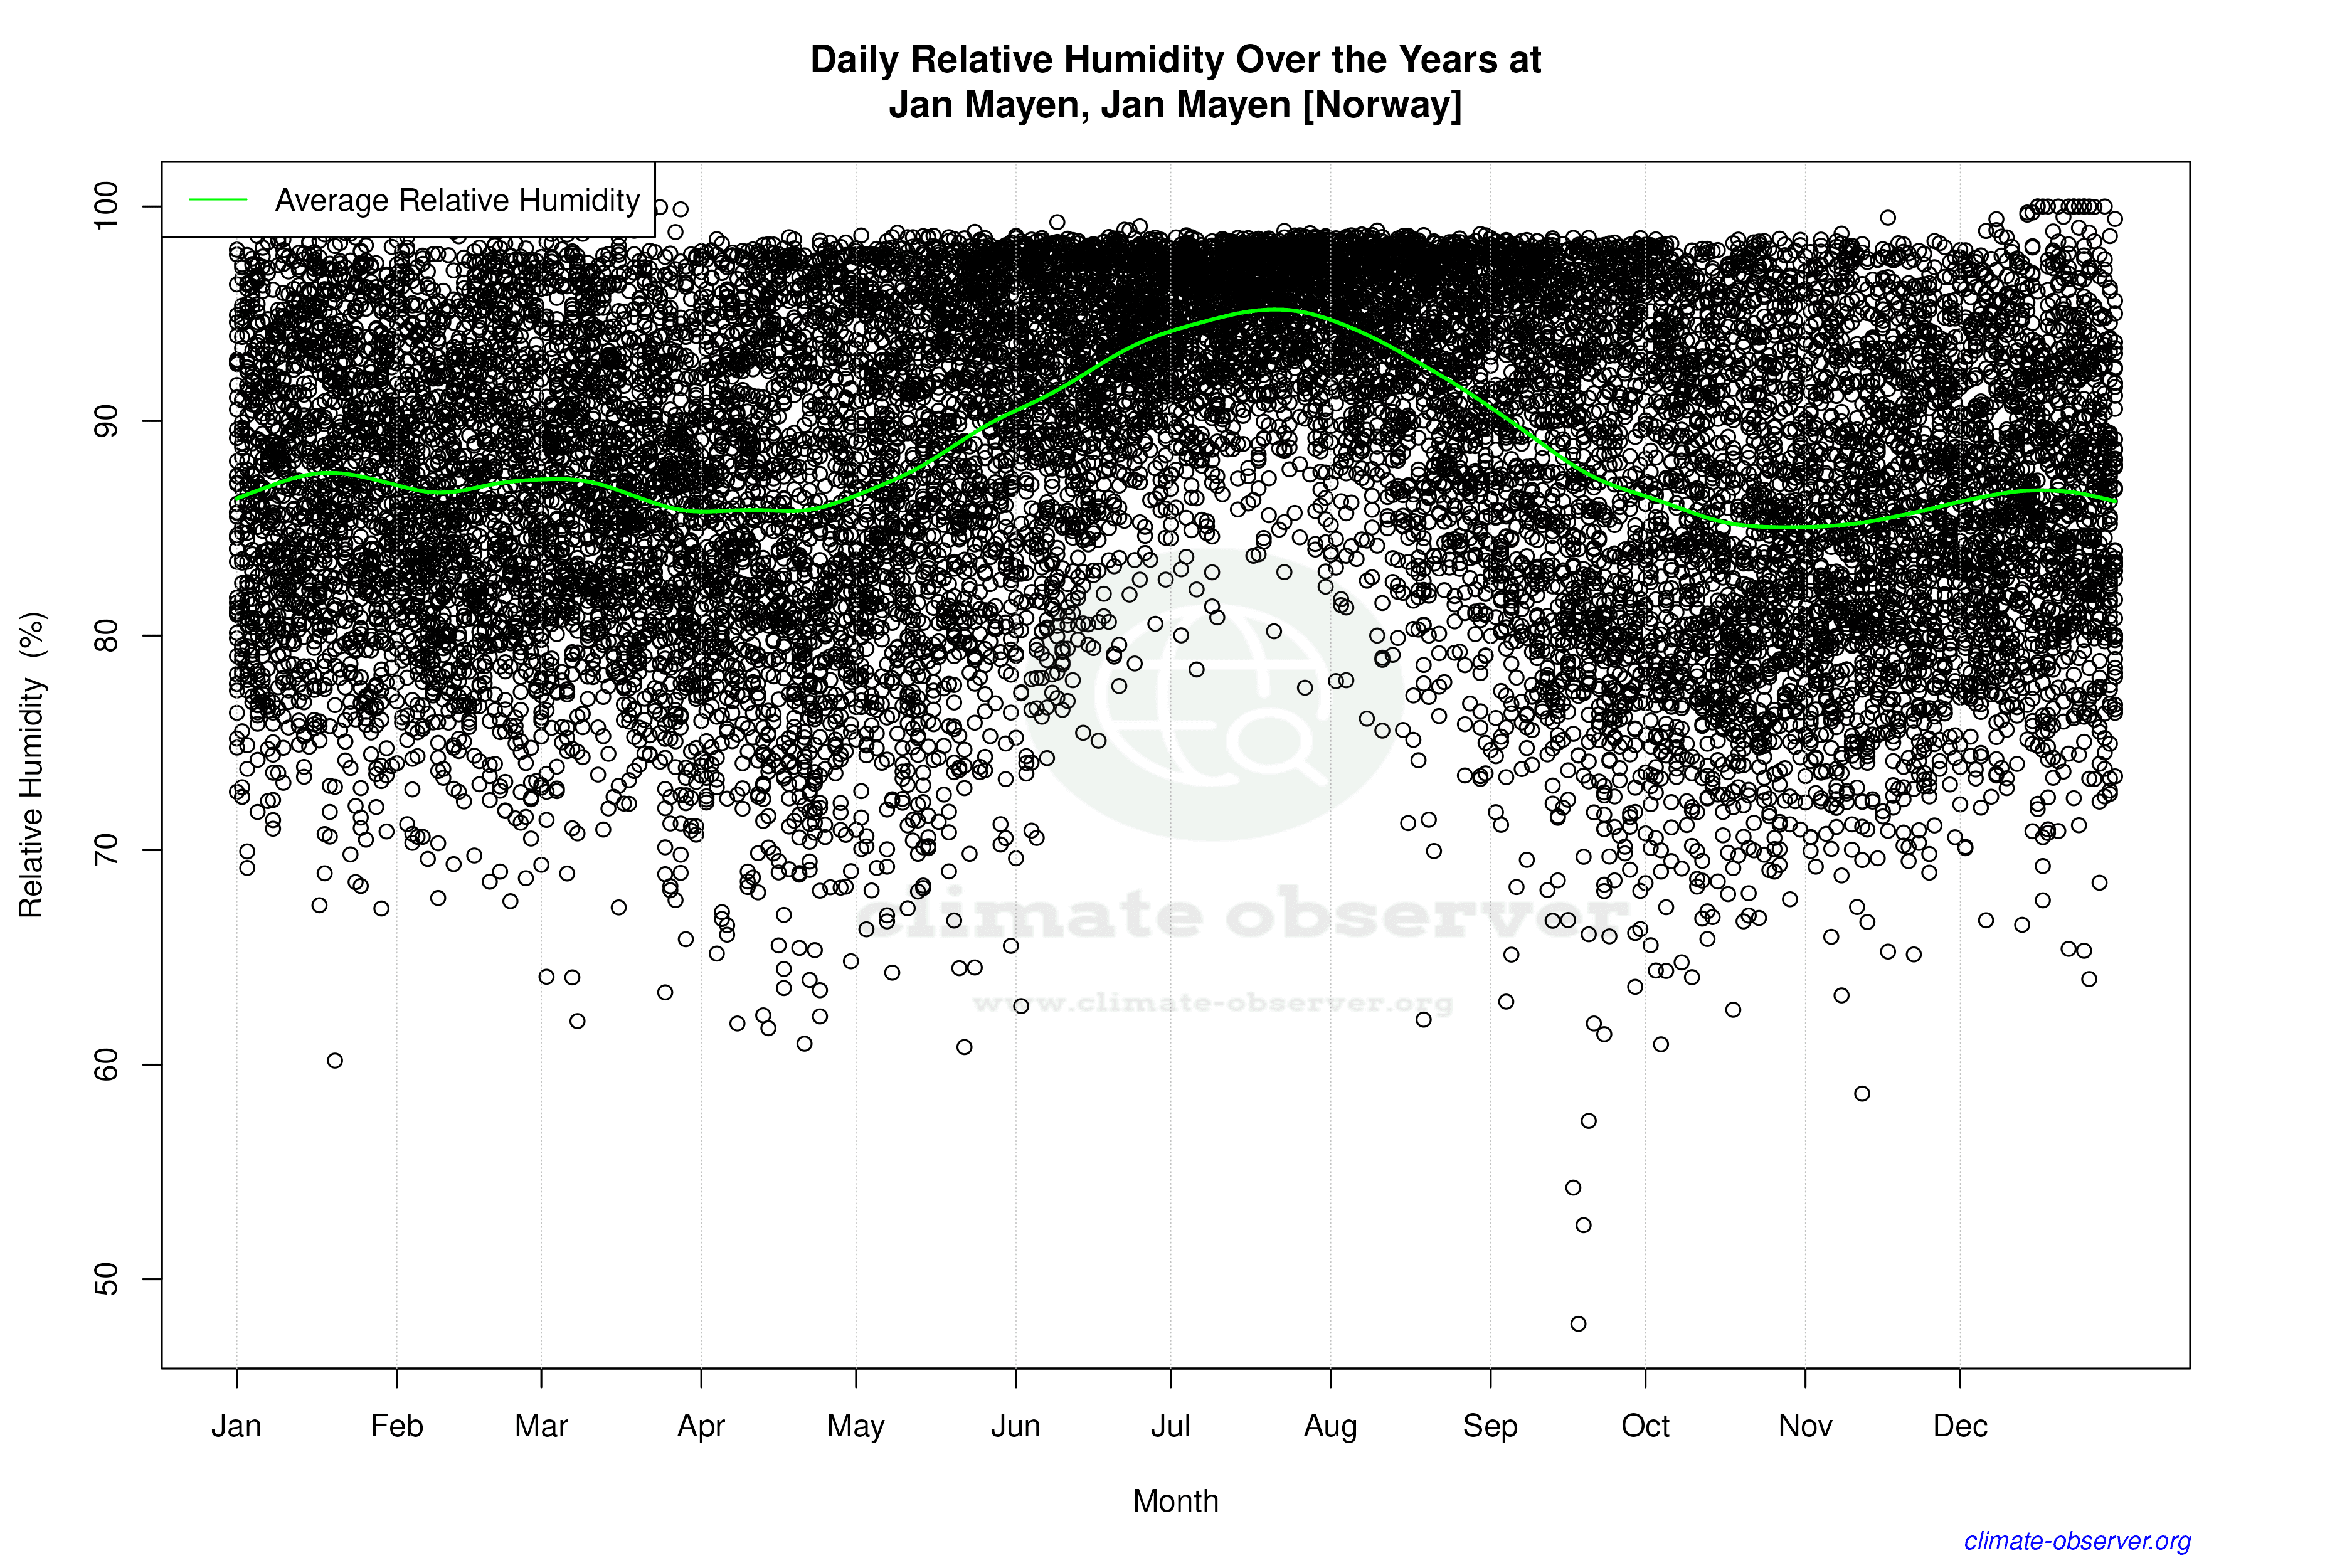

Average Max Temperature Throughout Year | 1 of 5