Climate for Station: Jomo Kenyatta Intl, Nairobi County, Kenya
Loading live weather...
Climate Analysis & Overview
Jomo Kenyatta International Airport, located in Nairobi, Kenya, has experienced a mix of warming and cooling trends over the past decade, with a notable decrease in precipitation concentration. The all-time data reveals a slight warming trend in low temperatures, while high temperatures have remained relatively stable.
Climate Context and Geography
Jomo Kenyatta International Airport is situated in Nairobi, Kenya, which falls under the Köppen climate classification of Cwb, indicating a subtropical highland climate. This classification suggests mild temperatures with a distinct wet and dry season. The airport's proximity to the Great Rift Valley and the Aberdare Range influences local weather patterns, contributing to its unique climate profile. The region's elevation and topography play a significant role in moderating temperatures and distributing precipitation.
Temperature Trends: A Mixed Picture
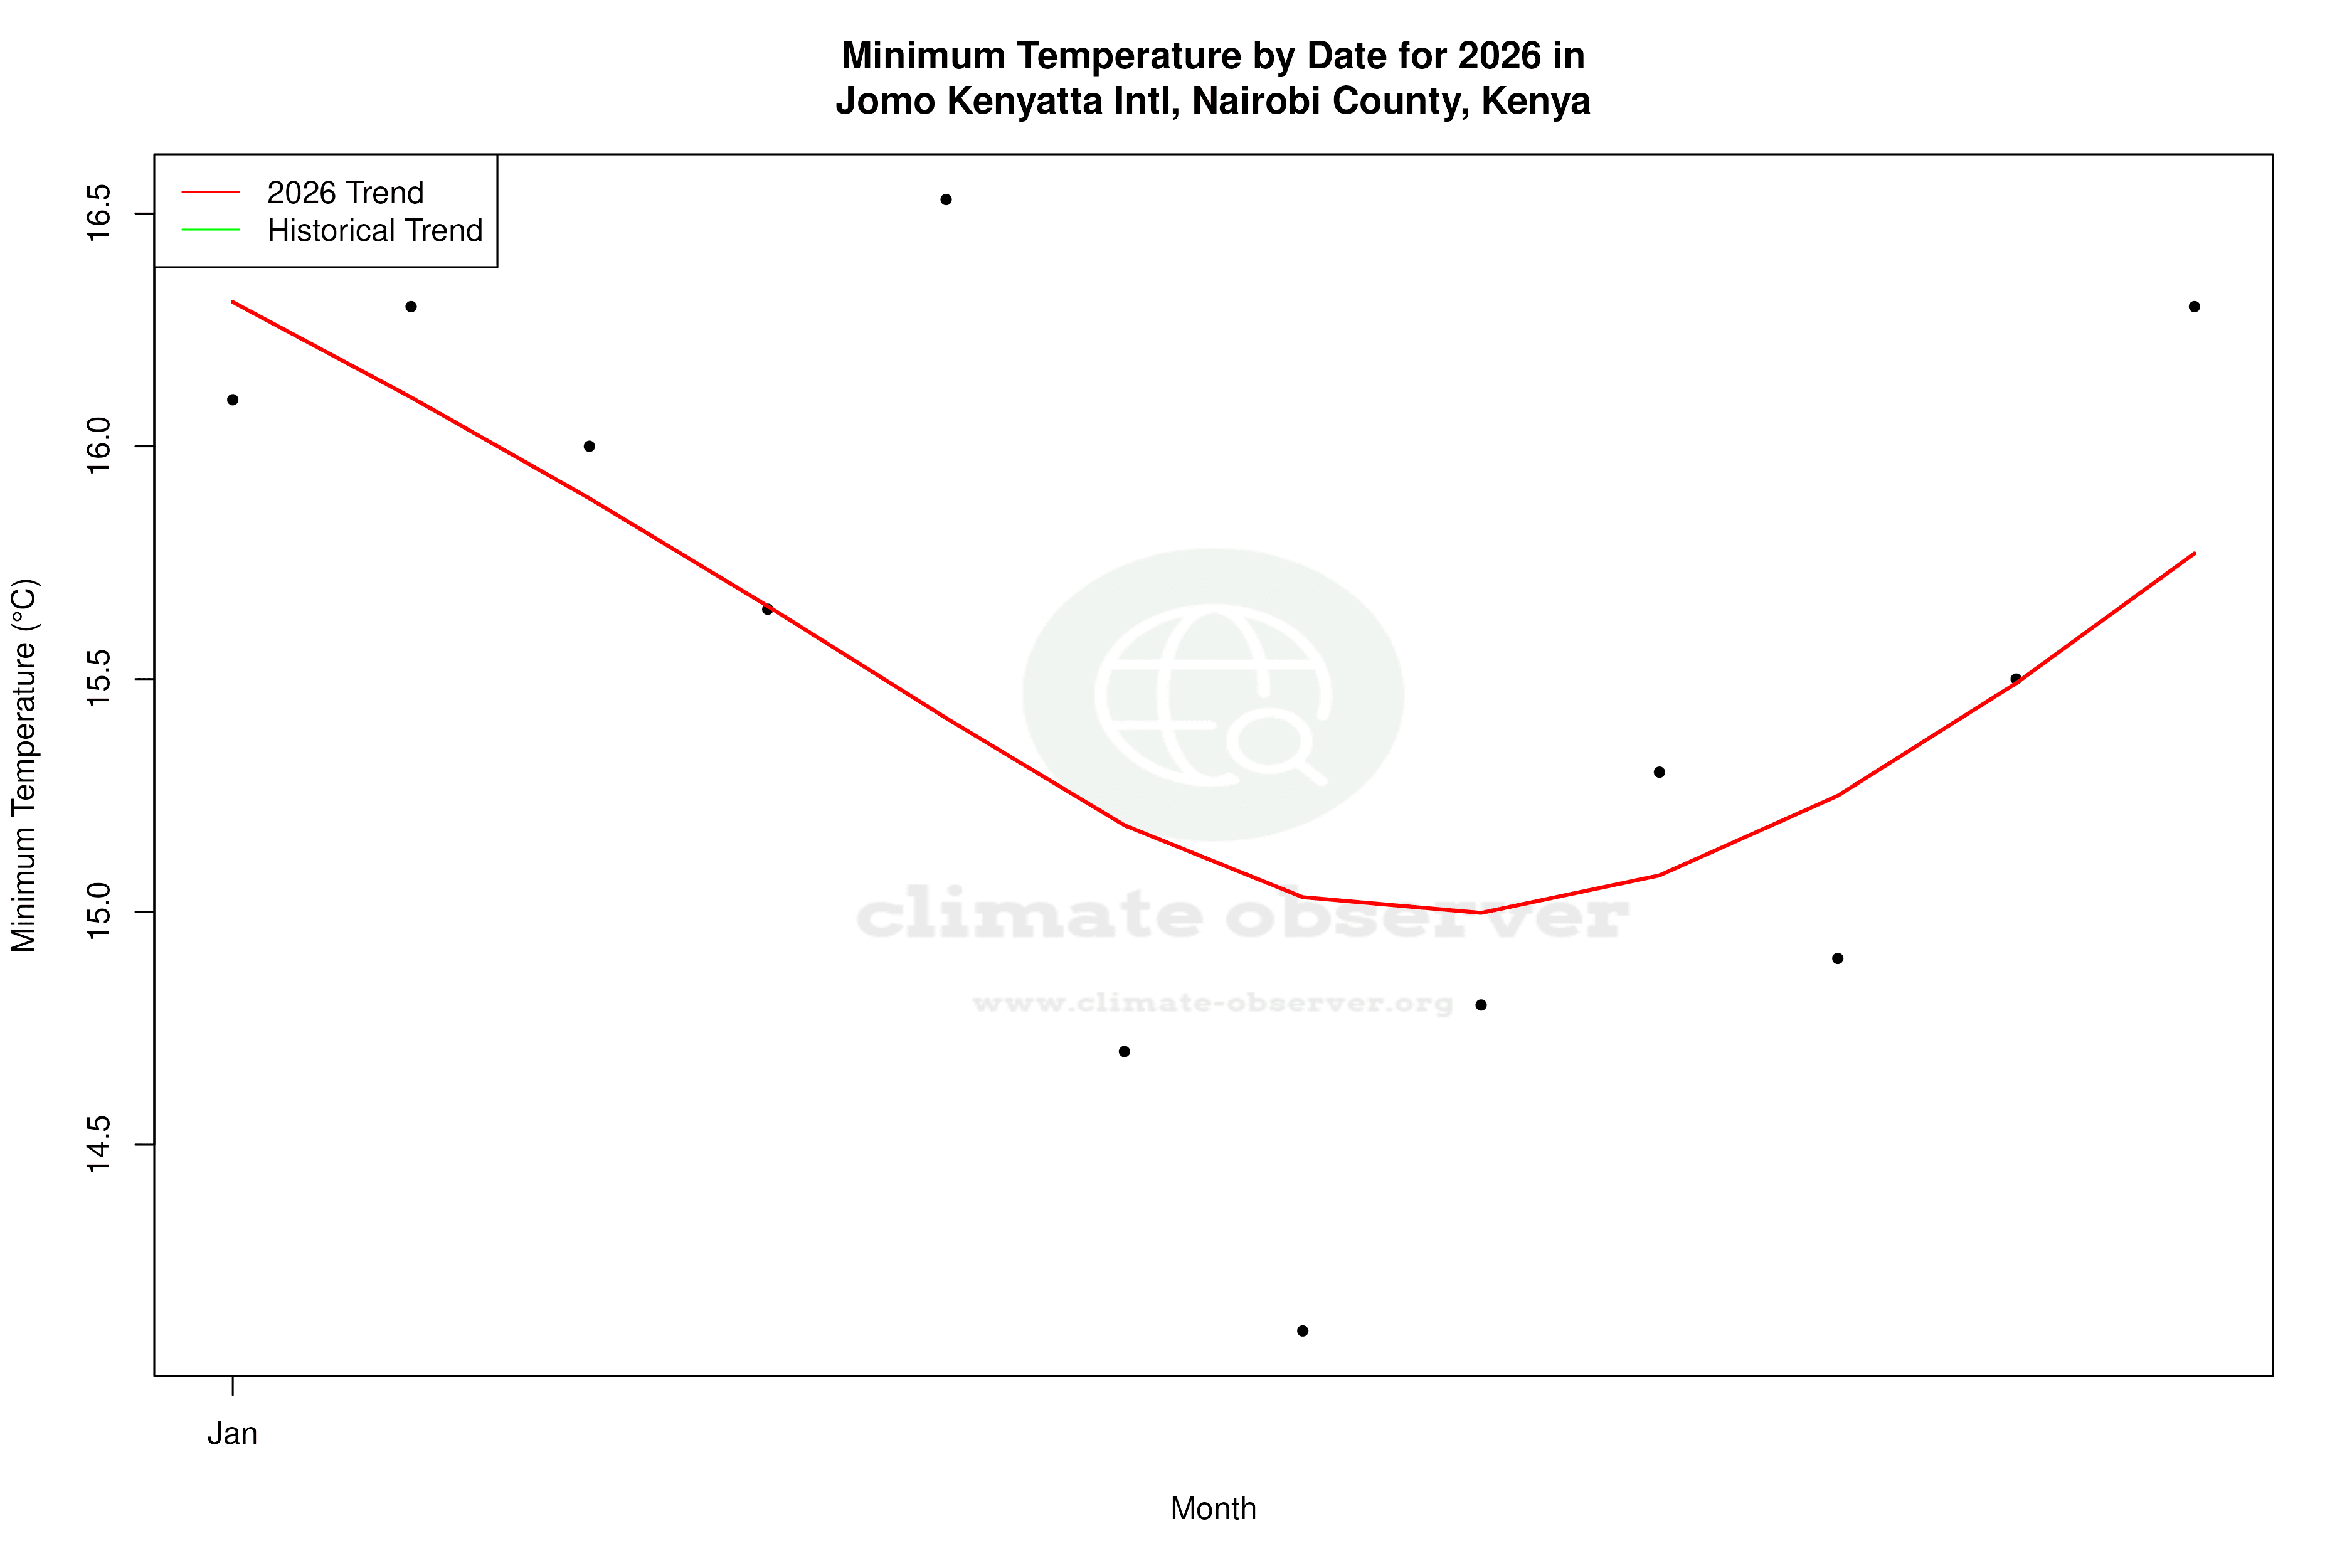
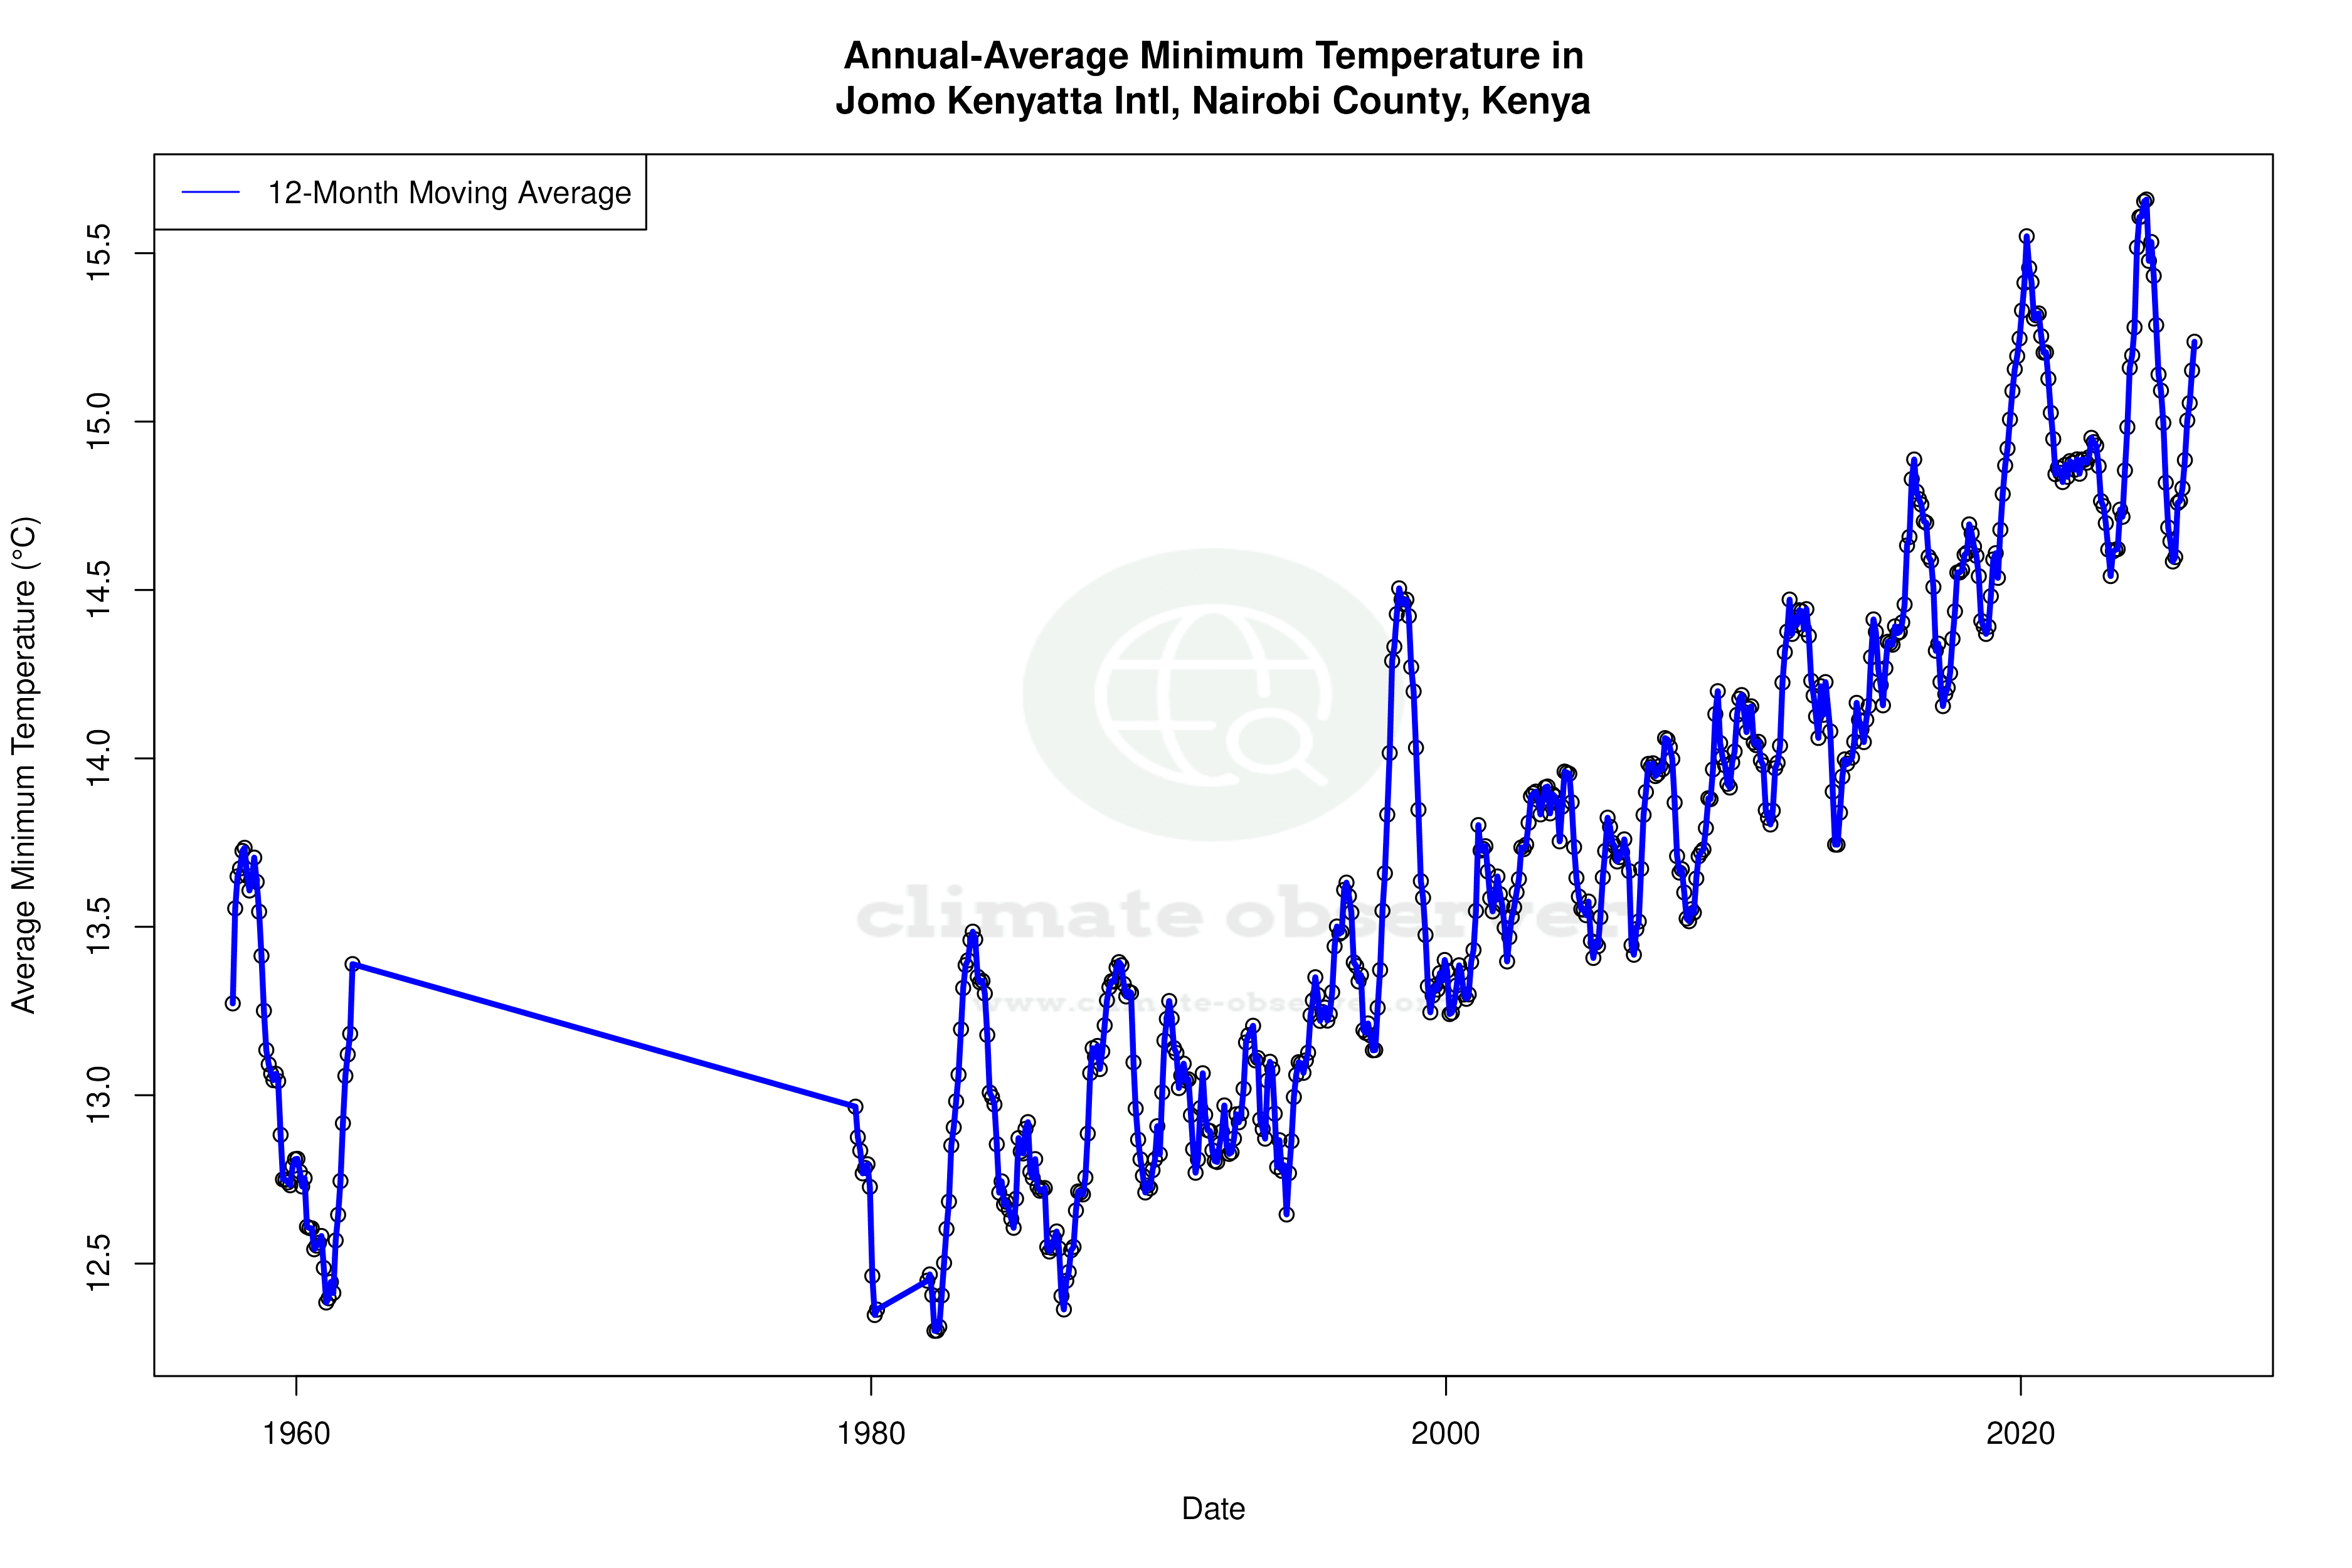
Over the past decade, the airport has seen a cooling trend in high temperatures, with a decrease of 0.68°C (1.22°F). This contrasts with the all-time trend, where high temperatures have shown a slight increase of 0.05°C (0.09°F). Conversely, low temperatures have risen by 0.60°C (1.08°F) over the last ten years, aligning with the all-time warming trend of 0.37°C (0.67°F). These mixed trends highlight the complexity of local climate dynamics, where short-term fluctuations can differ from long-term patterns.
Precipitation Patterns: More Even Distribution
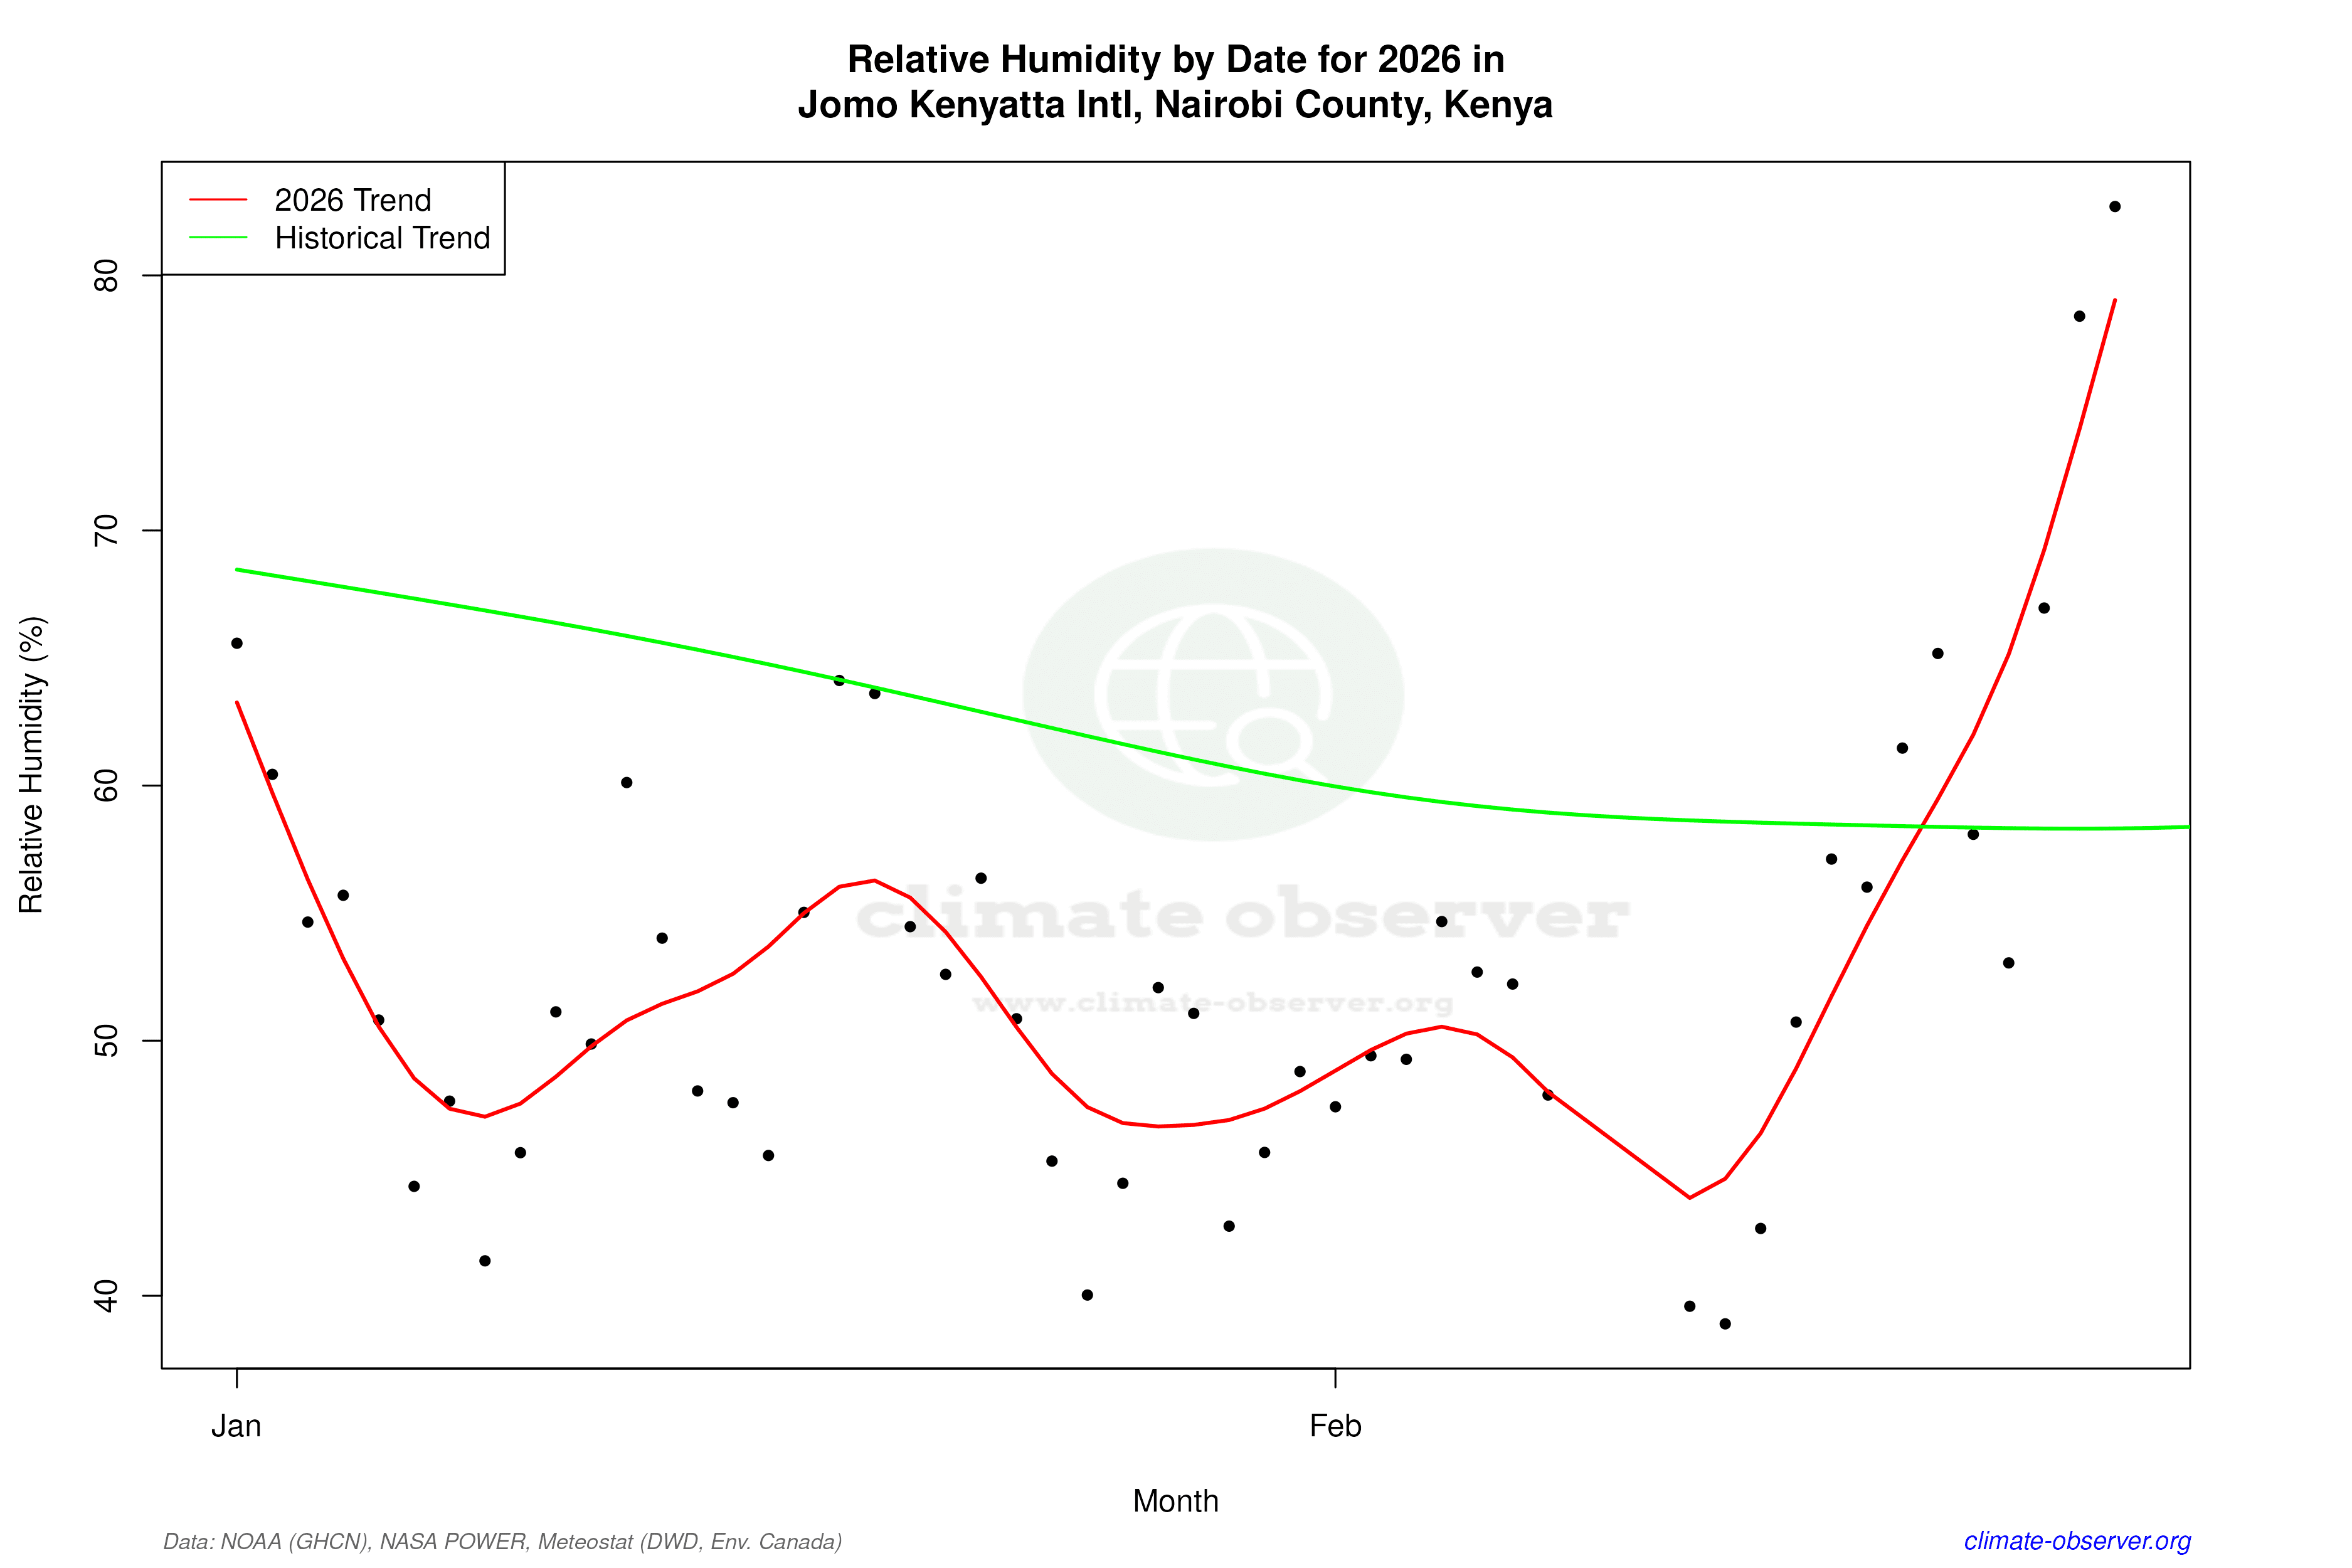
The Precipitation Concentration Index (PCI) at Jomo Kenyatta International Airport has decreased from a baseline of 14.89 to a current value of 14.65. This marginal change indicates that precipitation is becoming more evenly distributed throughout the year. A PCI under 20 suggests a moderate concentration of rainfall events, and the slight decrease points to a trend towards more consistent rainfall, reducing the risk of intense, sporadic downpours.
Temperature Extremes: Record Highs and Lows
The record high temperature at the airport stands at 38.2°C (100.8°F), while the record low is 0.0°C (32.0°F). These extremes underscore the variability in Nairobi's climate, where temperatures can fluctuate significantly. The record low, in particular, is indicative of the occasional cold spells that can occur due to the region's elevation and geographic influences.
Regional Climate Considerations
Kenya's commitment to addressing climate change is evident in its national climate action plans, which aim to mitigate the impacts of temperature and precipitation variability. Recent weather events, such as prolonged dry spells, have highlighted the importance of understanding local climate trends. The data from Jomo Kenyatta International Airport provides valuable insights into these patterns, informing both local and national climate strategies.
Station Statistics
10-Year Trend
High: -0.71 °C/decade
Low: +0.68 °C/decade
Rain: +0.45 mm/decade
25-Year Trend
High: -0.13 °C/decade
Low: +0.70 °C/decade
Rain: +0.05 mm/decade
50-Year Trend
High: +0.05 °C/decade
Low: +0.56 °C/decade
Rain: +0.05 mm/decade
All-Time Trend
High: +0.05 °C/decade
Low: +0.38 °C/decade
Rain: +0.03 mm/decade
Percentage Above-Average Days
Last 12 Months: 51.0%
This Year: 56.7%
Precipitation Concentration Index (PCI) ℹ️
Last 12 Months: 12.1
Historical Average: 16.9
Percentile Rank of Last 12 Months ℹ️
High: 12th percentile
Low: 94th percentile
Rain: 79th percentile
Change in Variance ℹ️
High: -4.0%
Low: -24.2%
Intraday: -17.7%
Data Coverage
85.9%
First Year of Data
1957
Station Location
Historical Weather Records
| Max High | Avg High | Min High | Max Avg | Avg Avg | Min Avg | Max Low | Avg Low | Min Low | Max Precipitation | Avg Precipitation | Max Snow | Avg Snow | |
|---|---|---|---|---|---|---|---|---|---|---|---|---|---|
| Record | 38.2 °C | — | 14.8 °C | 25.6 °C | — | 11.3 °C | 20.0 °C | — | 0.0 °C | 112.3 mm | — | — | — |
| January | 32.2 °C | 26.8 °C | 19.0 °C | 24.1 °C | 19.9 °C | 15.3 °C | 18.0 °C | 13.6 °C | 5.6 °C | 60.2 mm | 1.6 mm | — | — |
| February | 38.2 °C | 28.1 °C | 20.0 °C | 25.6 °C | 20.7 °C | 14.7 °C | 18.2 °C | 13.7 °C | 6.0 °C | 76.2 mm | 1.6 mm | — | — |
| March | 33.5 °C | 28.0 °C | 19.8 °C | 25.4 °C | 20.8 °C | 14.8 °C | 20.0 °C | 14.7 °C | 7.0 °C | 68.4 mm | 2.5 mm | — | — |
| April | 32.1 °C | 26.1 °C | 20.0 °C | 24.7 °C | 19.9 °C | 15.2 °C | 19.0 °C | 15.3 °C | 9.4 °C | 101.9 mm | 4.8 mm | — | — |
| May | 31.1 °C | 24.8 °C | 18.8 °C | 23.9 °C | 19.0 °C | 15.3 °C | 18.0 °C | 14.5 °C | 7.4 °C | 101.1 mm | 3.6 mm | — | — |
| June | 32.0 °C | 23.9 °C | 16.1 °C | 22.4 °C | 17.8 °C | 12.8 °C | 17.0 °C | 12.7 °C | 2.3 °C | 45.5 mm | 0.9 mm | — | — |
| July | 29.7 °C | 23.4 °C | 14.8 °C | 22.3 °C | 17.1 °C | 11.4 °C | 16.0 °C | 11.7 °C | 5.0 °C | 19.8 mm | 0.4 mm | — | — |
| August | 31.0 °C | 24.0 °C | 16.0 °C | 22.8 °C | 17.4 °C | 12.4 °C | 16.3 °C | 12.0 °C | 0.0 °C | 38.1 mm | 0.5 mm | — | — |
| September | 31.6 °C | 26.2 °C | 16.2 °C | 23.4 °C | 18.6 °C | 11.3 °C | 17.0 °C | 12.4 °C | 1.8 °C | 36.8 mm | 0.6 mm | — | — |
| October | 33.0 °C | 27.0 °C | 18.1 °C | 24.4 °C | 19.7 °C | 13.9 °C | 18.4 °C | 13.9 °C | 7.0 °C | 67.6 mm | 1.5 mm | — | — |
| November | 31.0 °C | 25.3 °C | 17.0 °C | 22.7 °C | 19.2 °C | 15.6 °C | 18.0 °C | 14.7 °C | 7.0 °C | 78.0 mm | 4.3 mm | — | — |
| December | 32.0 °C | 25.5 °C | 18.0 °C | 24.3 °C | 19.3 °C | 14.9 °C | 18.0 °C | 14.4 °C | 7.0 °C | 112.3 mm | 2.8 mm | — | — |
Data Visualisations
Remove WatermarksCurrent Year Climate Trends vs Historical
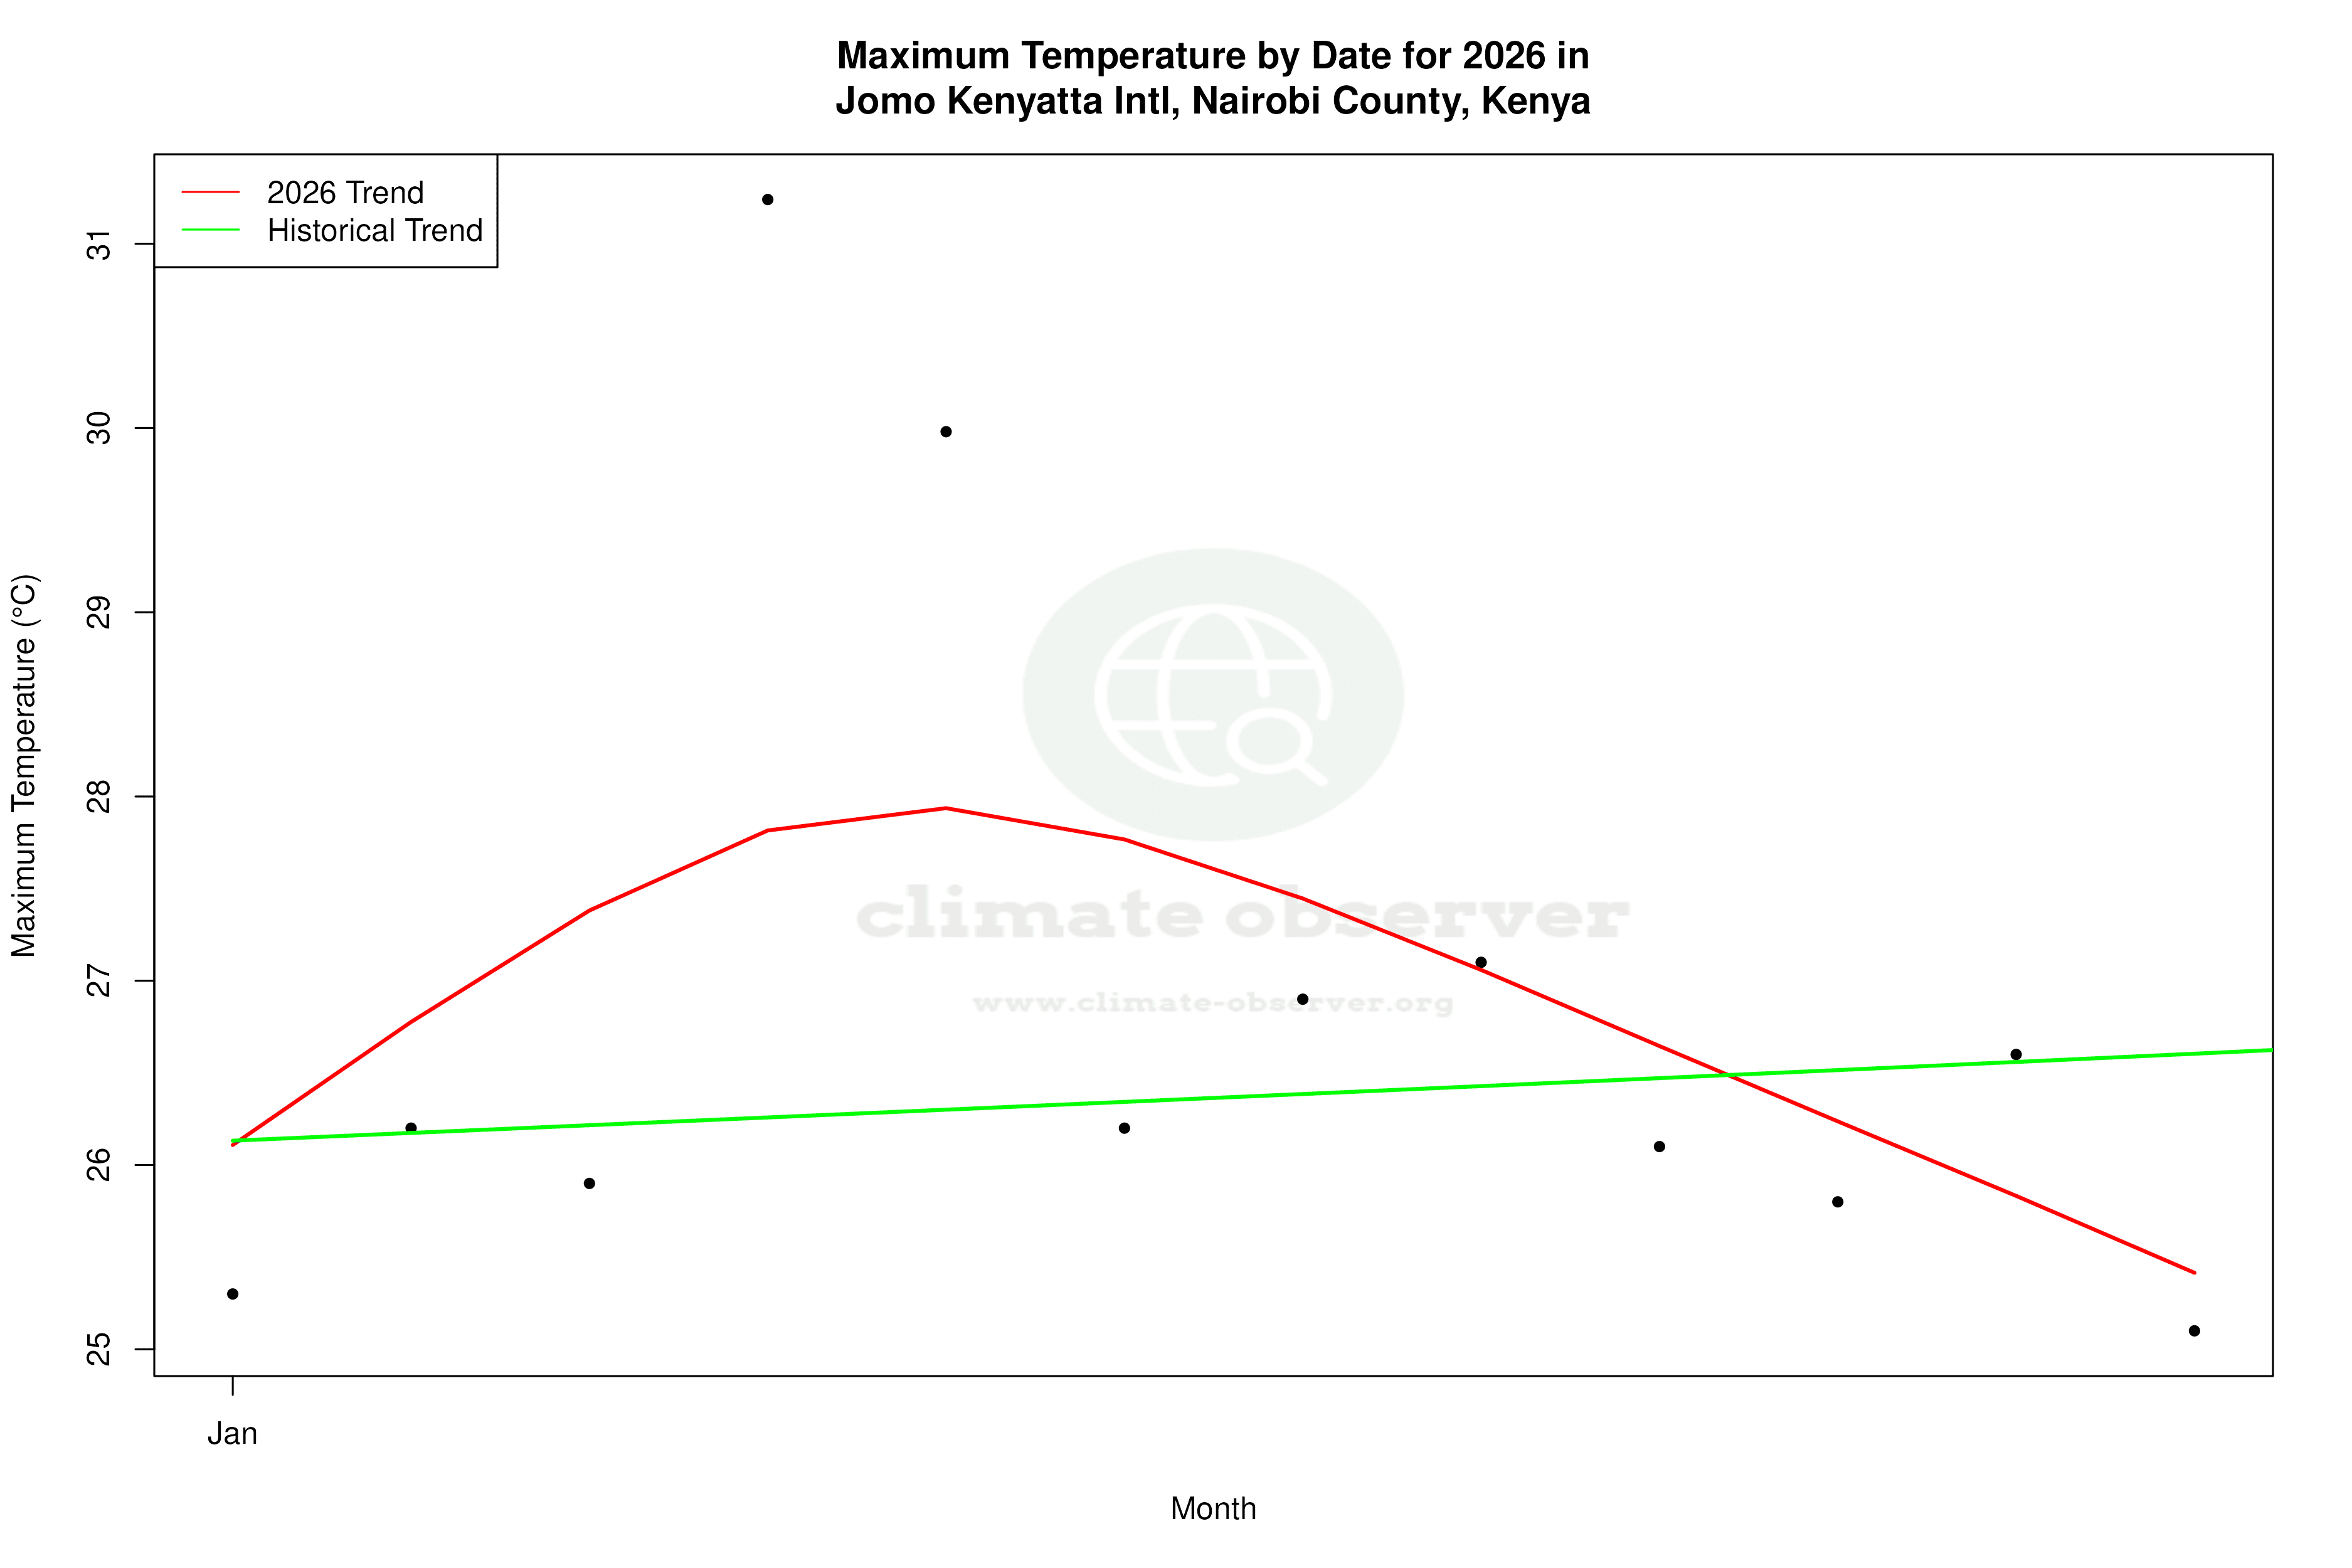


Max Temperature this Year | 1 of 6
Climate 12-Month Moving Averages


Max Temperature 12-Month MA | 1 of 6
Daily Data Points and Averages Throughout the Year


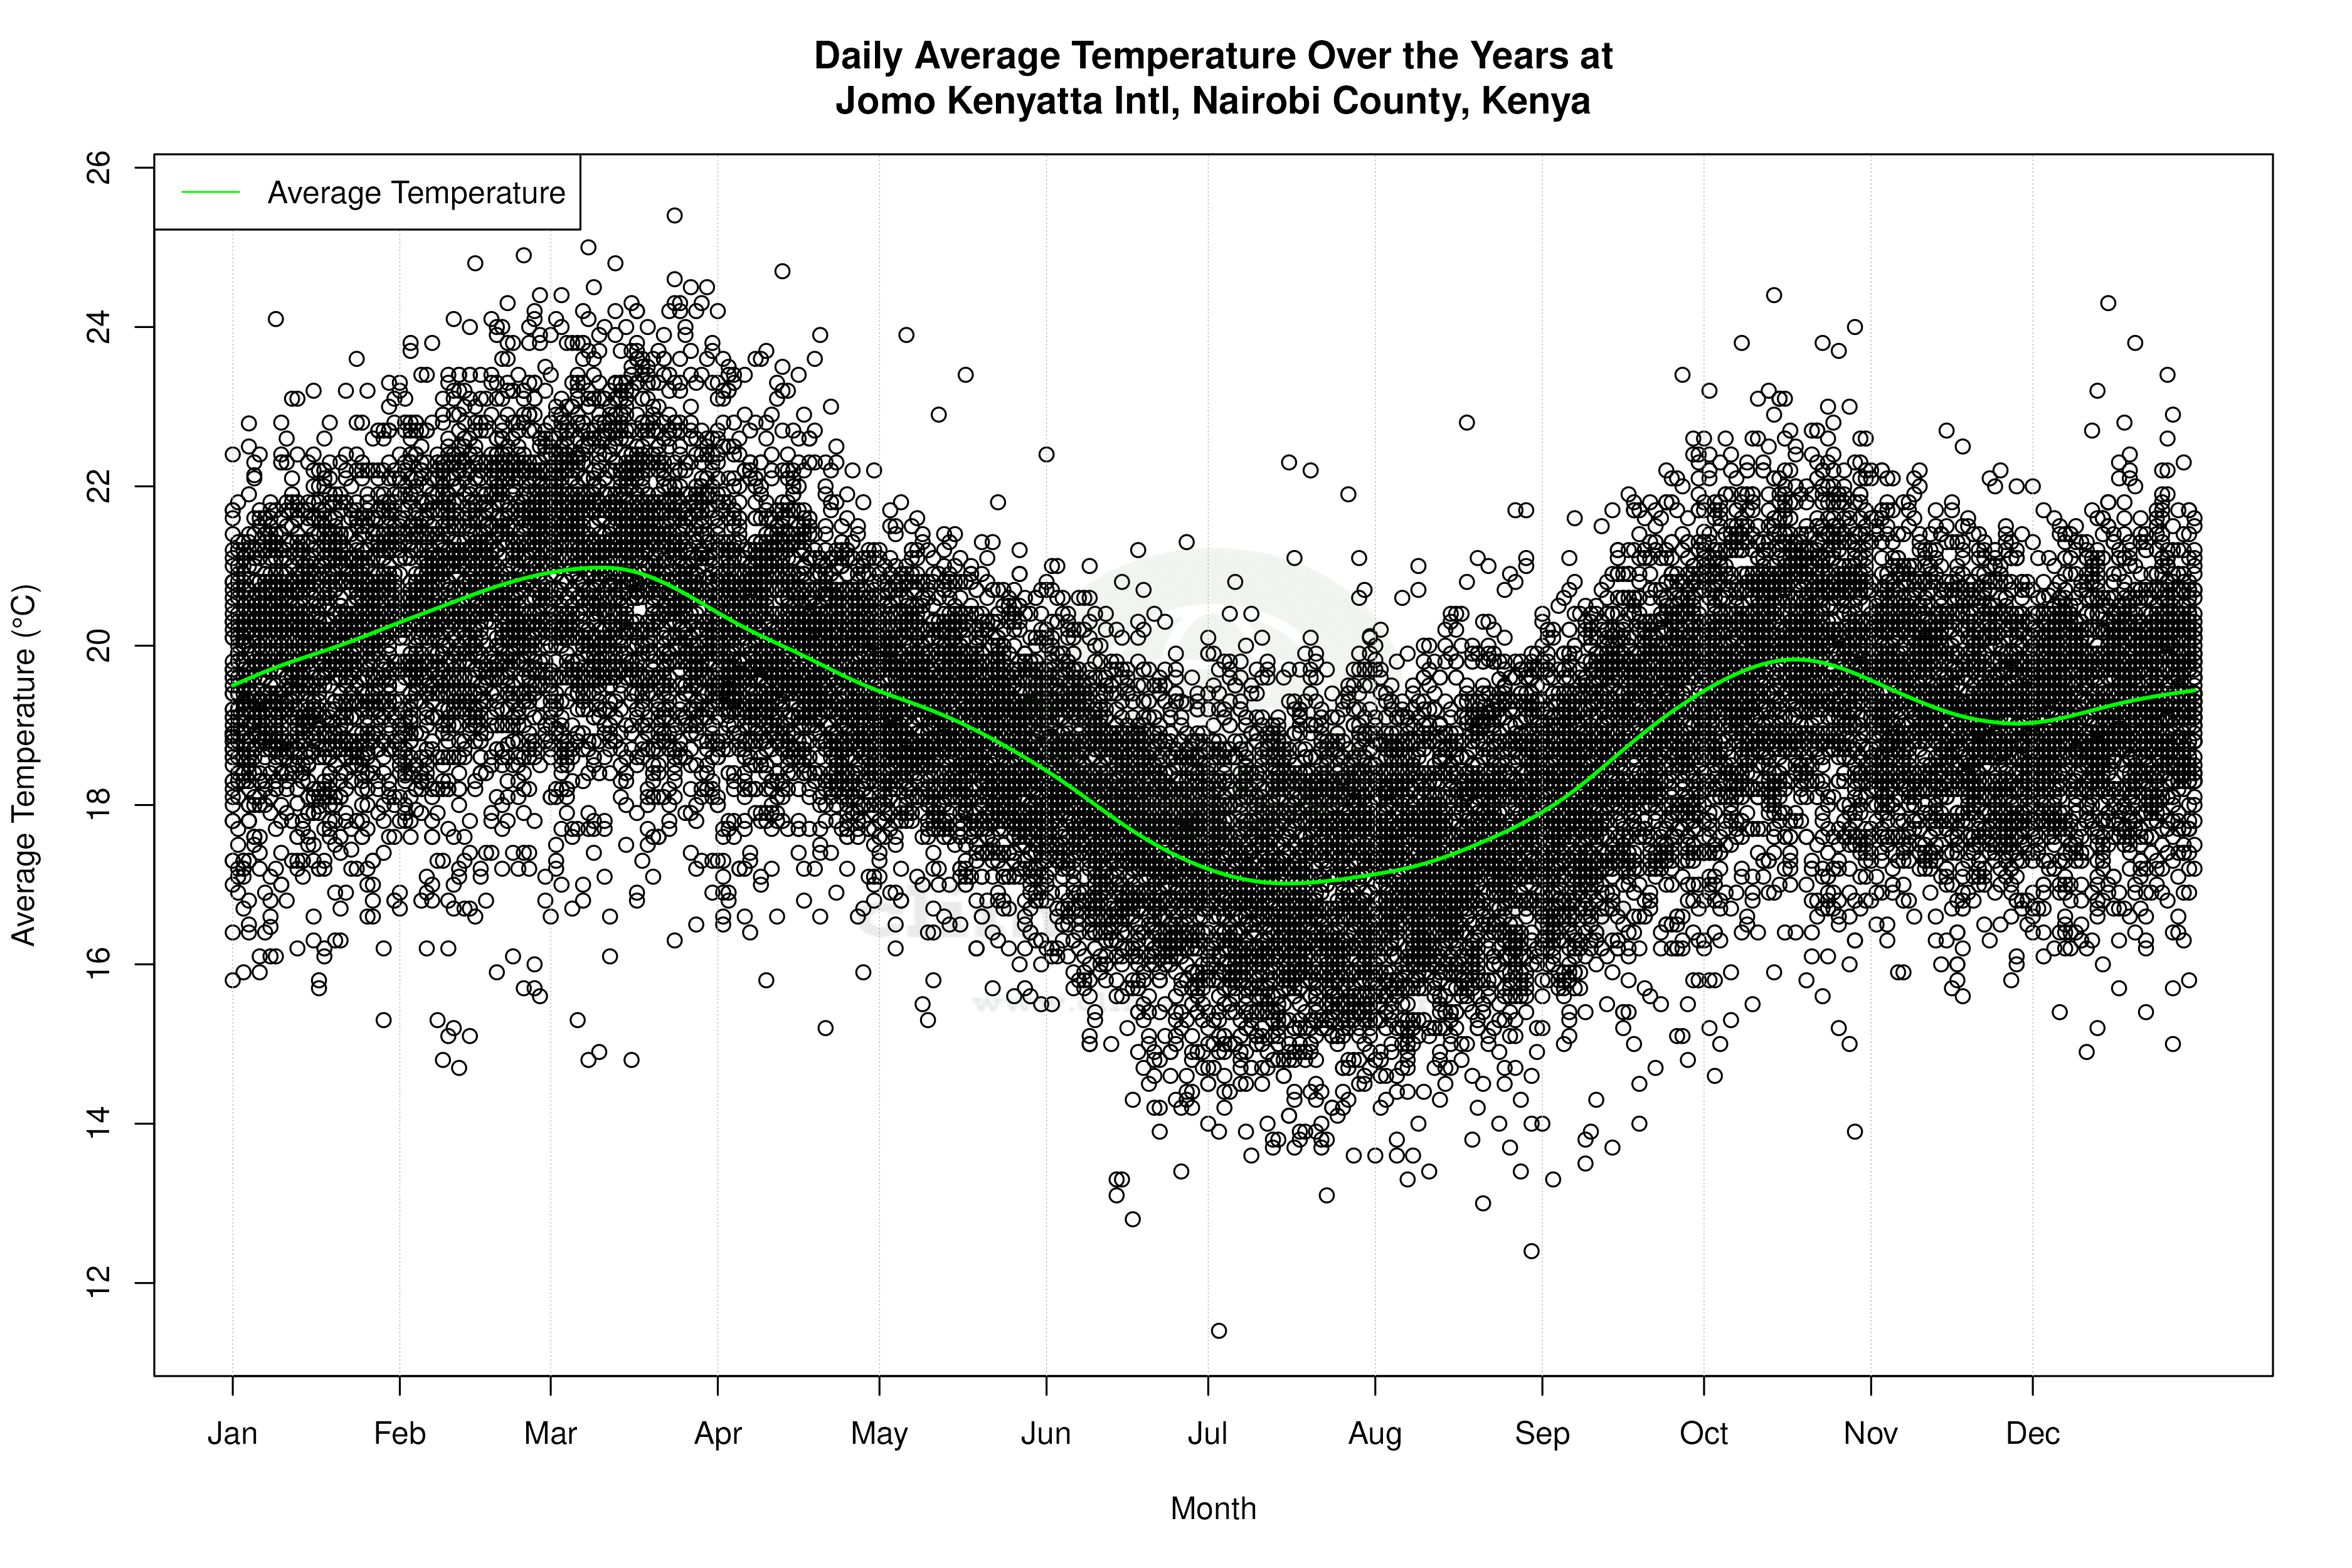


Average Max Temperature Throughout Year | 1 of 5
