Climate for Station: Sinuiju, North Pyongan, Korea, North
Loading live weather...
Climate Analysis & Overview
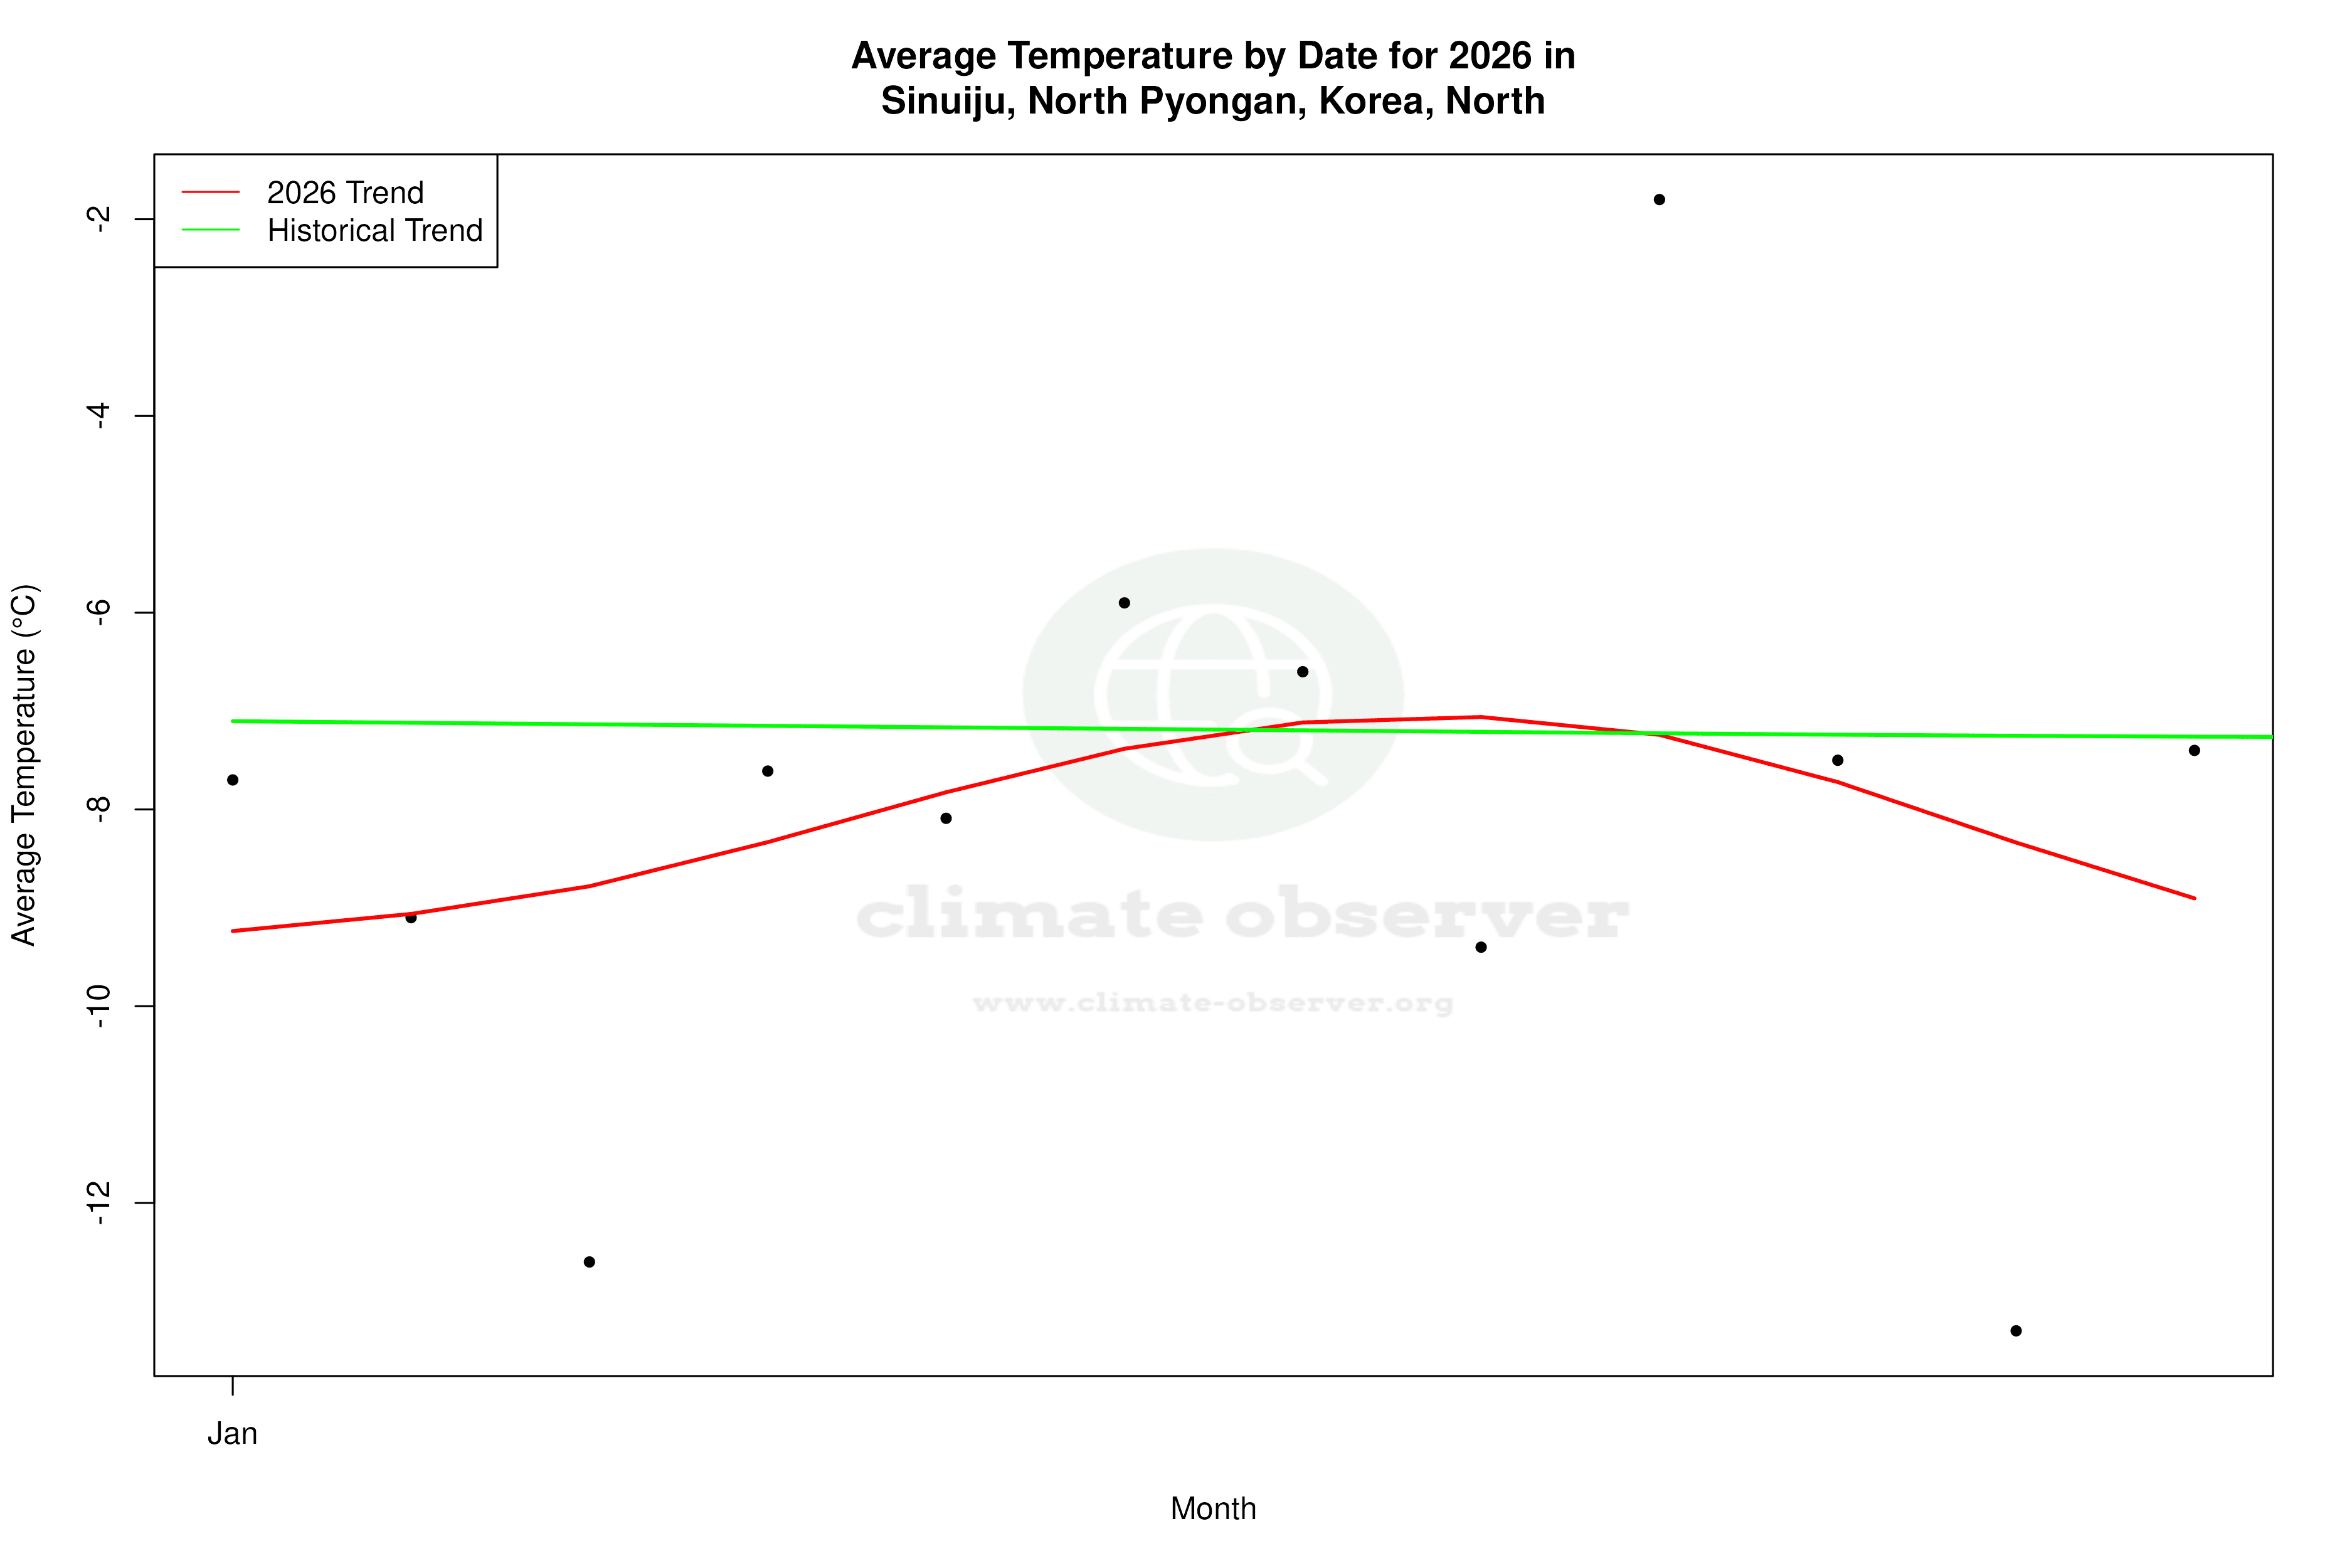
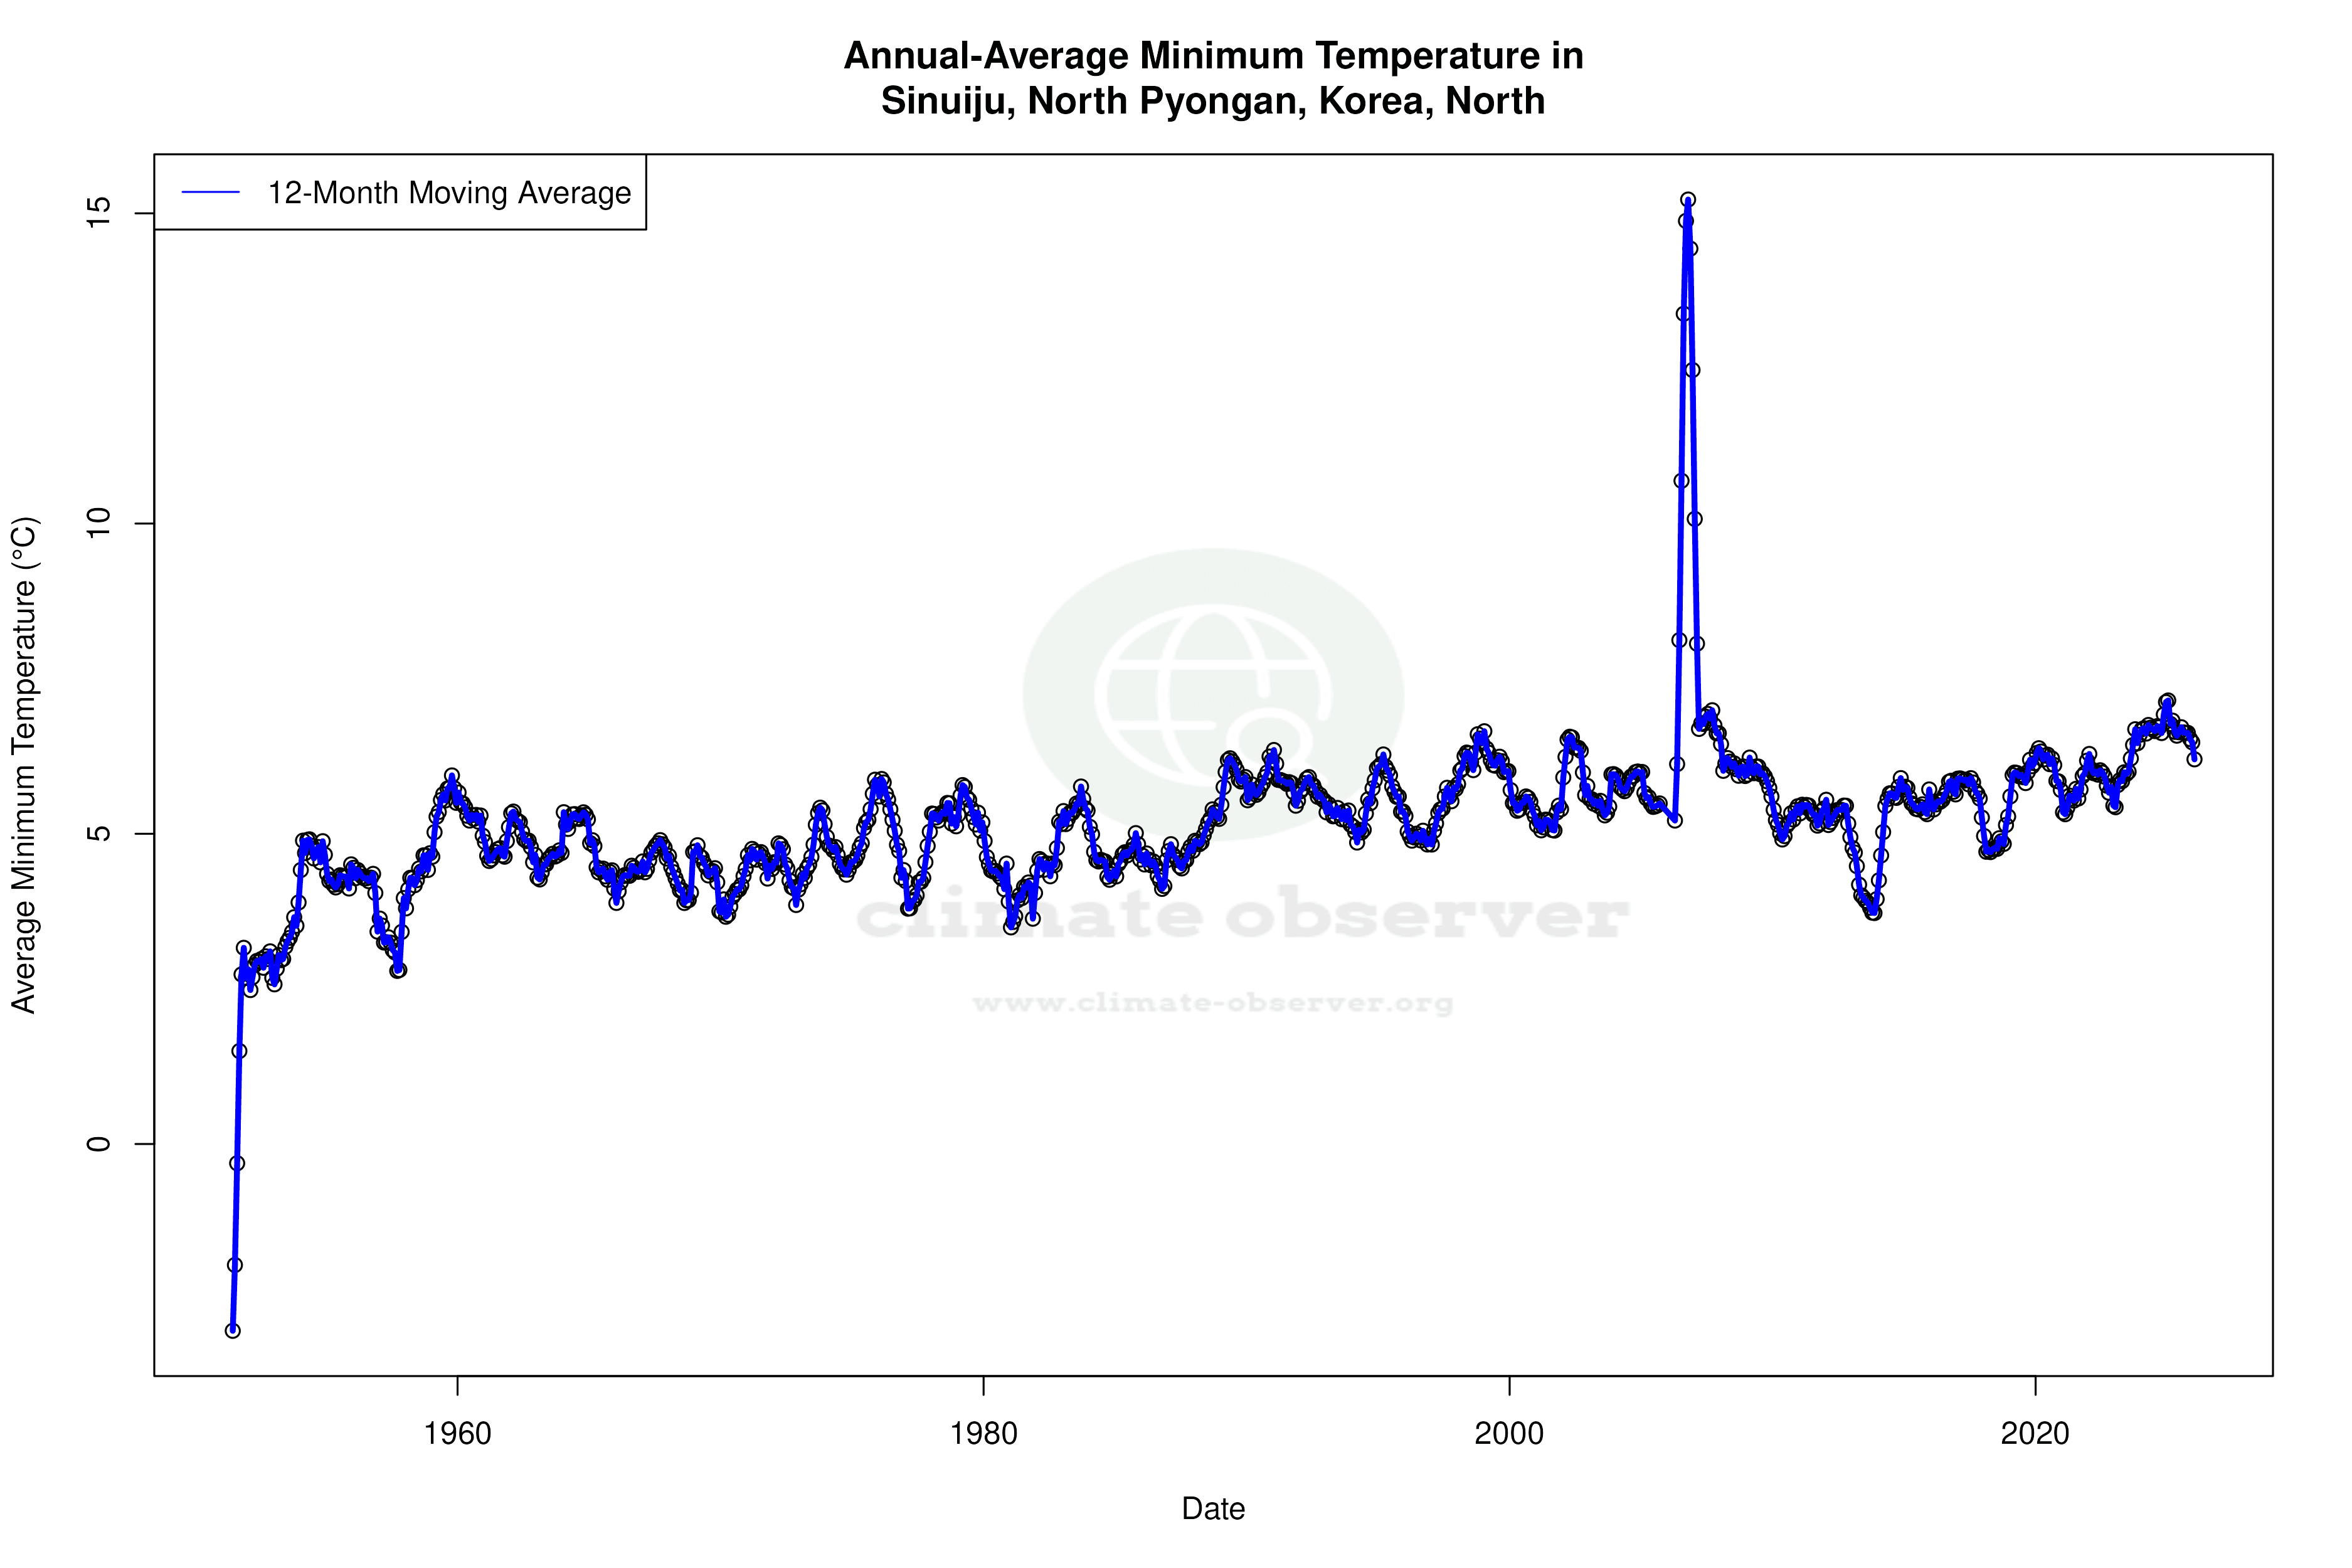
Sinuiju, located in North Korea's P'yŏngan-bukto province, is experiencing a nuanced climate evolution with a 0.23°C (0.41°F) rise in all-time high temperatures and a 0.28°C (0.50°F) increase in all-time lows. Over the past decade, however, highs have cooled by 0.38°C (0.68°F), while lows have risen significantly by 1.98°C (3.56°F), indicating a complex interplay of climatic factors.
Köppen Climate Context
Sinuiju falls under the Dwa classification in the Köppen climate system, characterised by a monsoon-influenced humid continental climate with cold winters and hot, humid summers. Its proximity to the Yalu River and the Yellow Sea significantly influences its weather patterns, contributing to the seasonal variability observed in temperature and precipitation.
Temperature Trends: A Divergent Decade
The past decade has witnessed a cooling trend in high temperatures with a decrease of 0.38°C (0.68°F), contrasting with the long-term warming trend of 0.23°C (0.41°F). This suggests recent years have been cooler than the historical average for highs. Conversely, low temperatures have experienced a notable increase of 1.98°C (3.56°F) over the same period, overshadowing the more modest all-time rise of 0.28°C (0.50°F). This divergence indicates a narrowing of the temperature range, with warmer nights becoming more prevalent.
Precipitation Patterns: Concentration and Change
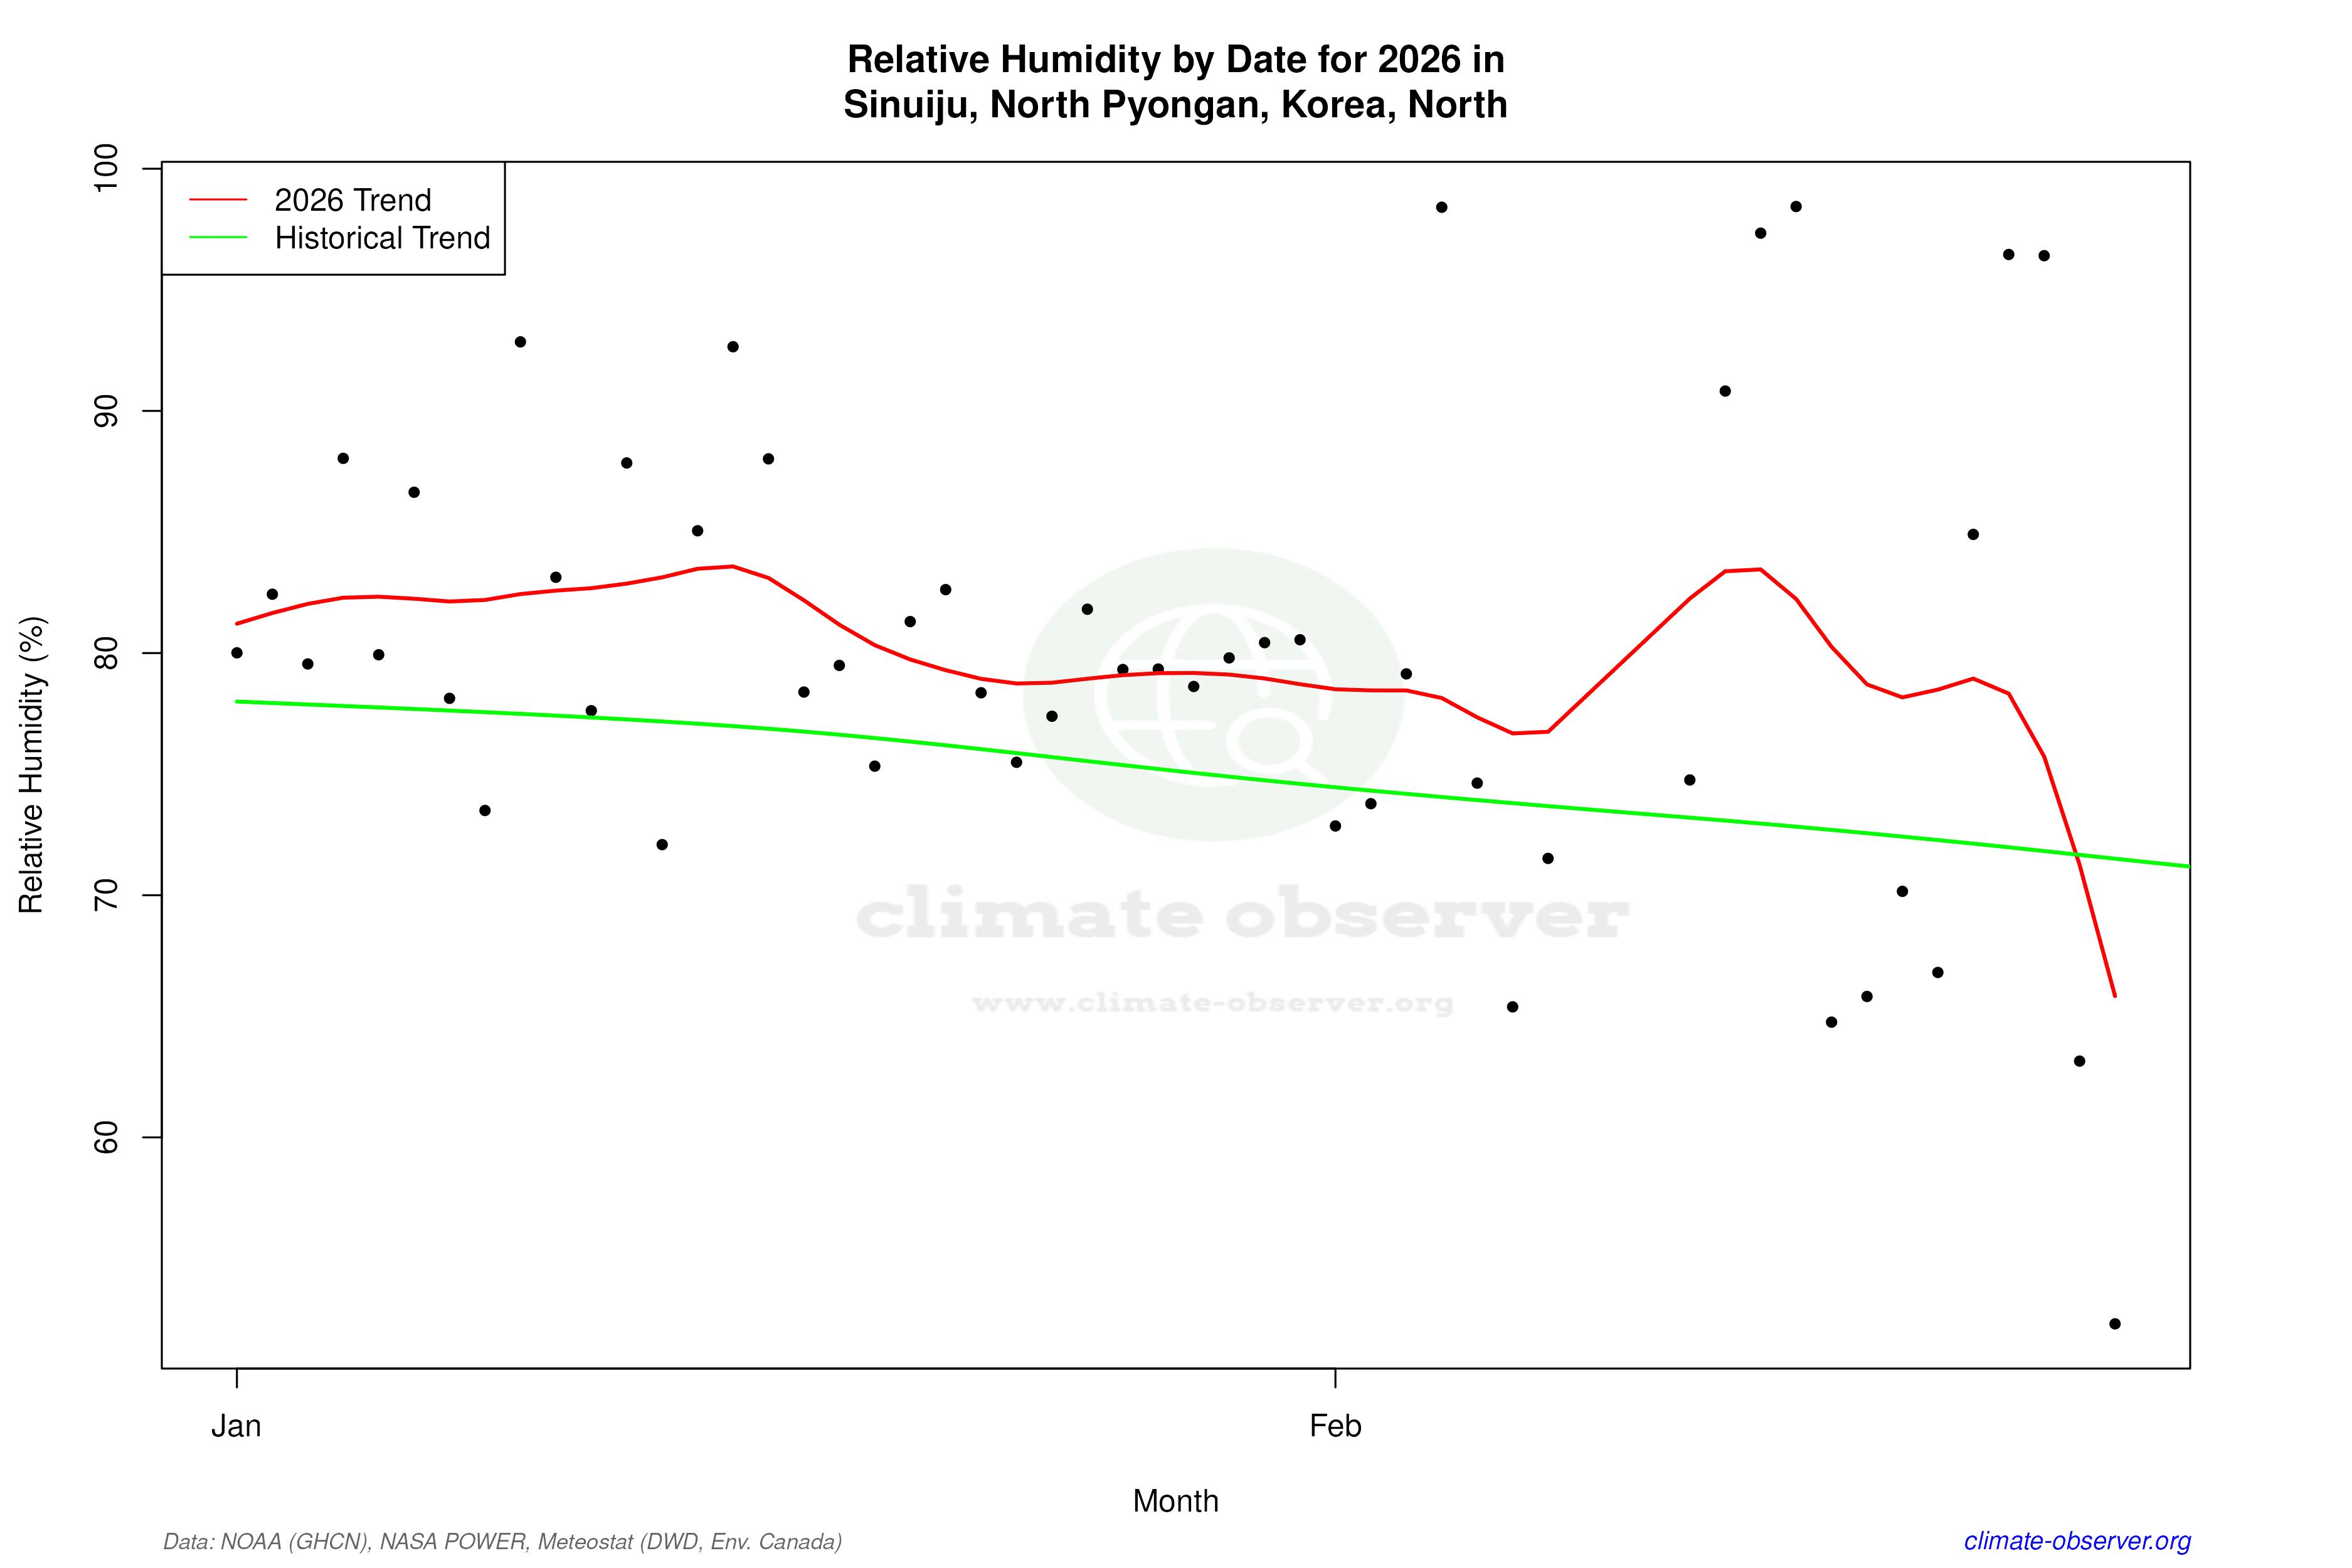
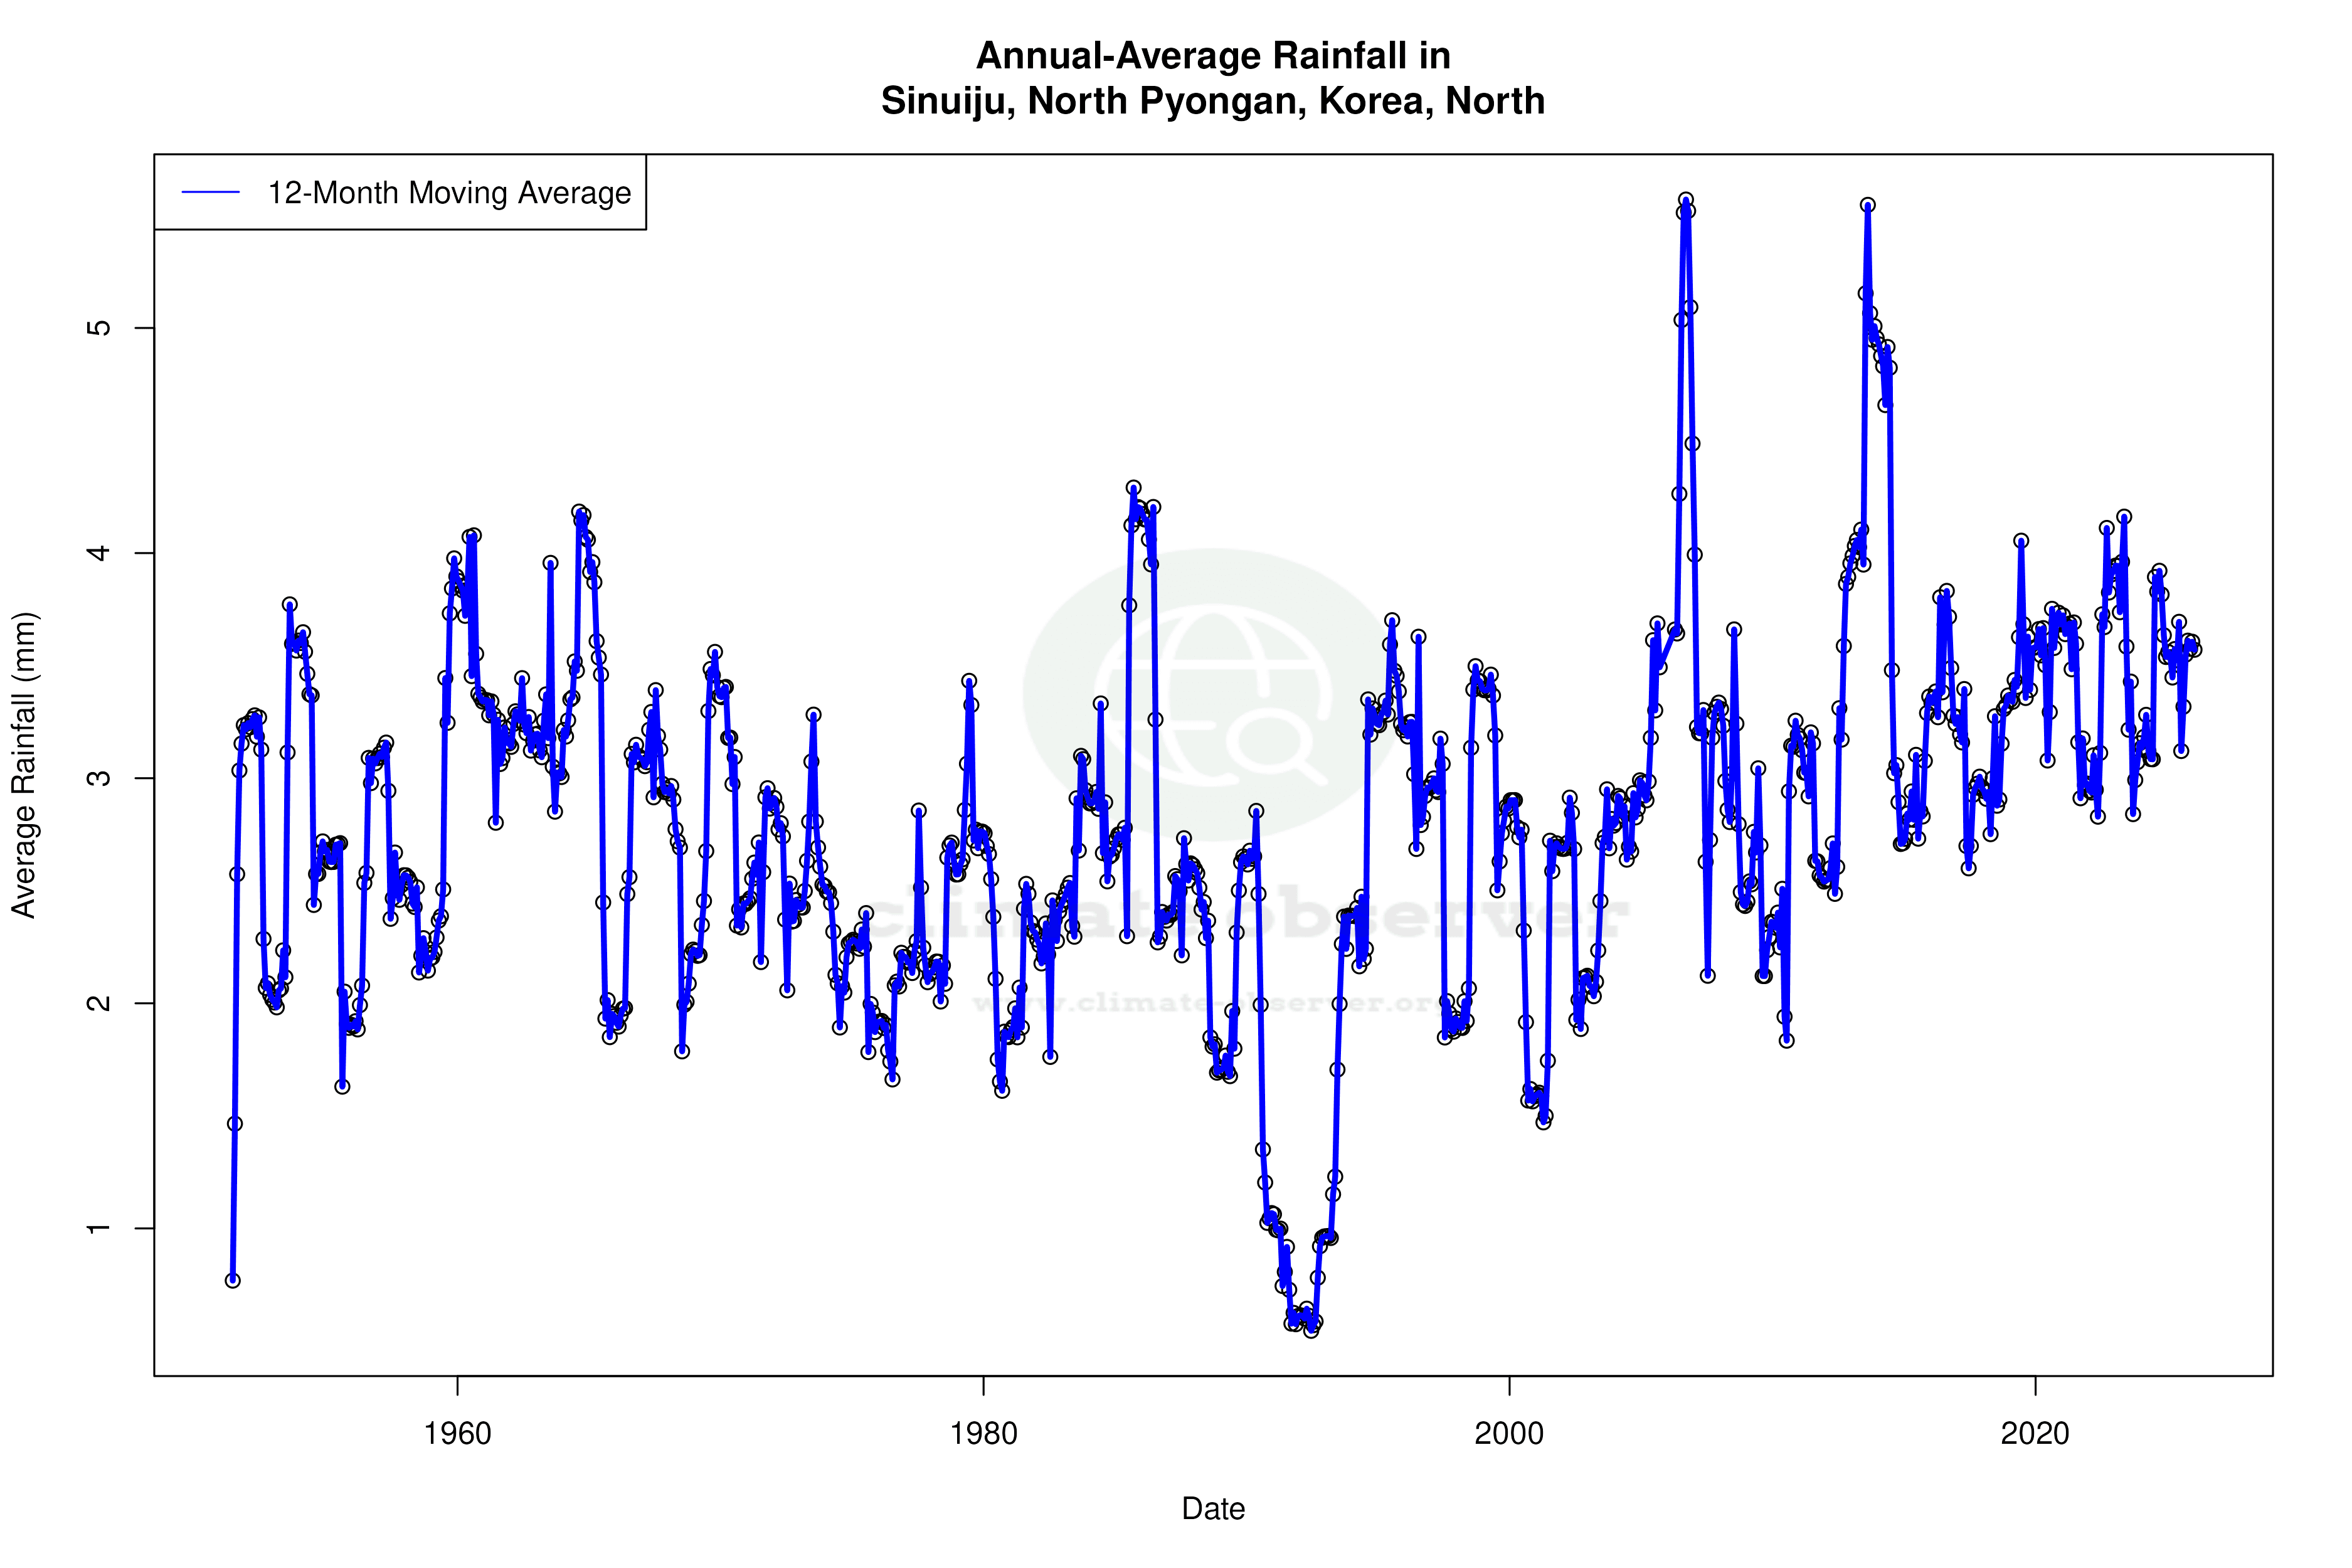
The Precipitation Concentration Index (PCI) for Sinuiju has shown a slight increase from a baseline of 20.29 to a current value of 20.34. This marginal rise suggests that precipitation events are becoming slightly more concentrated, occurring in fewer, more intense episodes rather than being evenly distributed throughout the year. A PCI value above 20 indicates a high concentration, which can lead to challenges in water management and agriculture, particularly in a region reliant on seasonal rains.
Regional Climate Implications
North Korea's climate strategy aims to mitigate the impacts of climate change on agriculture and water resources, making these trends particularly relevant. The warming of low temperatures could extend the growing season, yet the increased concentration of precipitation events may exacerbate flood risks. The observed cooling of high temperatures over the past decade could be a temporary reprieve or a signal of shifting climatic patterns that require ongoing monitoring and adaptation.
Extreme Temperature Records
Sinuiju's climate extremes are marked by an absolute maximum temperature of 38.5°C (101.3°F) and a minimum of -28.0°C (-18.4°F), illustrating the region's significant seasonal temperature variability. These records underscore the potential for extreme weather events, which can have profound impacts on infrastructure and daily life.
Station Statistics
10-Year Trend
High: -2.06 °F/decade
Low: +1.37 °F/decade
Rain: +0.007 in/decade
25-Year Trend
High: -0.93 °F/decade
Low: -0.32 °F/decade
Rain: +0.013 in/decade
50-Year Trend
High: +0.04 °F/decade
Low: +0.16 °F/decade
Rain: +0.008 in/decade
All-Time Trend
High: +0.22 °F/decade
Low: +0.29 °F/decade
Rain: +0.002 in/decade
Percentage Above-Average Days
Last 12 Months: 54.2%
This Year: 68.6%
Precipitation Concentration Index (PCI) ℹ️
Last 12 Months: 20.8
Historical Average: 20.7
Percentile Rank of Last 12 Months ℹ️
High: 58th percentile
Low: 82nd percentile
Rain: 84th percentile
Change in Variance ℹ️
High: -0.9%
Low: +0.0%
Intraday: -4.5%
Data Coverage
99.9%
First Year of Data
1951
Station Location
Historical Weather Records
| Max High | Avg High | Min High | Max Avg | Avg Avg | Min Avg | Max Low | Avg Low | Min Low | Max Precipitation | Avg Precipitation | Max Snow | Avg Snow | |
|---|---|---|---|---|---|---|---|---|---|---|---|---|---|
| Record | 101.30 °F | — | -0.04 °F | 91.58 °F | — | -4.54 °F | 82.22 °F | — | -18.40 °F | 10.33 in | — | — | — |
| January | 49.10 °F | 28.46 °F | -0.04 °F | 39.20 °F | 19.30 °F | -4.54 °F | 35.42 °F | 11.23 °F | -18.04 °F | 2.05 in | 0.01 in | — | — |
| February | 59.90 °F | 34.81 °F | 8.24 °F | 47.66 °F | 25.47 °F | -3.28 °F | 42.80 °F | 16.92 °F | -18.40 °F | 1.36 in | 0.02 in | — | — |
| March | 71.60 °F | 45.99 °F | 9.32 °F | 57.74 °F | 36.65 °F | 5.54 °F | 46.58 °F | 28.29 °F | -3.82 °F | 2.99 in | 0.03 in | — | — |
| April | 83.12 °F | 59.65 °F | 33.98 °F | 67.46 °F | 49.48 °F | 28.22 °F | 57.02 °F | 40.06 °F | 19.40 °F | 2.87 in | 0.07 in | — | — |
| May | 89.60 °F | 70.21 °F | 48.56 °F | 76.82 °F | 60.22 °F | 44.96 °F | 65.12 °F | 51.08 °F | 27.32 °F | 3.06 in | 0.10 in | — | — |
| June | 98.60 °F | 77.07 °F | 57.74 °F | 82.76 °F | 68.49 °F | 51.08 °F | 75.56 °F | 61.11 °F | 41.54 °F | 4.34 in | 0.15 in | — | — |
| July | 98.96 °F | 81.72 °F | 68.00 °F | 88.52 °F | 74.77 °F | 63.32 °F | 80.24 °F | 69.14 °F | 50.18 °F | 9.06 in | 0.37 in | — | — |
| August | 101.30 °F | 83.27 °F | 62.42 °F | 91.58 °F | 75.38 °F | 60.80 °F | 82.22 °F | 68.91 °F | 49.10 °F | 10.33 in | 0.33 in | — | — |
| September | 91.40 °F | 76.39 °F | 56.84 °F | 82.22 °F | 66.25 °F | 47.84 °F | 75.92 °F | 57.65 °F | 37.04 °F | 4.53 in | 0.13 in | — | — |
| October | 85.46 °F | 63.79 °F | 34.70 °F | 72.86 °F | 53.18 °F | 27.50 °F | 66.74 °F | 44.14 °F | 22.46 °F | 2.40 in | 0.07 in | — | — |
| November | 70.70 °F | 46.81 °F | 14.00 °F | 62.96 °F | 37.87 °F | 10.58 °F | 56.66 °F | 30.29 °F | 5.00 °F | 4.71 in | 0.05 in | — | — |
| December | 57.02 °F | 32.20 °F | 2.84 °F | 48.74 °F | 23.83 °F | -2.20 °F | 41.18 °F | 16.41 °F | -11.74 °F | 1.22 in | 0.02 in | — | — |
Data Visualisations
Remove WatermarksCurrent Year Climate Trends vs Historical


Max Temperature this Year | 1 of 6
Climate 12-Month Moving Averages


Max Temperature 12-Month MA | 1 of 6
Daily Data Points and Averages Throughout the Year
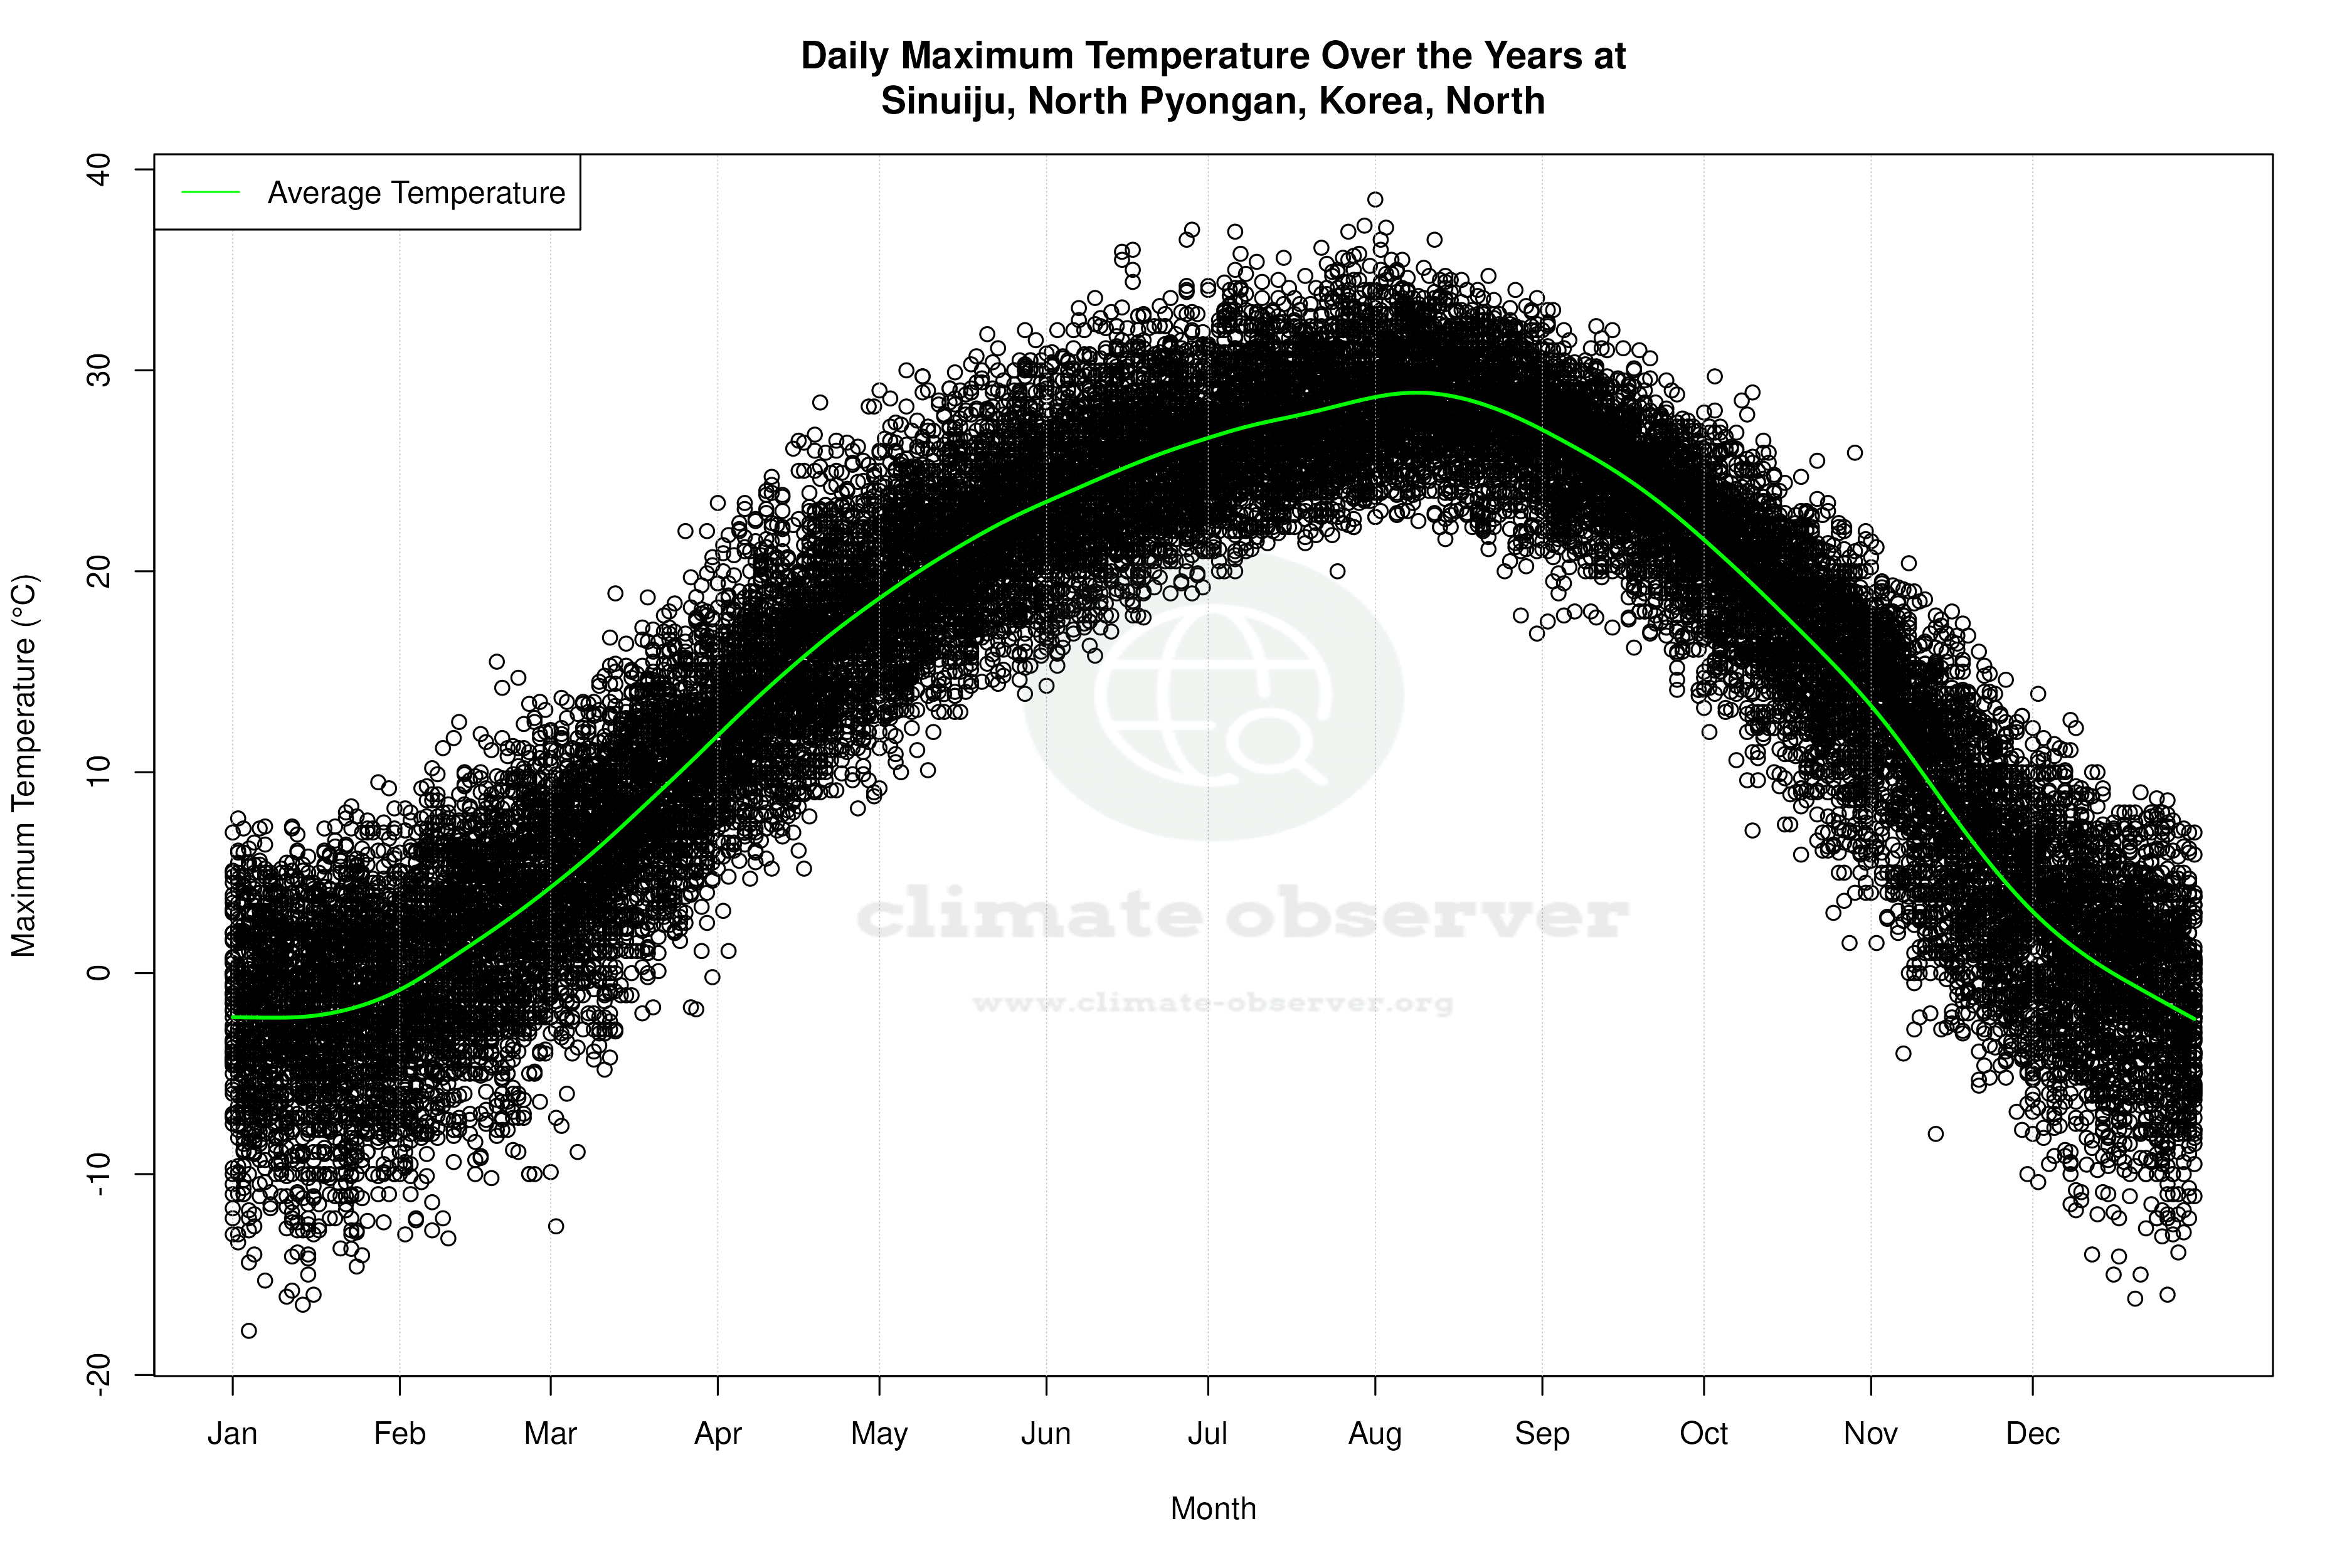

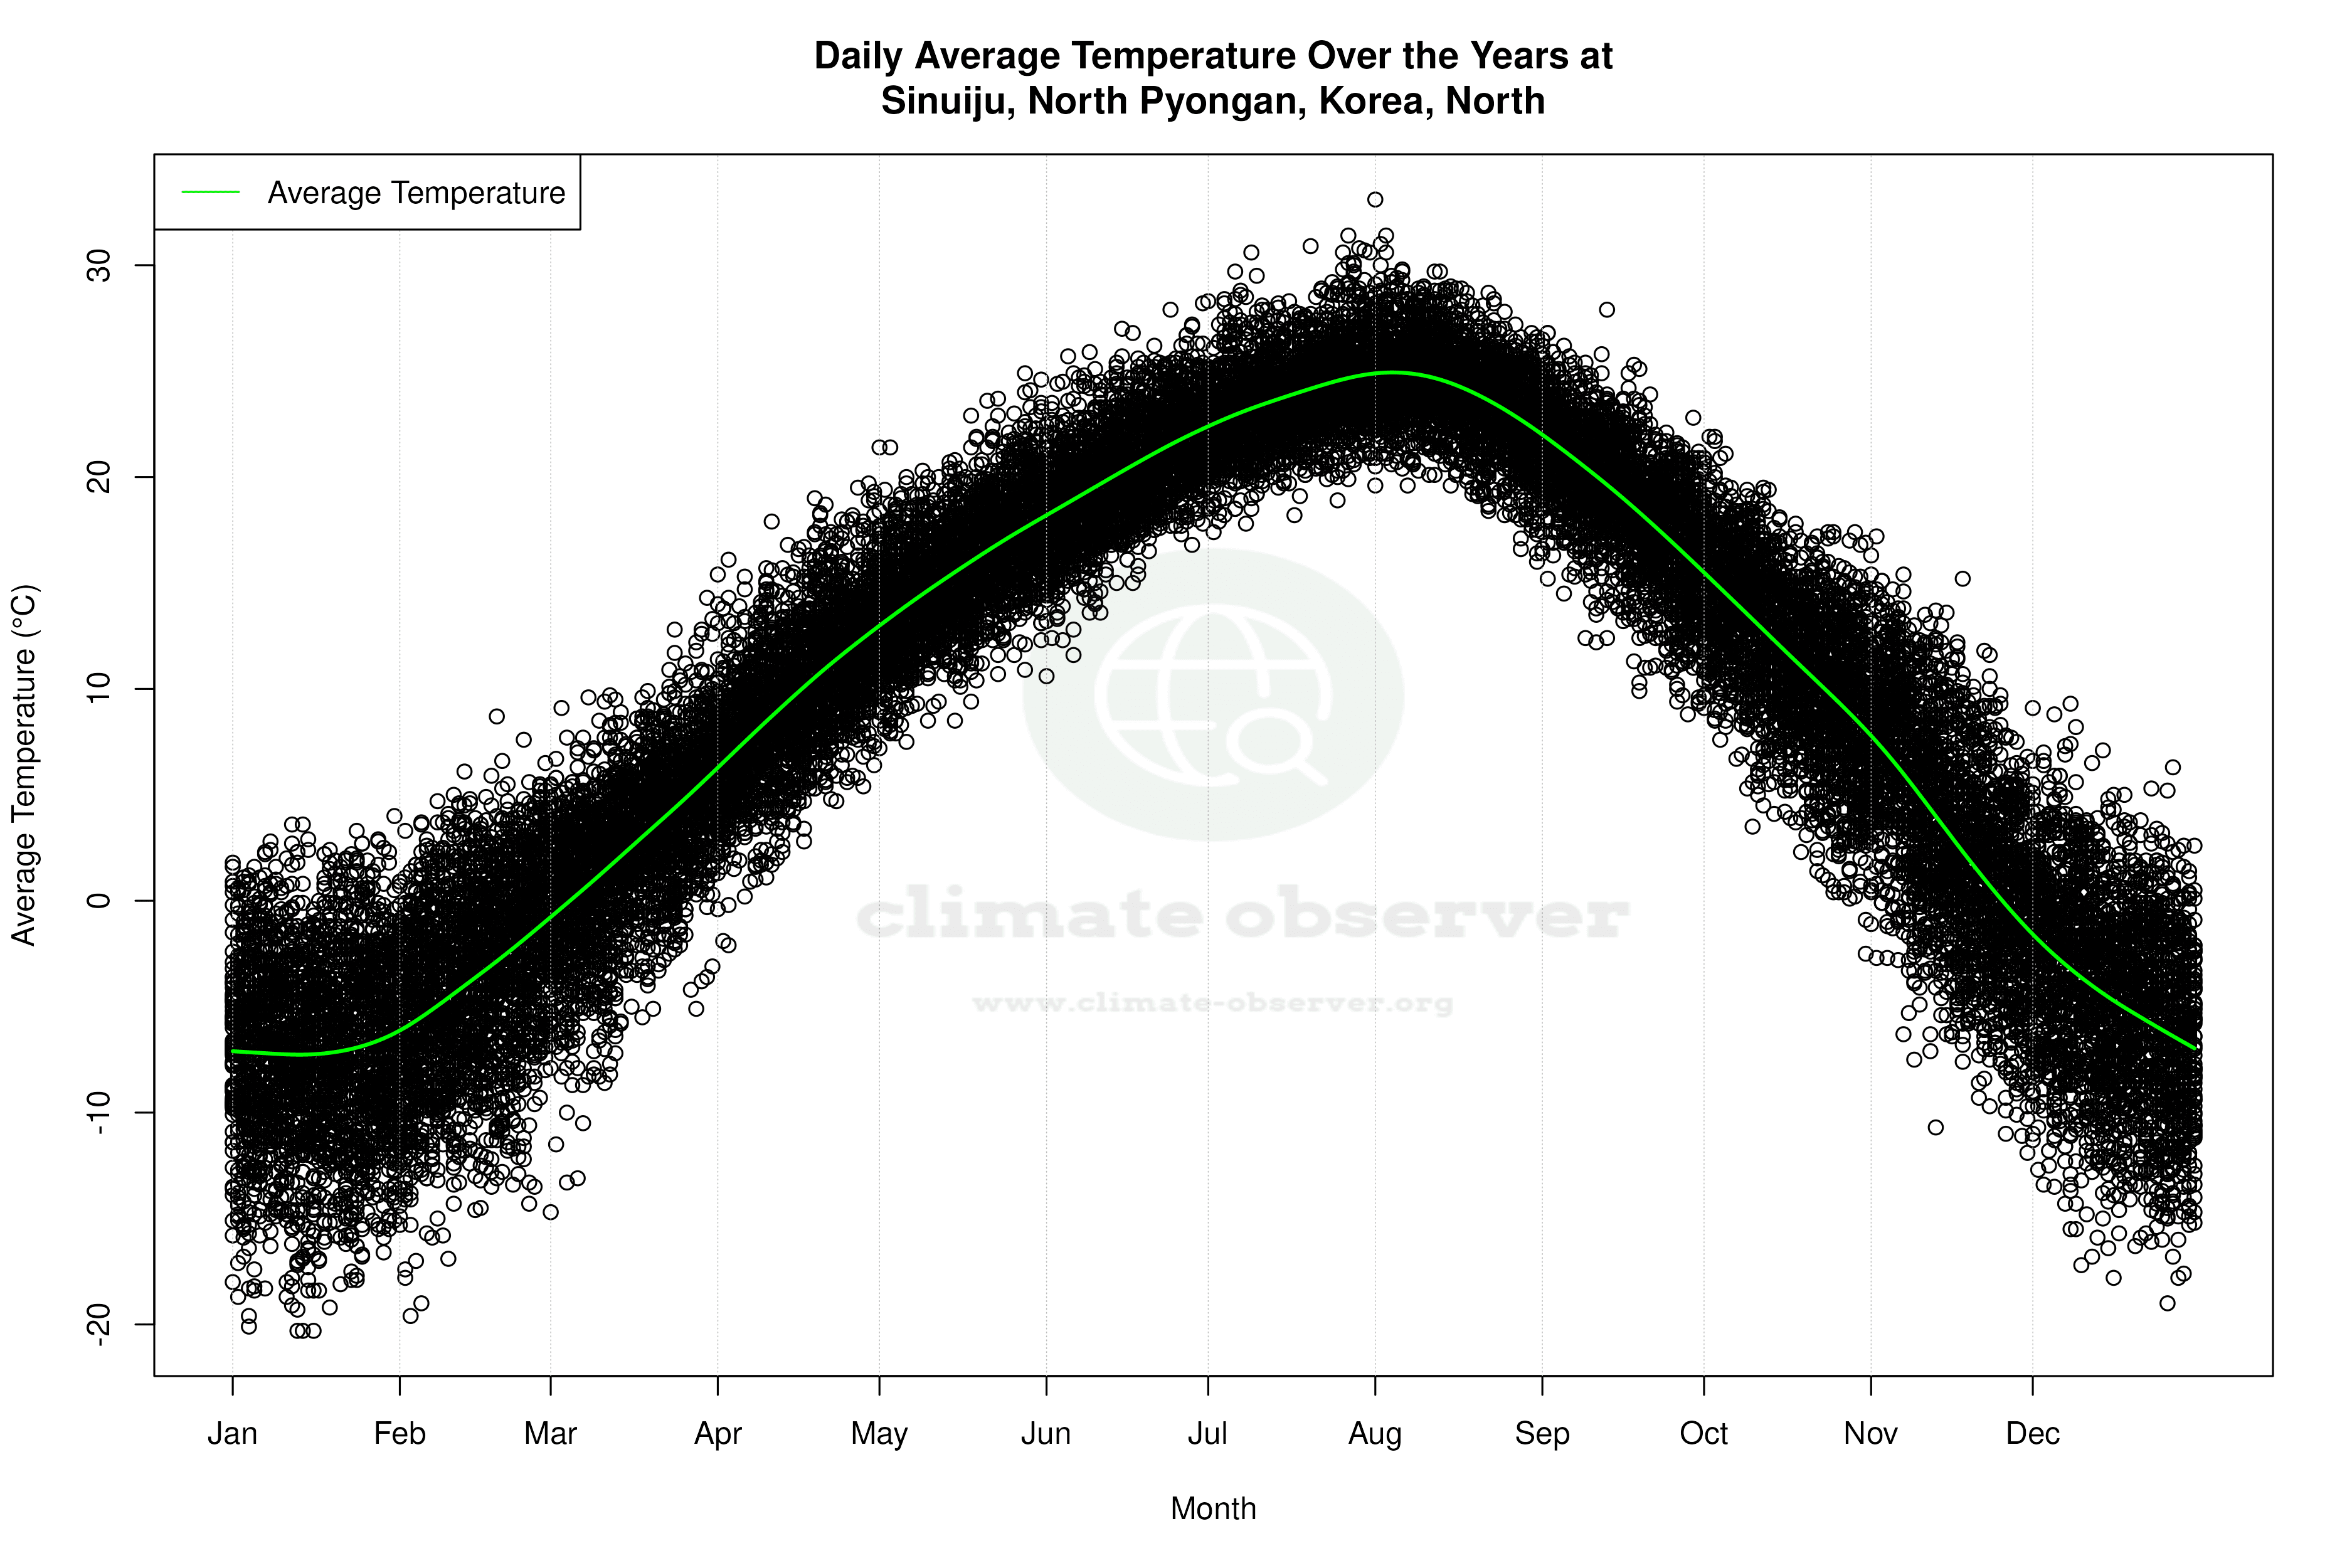


Average Max Temperature Throughout Year | 1 of 5
