Climate for Station: Wonsan, Kangwon Province, Korea, North
Loading live weather...
Climate Analysis & Overview
Wonsan is experiencing a warming trend, with notable increases in minimum temperatures over the past decade. The precipitation pattern has become more evenly distributed, suggesting potential shifts in local climate dynamics. These changes align with North Korea's broader climate adaptation strategies.
Warming Trends in Wonsan
Wonsan, located in the coastal region of Kangwon Province, North Korea, is classified under the Köppen climate classification as a humid continental climate. This classification typically features cold winters and warm, humid summers. Over the past decade, Wonsan has seen a noticeable warming trend, particularly in its minimum temperatures. The 10-year trend shows an increase in lows by 2.90°C (5.22°F), which is significant compared to the all-time trend of 0.71°C (1.28°F). High temperatures have also risen, albeit more modestly, with a 10-year increase of 0.57°C (1.03°F) and an all-time increase of 0.25°C (0.45°F). These trends indicate a warmer climate, potentially impacting local ecosystems and agriculture.
Temperature Extremes and Records
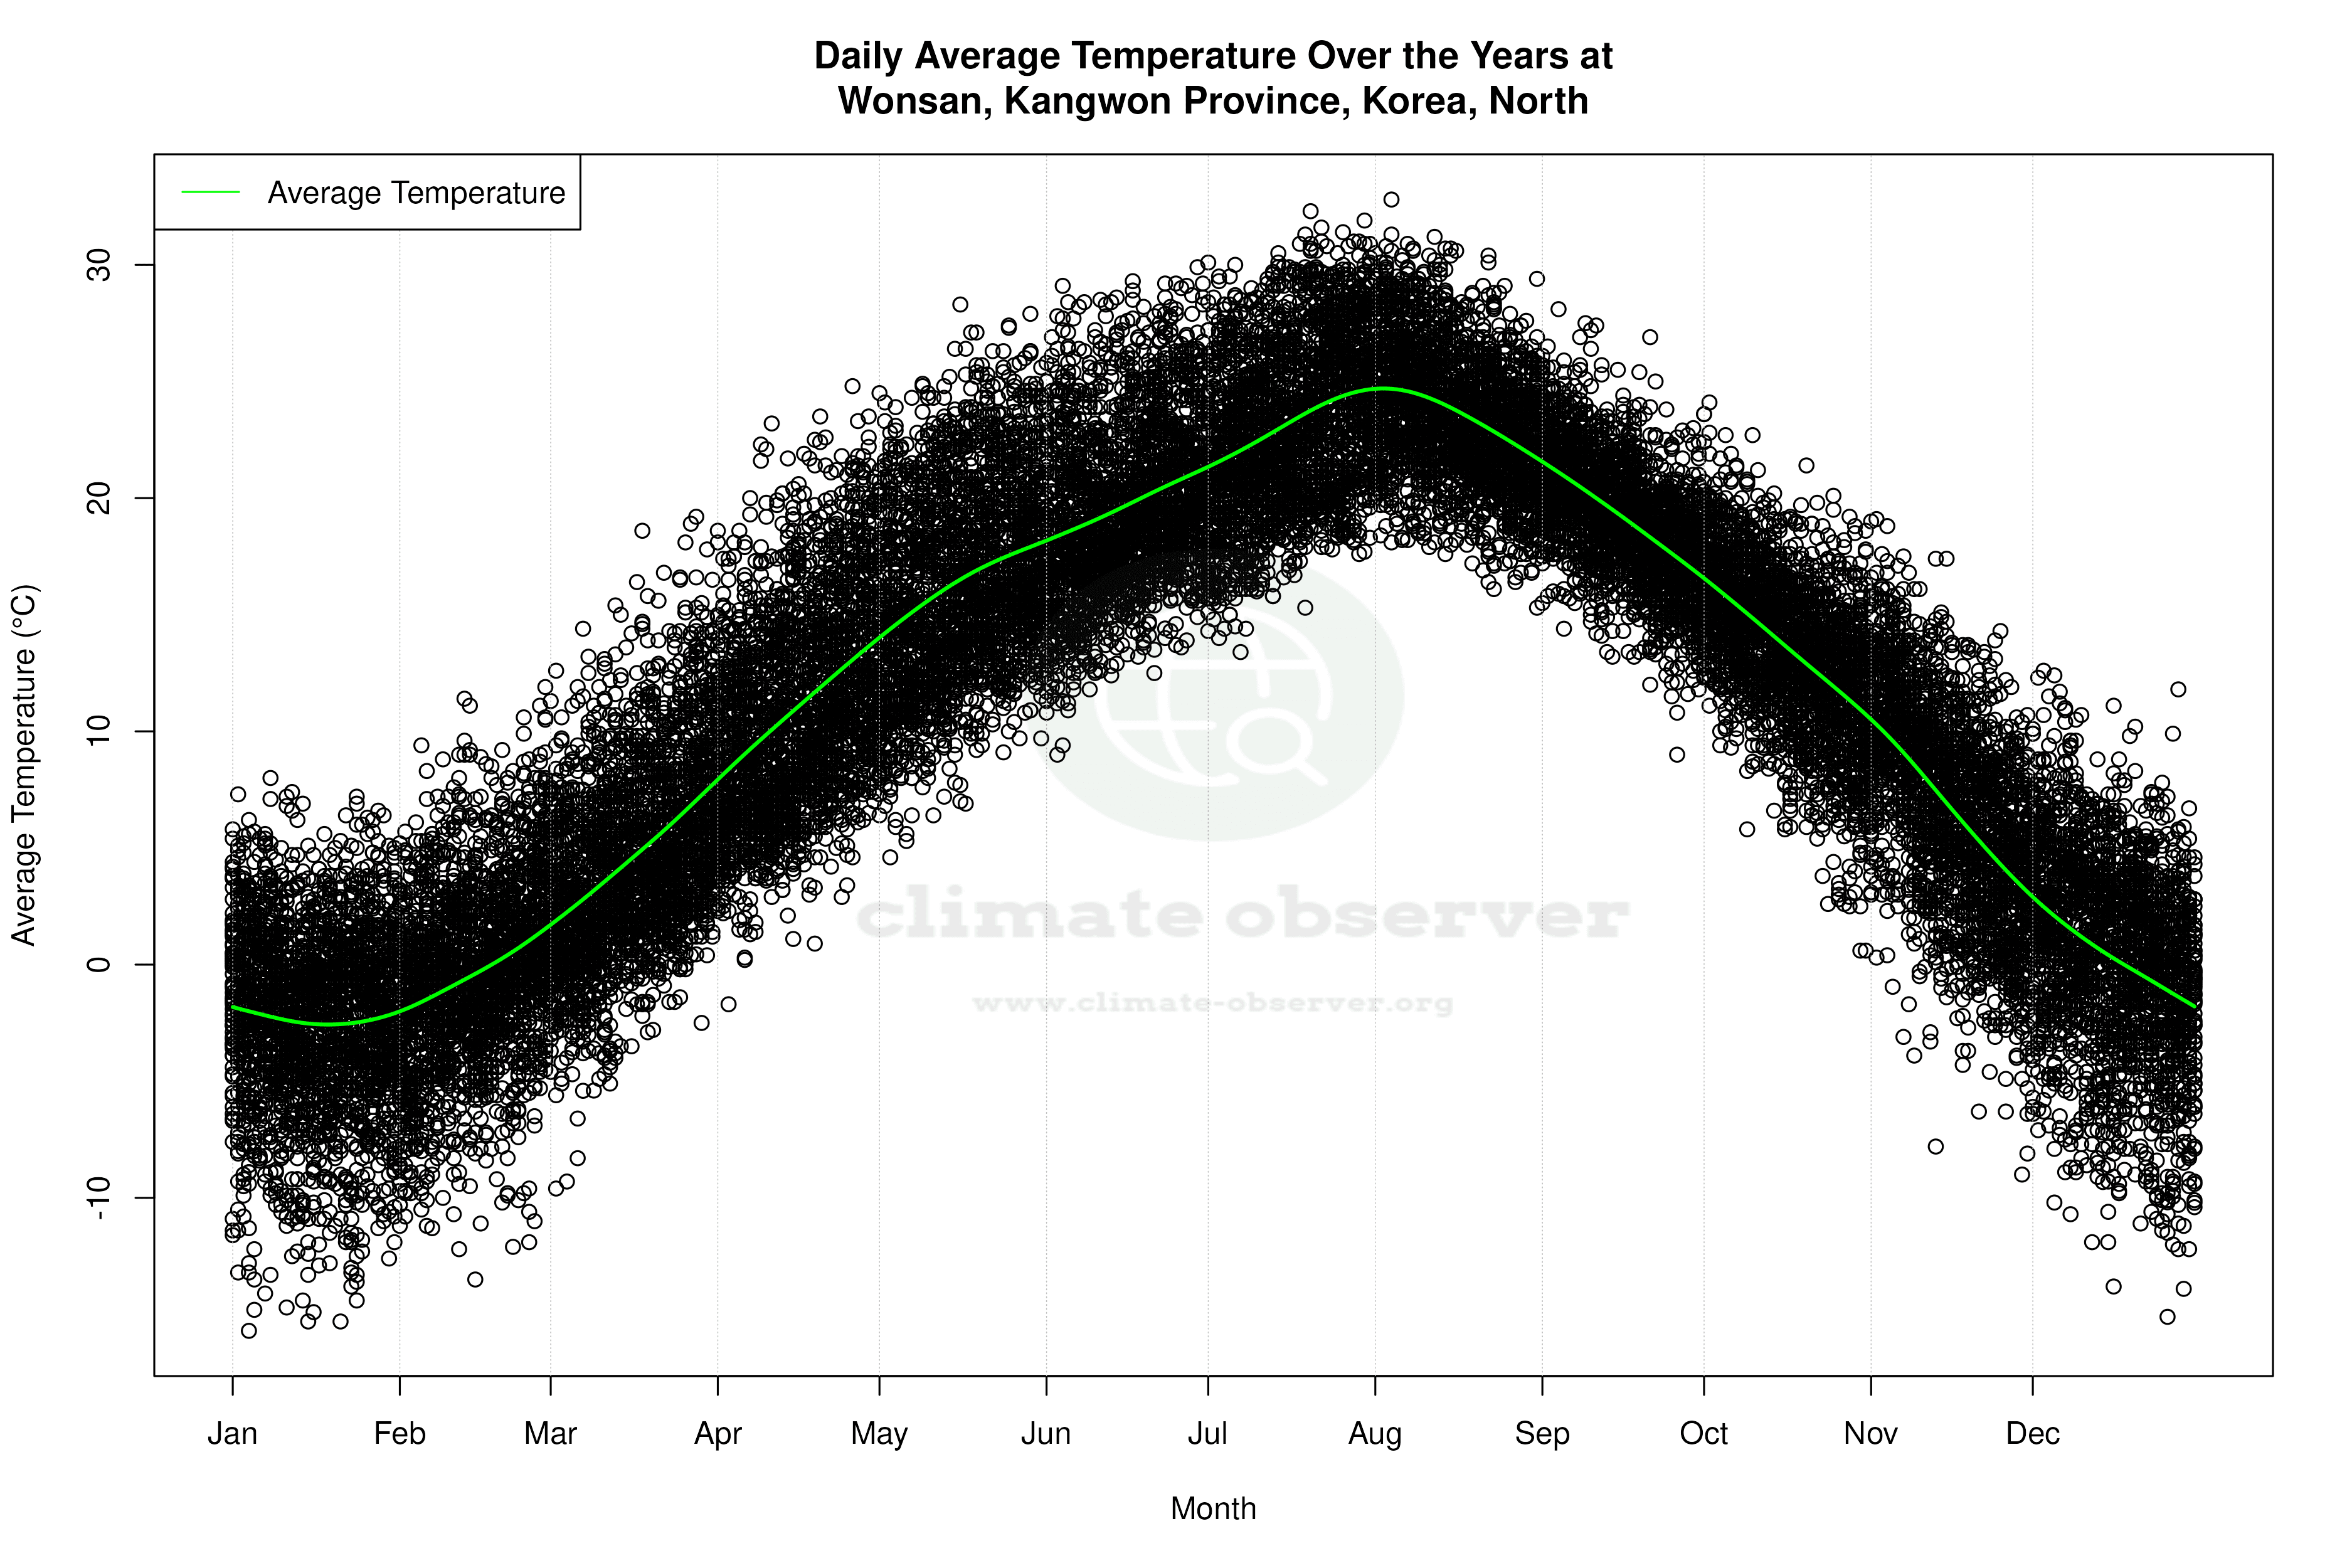
Temperature extremes in Wonsan highlight the variability of its climate. The highest recorded temperature is 39.7°C (103.5°F), while the lowest is -24.0°C (-11.2°F). These records underscore the range of temperatures the region can experience, which is typical for a continental climate influenced by its proximity to the Sea of Japan. This geographical feature can moderate temperatures but also contribute to significant seasonal variations.
Shifts in Precipitation Patterns
The Precipitation Concentration Index (PCI) is a measure of how precipitation is distributed over time. A lower PCI indicates more evenly distributed rainfall, while a higher PCI suggests precipitation is concentrated in fewer, more intense events. Wonsan's PCI has decreased from a baseline of 19.2 to a current value of 14.2, indicating a more even distribution of rainfall. This change could suggest a shift towards more regular precipitation events, which might benefit local agriculture by reducing the risk of drought and flood extremes.
Regional Climate Implications
These climatic shifts in Wonsan are part of broader regional patterns observed in North Korea. The country has been focusing on climate adaptation strategies to mitigate the effects of global warming. The warming trends and changes in precipitation distribution in Wonsan could have implications for regional water management and agricultural planning. As North Korea continues to adapt to these changes, understanding localised climate dynamics becomes increasingly crucial for sustainable development.
Geographical and Environmental Context
Wonsan's geographical location, nestled between mountains and the Sea of Japan, plays a significant role in its climate. The mountains can act as a barrier, influencing wind patterns and precipitation, while the sea provides a moderating effect on temperature extremes. This unique setting contributes to the observed climate trends and underscores the importance of considering local geography in climate analysis.
Station Statistics
10-Year Trend
High: +2.06 °F/decade
Low: +6.38 °F/decade
Rain: -0.047 in/decade
25-Year Trend
High: +0.98 °F/decade
Low: +2.58 °F/decade
Rain: +0.005 in/decade
50-Year Trend
High: +0.55 °F/decade
Low: +1.21 °F/decade
Rain: +0.006 in/decade
All-Time Trend
High: +0.45 °F/decade
Low: +1.21 °F/decade
Rain: +0.006 in/decade
Percentage Above-Average Days
Last 12 Months: 50.4%
This Year: 50.7%
Precipitation Concentration Index (PCI) ℹ️
Last 12 Months: 16.2
Historical Average: 18.6
Percentile Rank of Last 12 Months ℹ️
High: 91st percentile
Low: 99th percentile
Rain: 33rd percentile
Change in Variance ℹ️
High: +2.4%
Low: -2.9%
Intraday: -22.0%
Data Coverage
89.0%
First Year of Data
1957
Station Location
Historical Weather Records
| Max High | Avg High | Min High | Max Avg | Avg Avg | Min Avg | Max Low | Avg Low | Min Low | Max Precipitation | Avg Precipitation | Max Snow | Avg Snow | |
|---|---|---|---|---|---|---|---|---|---|---|---|---|---|
| Record | 103.46 °F | — | 6.39 °F | 91.04 °F | — | 3.74 °F | 82.22 °F | — | -11.20 °F | 10.83 in | — | — | — |
| January | 58.82 °F | 35.03 °F | 6.39 °F | 46.40 °F | 27.82 °F | 3.74 °F | 39.74 °F | 18.56 °F | -7.28 °F | 1.94 in | 0.03 in | — | — |
| February | 66.38 °F | 38.64 °F | 15.80 °F | 53.42 °F | 31.40 °F | 7.70 °F | 48.74 °F | 22.48 °F | -11.20 °F | 2.13 in | 0.04 in | — | — |
| March | 78.08 °F | 47.84 °F | 23.00 °F | 66.56 °F | 40.24 °F | 14.72 °F | 56.84 °F | 31.29 °F | 2.66 °F | 2.64 in | 0.05 in | — | — |
| April | 89.60 °F | 60.45 °F | 35.96 °F | 76.64 °F | 51.72 °F | 28.94 °F | 62.78 °F | 41.67 °F | 19.40 °F | 4.25 in | 0.08 in | — | — |
| May | 95.18 °F | 70.80 °F | 46.04 °F | 82.94 °F | 61.45 °F | 40.28 °F | 74.48 °F | 51.48 °F | 32.00 °F | 3.43 in | 0.12 in | — | — |
| June | 98.78 °F | 74.90 °F | 50.00 °F | 85.82 °F | 67.43 °F | 48.20 °F | 80.42 °F | 60.18 °F | 42.80 °F | 7.20 in | 0.18 in | — | — |
| July | 103.46 °F | 79.76 °F | 59.00 °F | 90.14 °F | 73.63 °F | 56.12 °F | 82.22 °F | 67.71 °F | 50.00 °F | 10.83 in | 0.41 in | — | — |
| August | 100.76 °F | 80.56 °F | 63.03 °F | 91.04 °F | 74.45 °F | 59.54 °F | 81.50 °F | 68.62 °F | 53.60 °F | 9.85 in | 0.41 in | — | — |
| September | 92.84 °F | 73.59 °F | 56.12 °F | 82.58 °F | 66.55 °F | 48.20 °F | 75.56 °F | 59.06 °F | 40.64 °F | 9.21 in | 0.23 in | — | — |
| October | 92.12 °F | 64.73 °F | 39.00 °F | 75.38 °F | 56.55 °F | 33.08 °F | 67.64 °F | 47.30 °F | 26.29 °F | 5.00 in | 0.09 in | — | — |
| November | 79.88 °F | 51.85 °F | 21.74 °F | 66.38 °F | 44.35 °F | 15.80 °F | 60.80 °F | 35.47 °F | 10.04 °F | 4.92 in | 0.09 in | — | — |
| December | 62.96 °F | 39.79 °F | 12.02 °F | 54.68 °F | 32.67 °F | 4.82 °F | 47.48 °F | 23.77 °F | -1.41 °F | 2.76 in | 0.04 in | — | — |
Data Visualisations
Remove WatermarksCurrent Year Climate Trends vs Historical
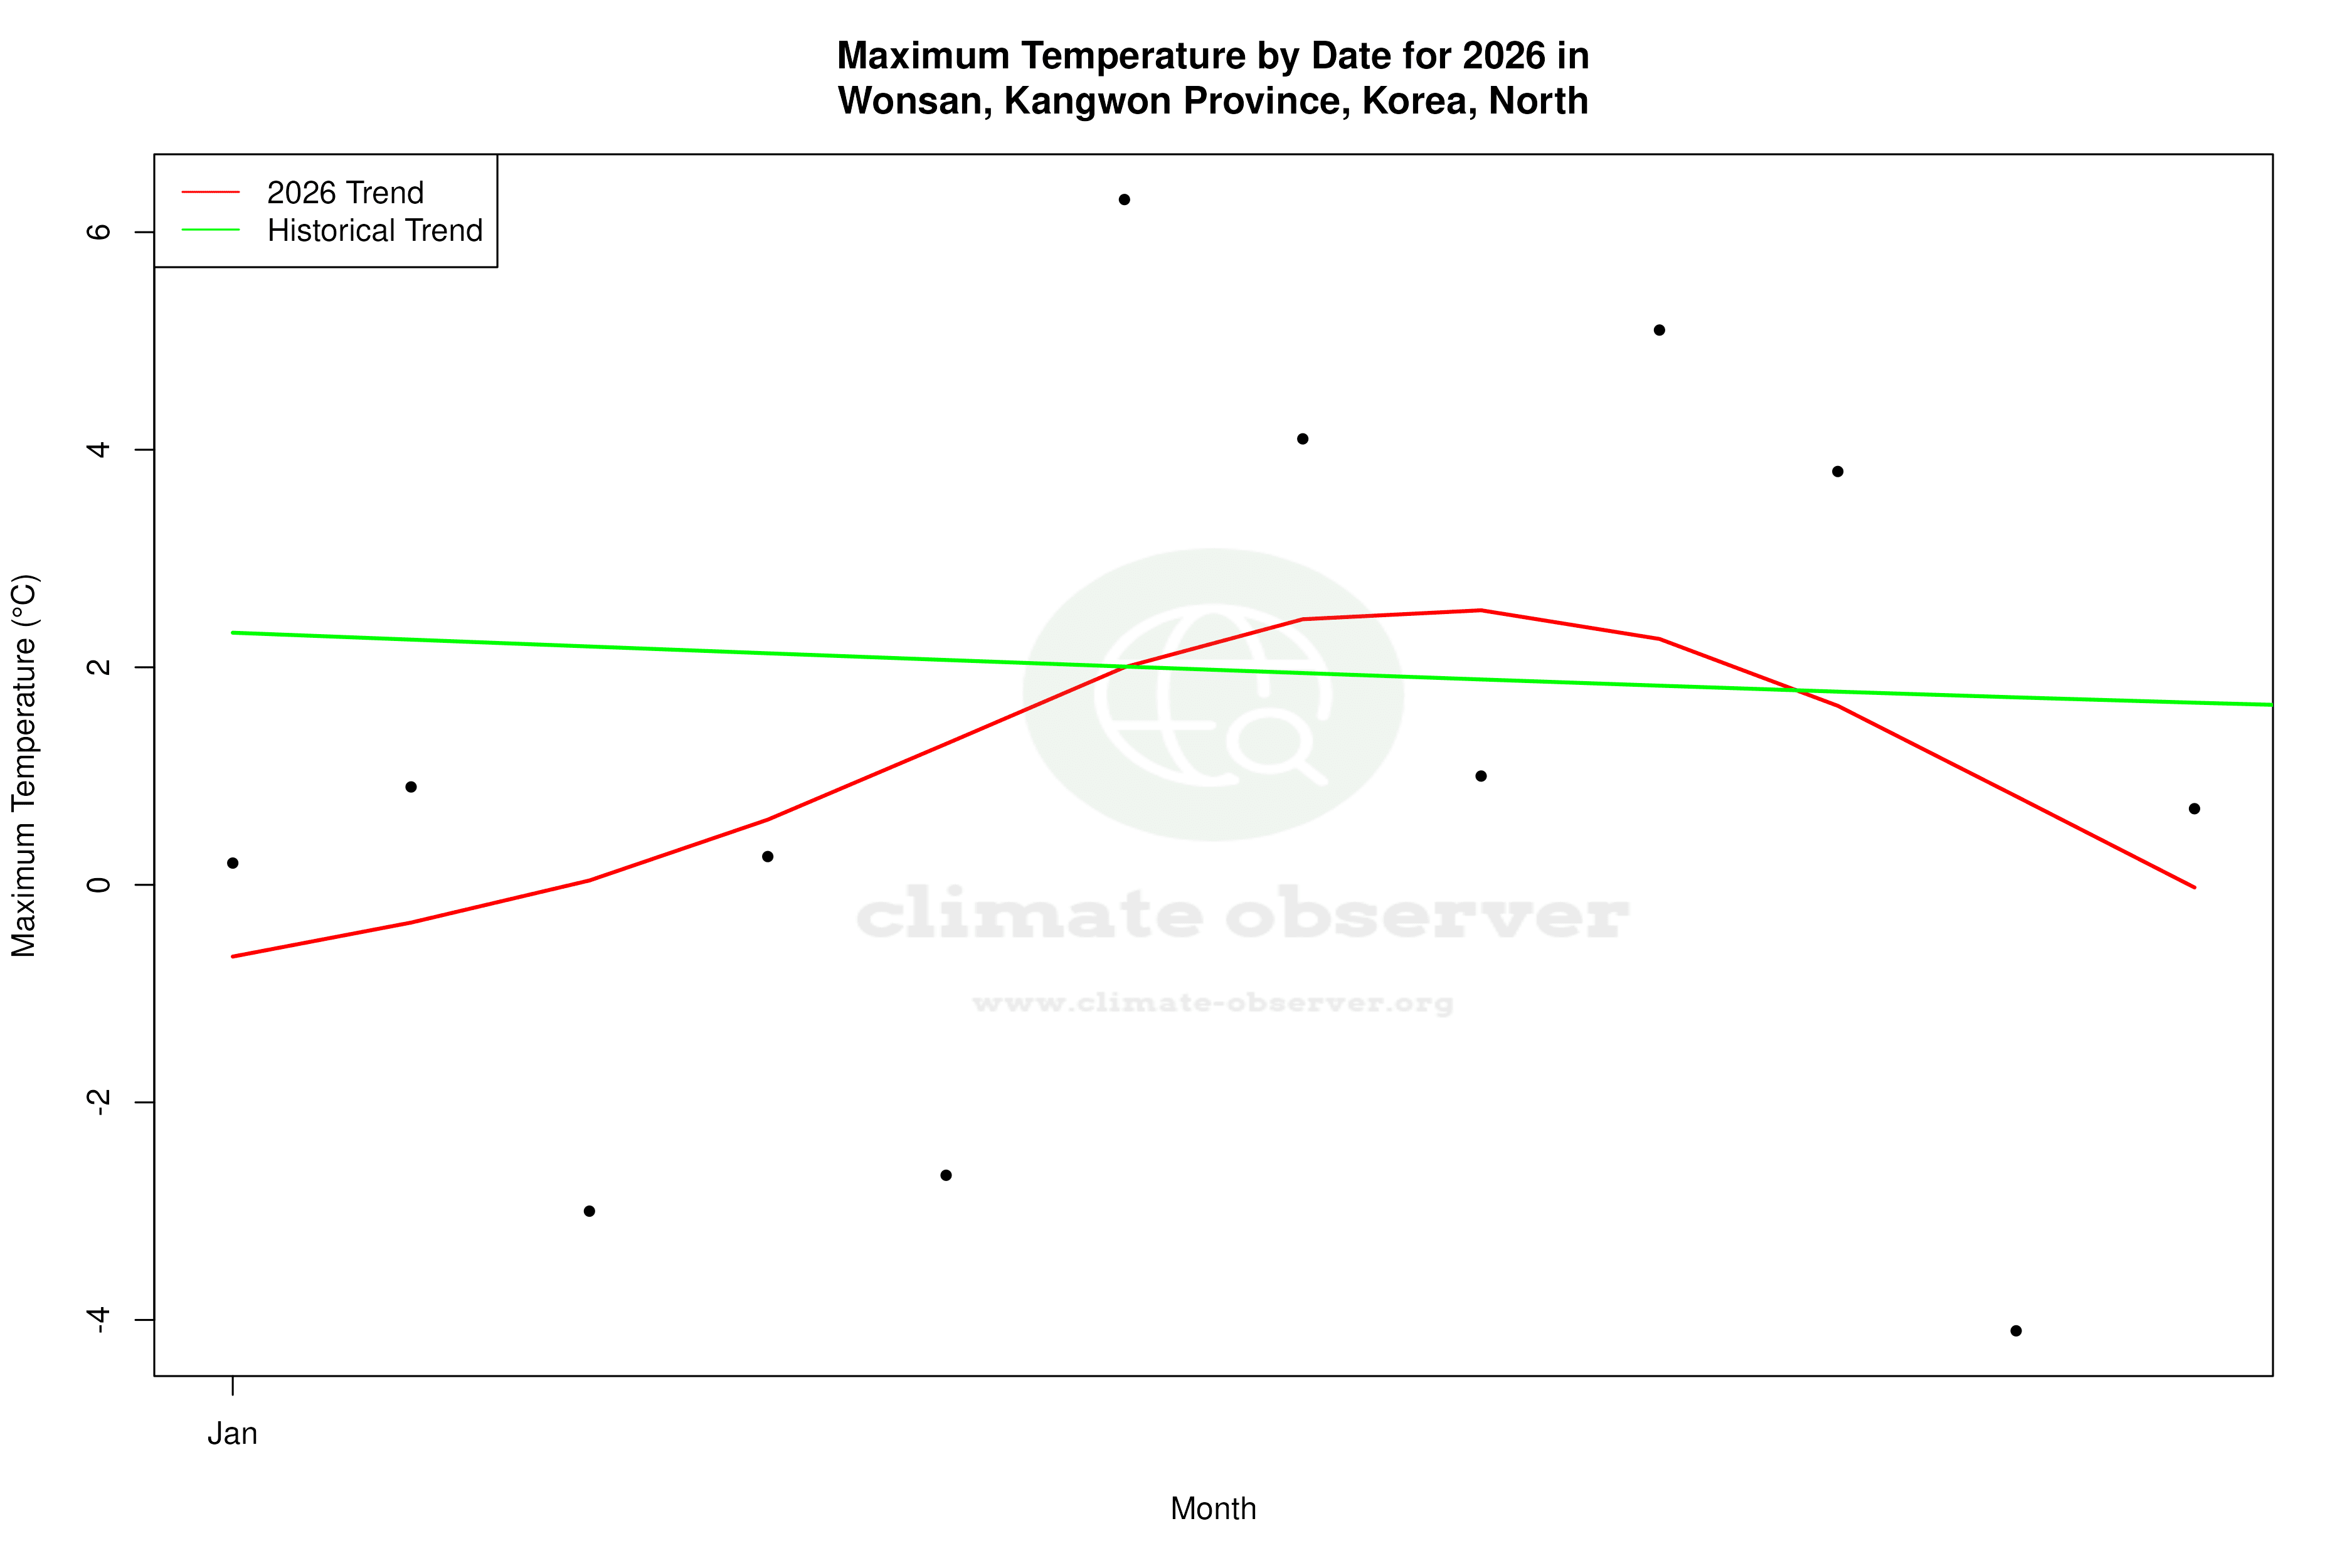
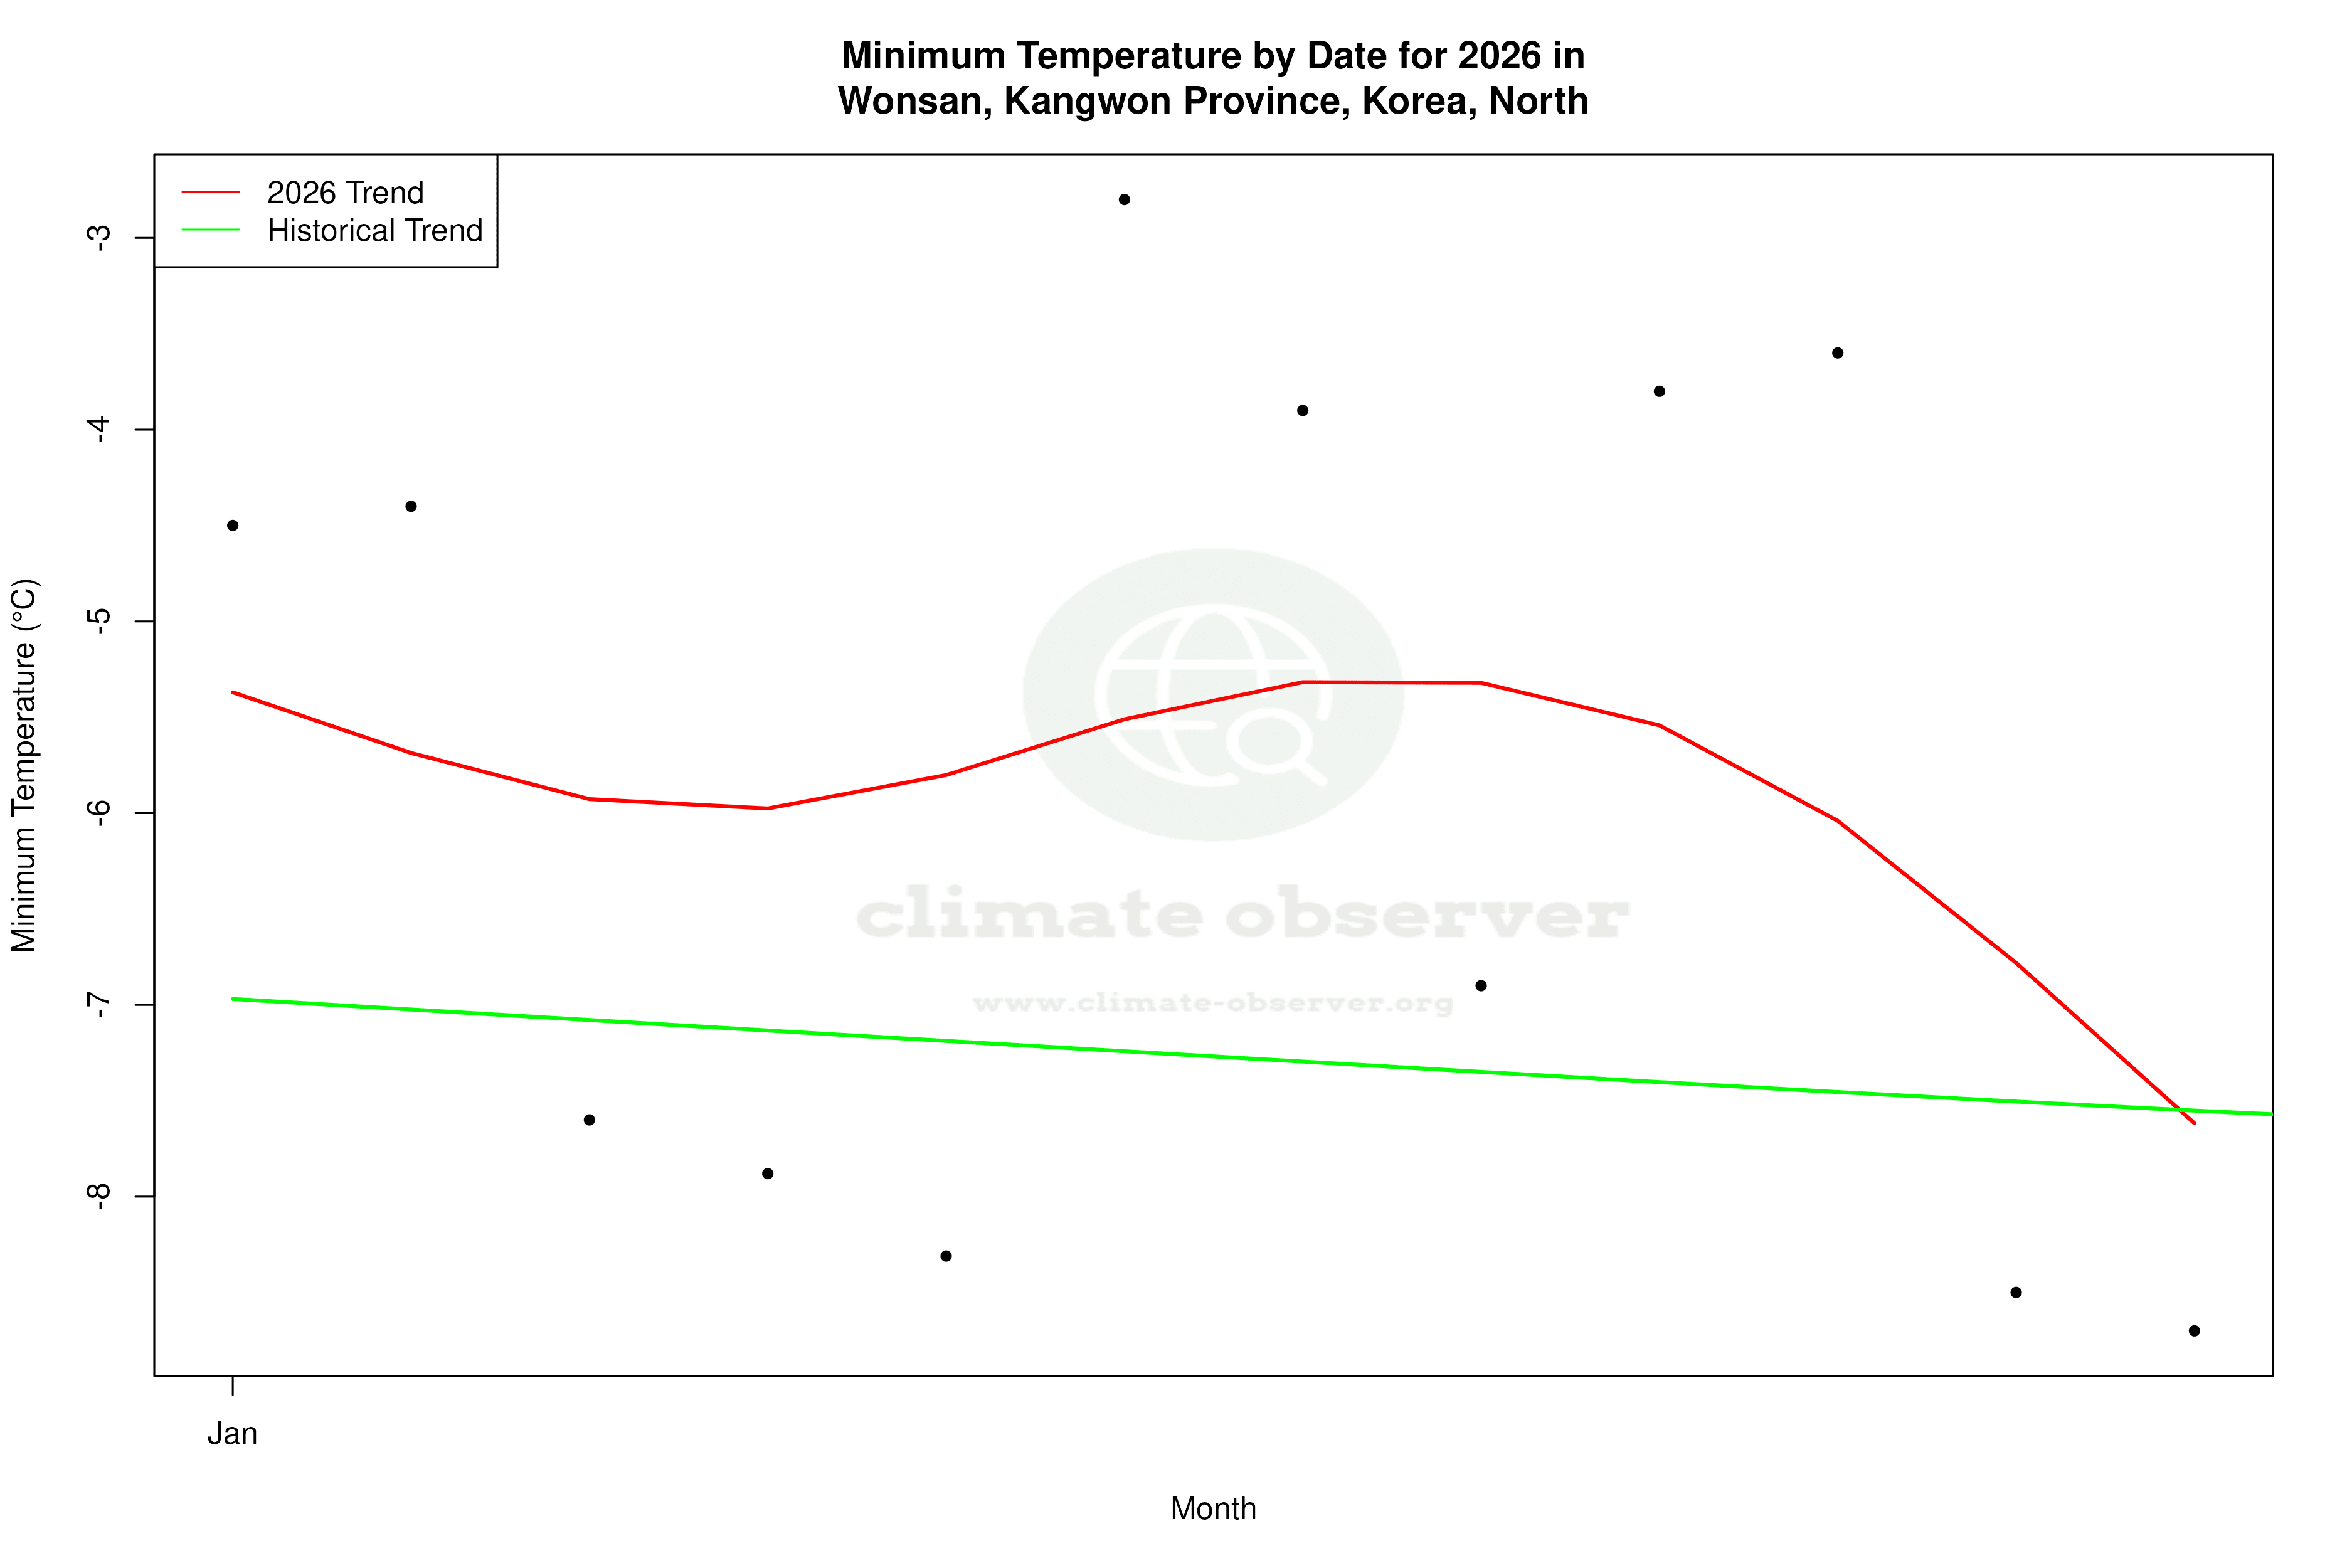
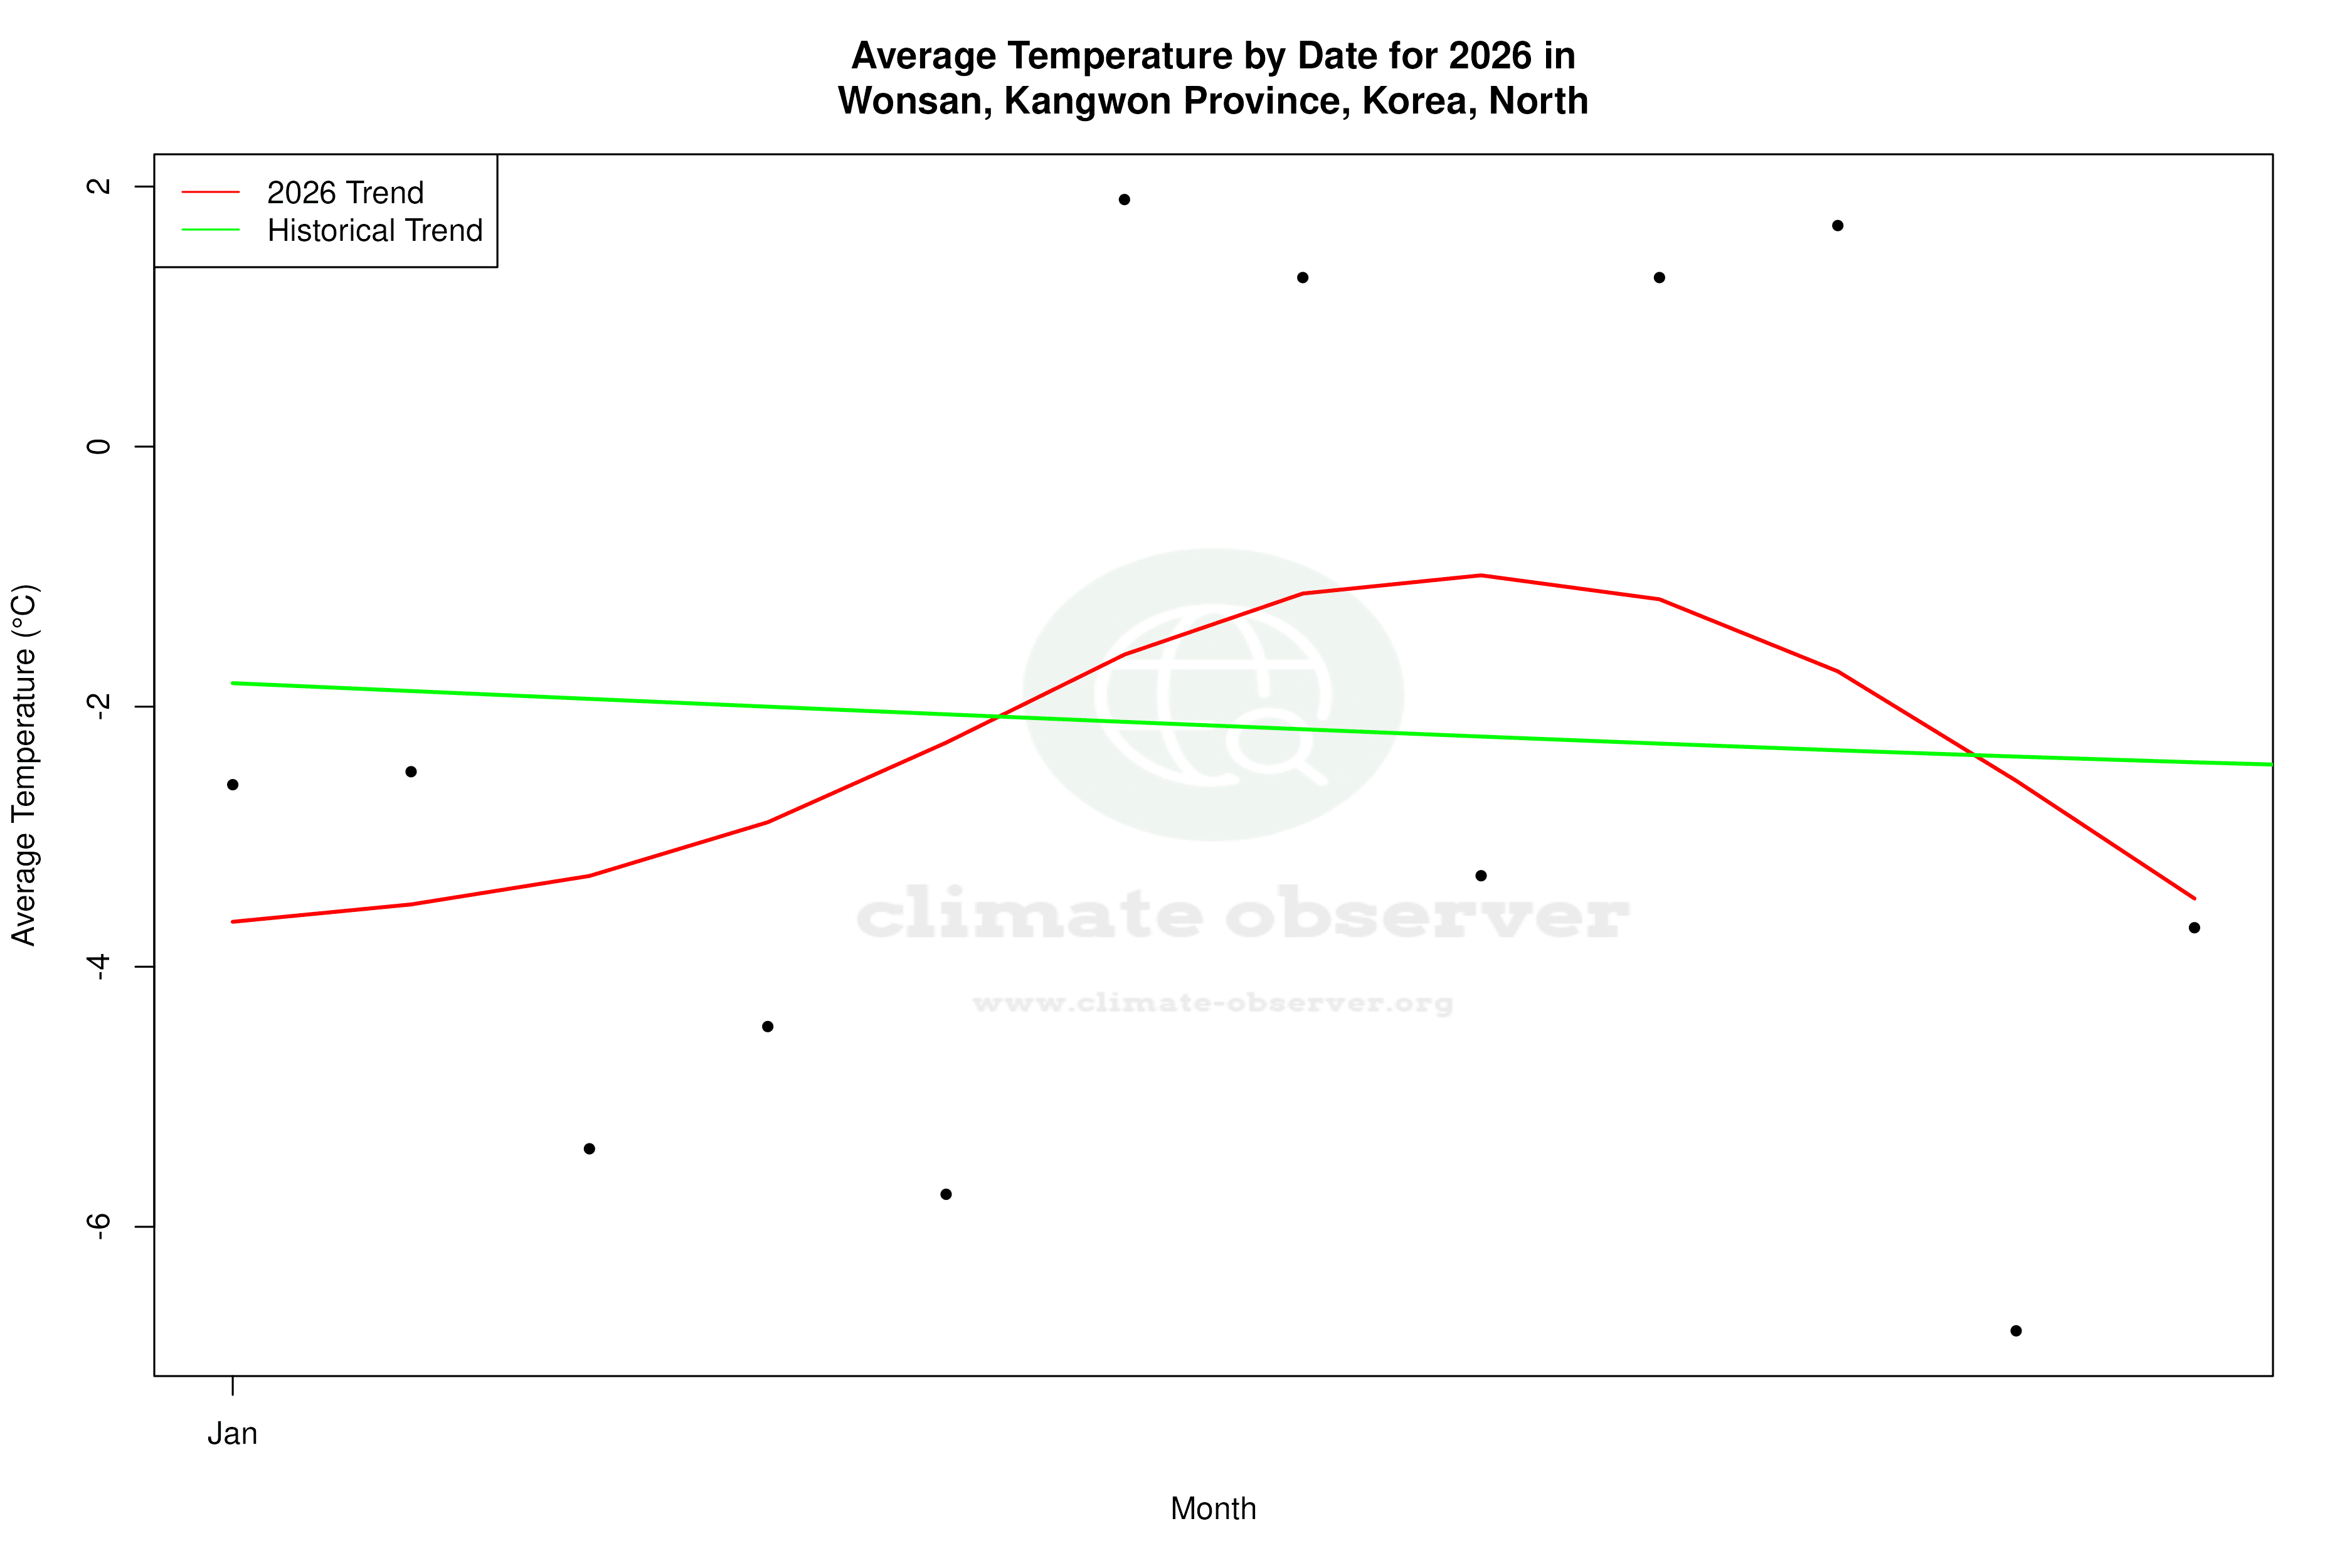


Max Temperature this Year | 1 of 6
Climate 12-Month Moving Averages
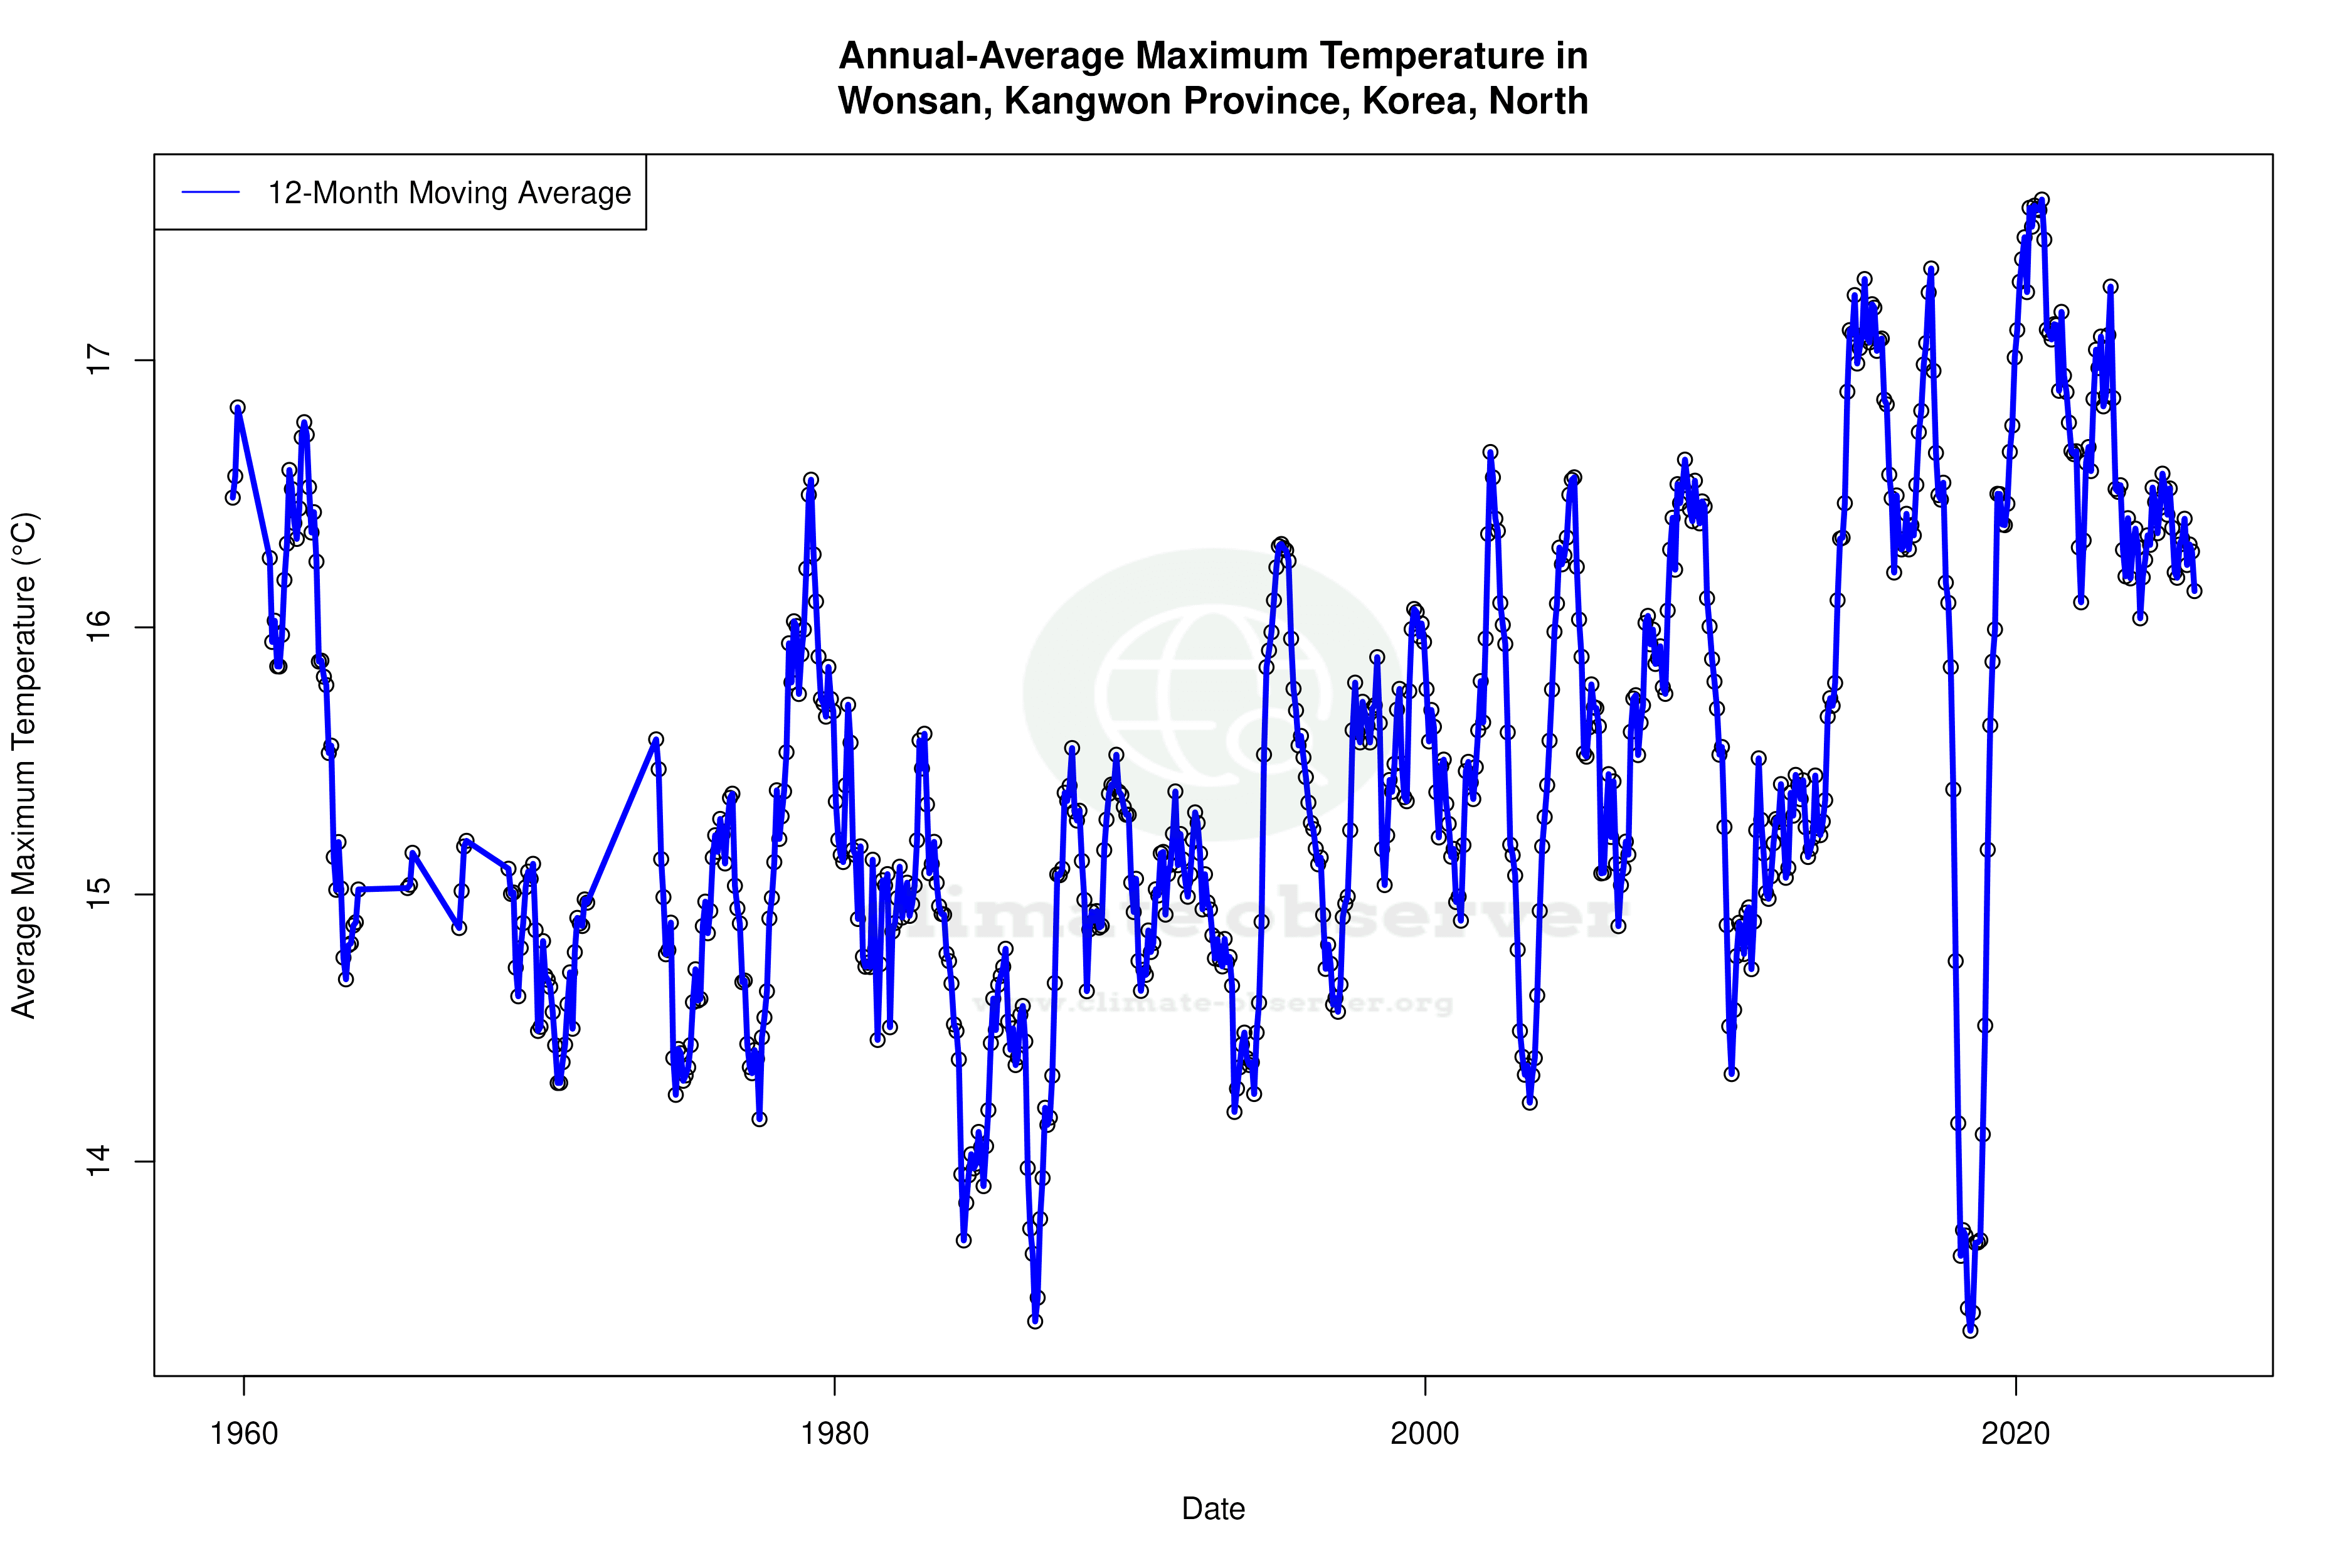
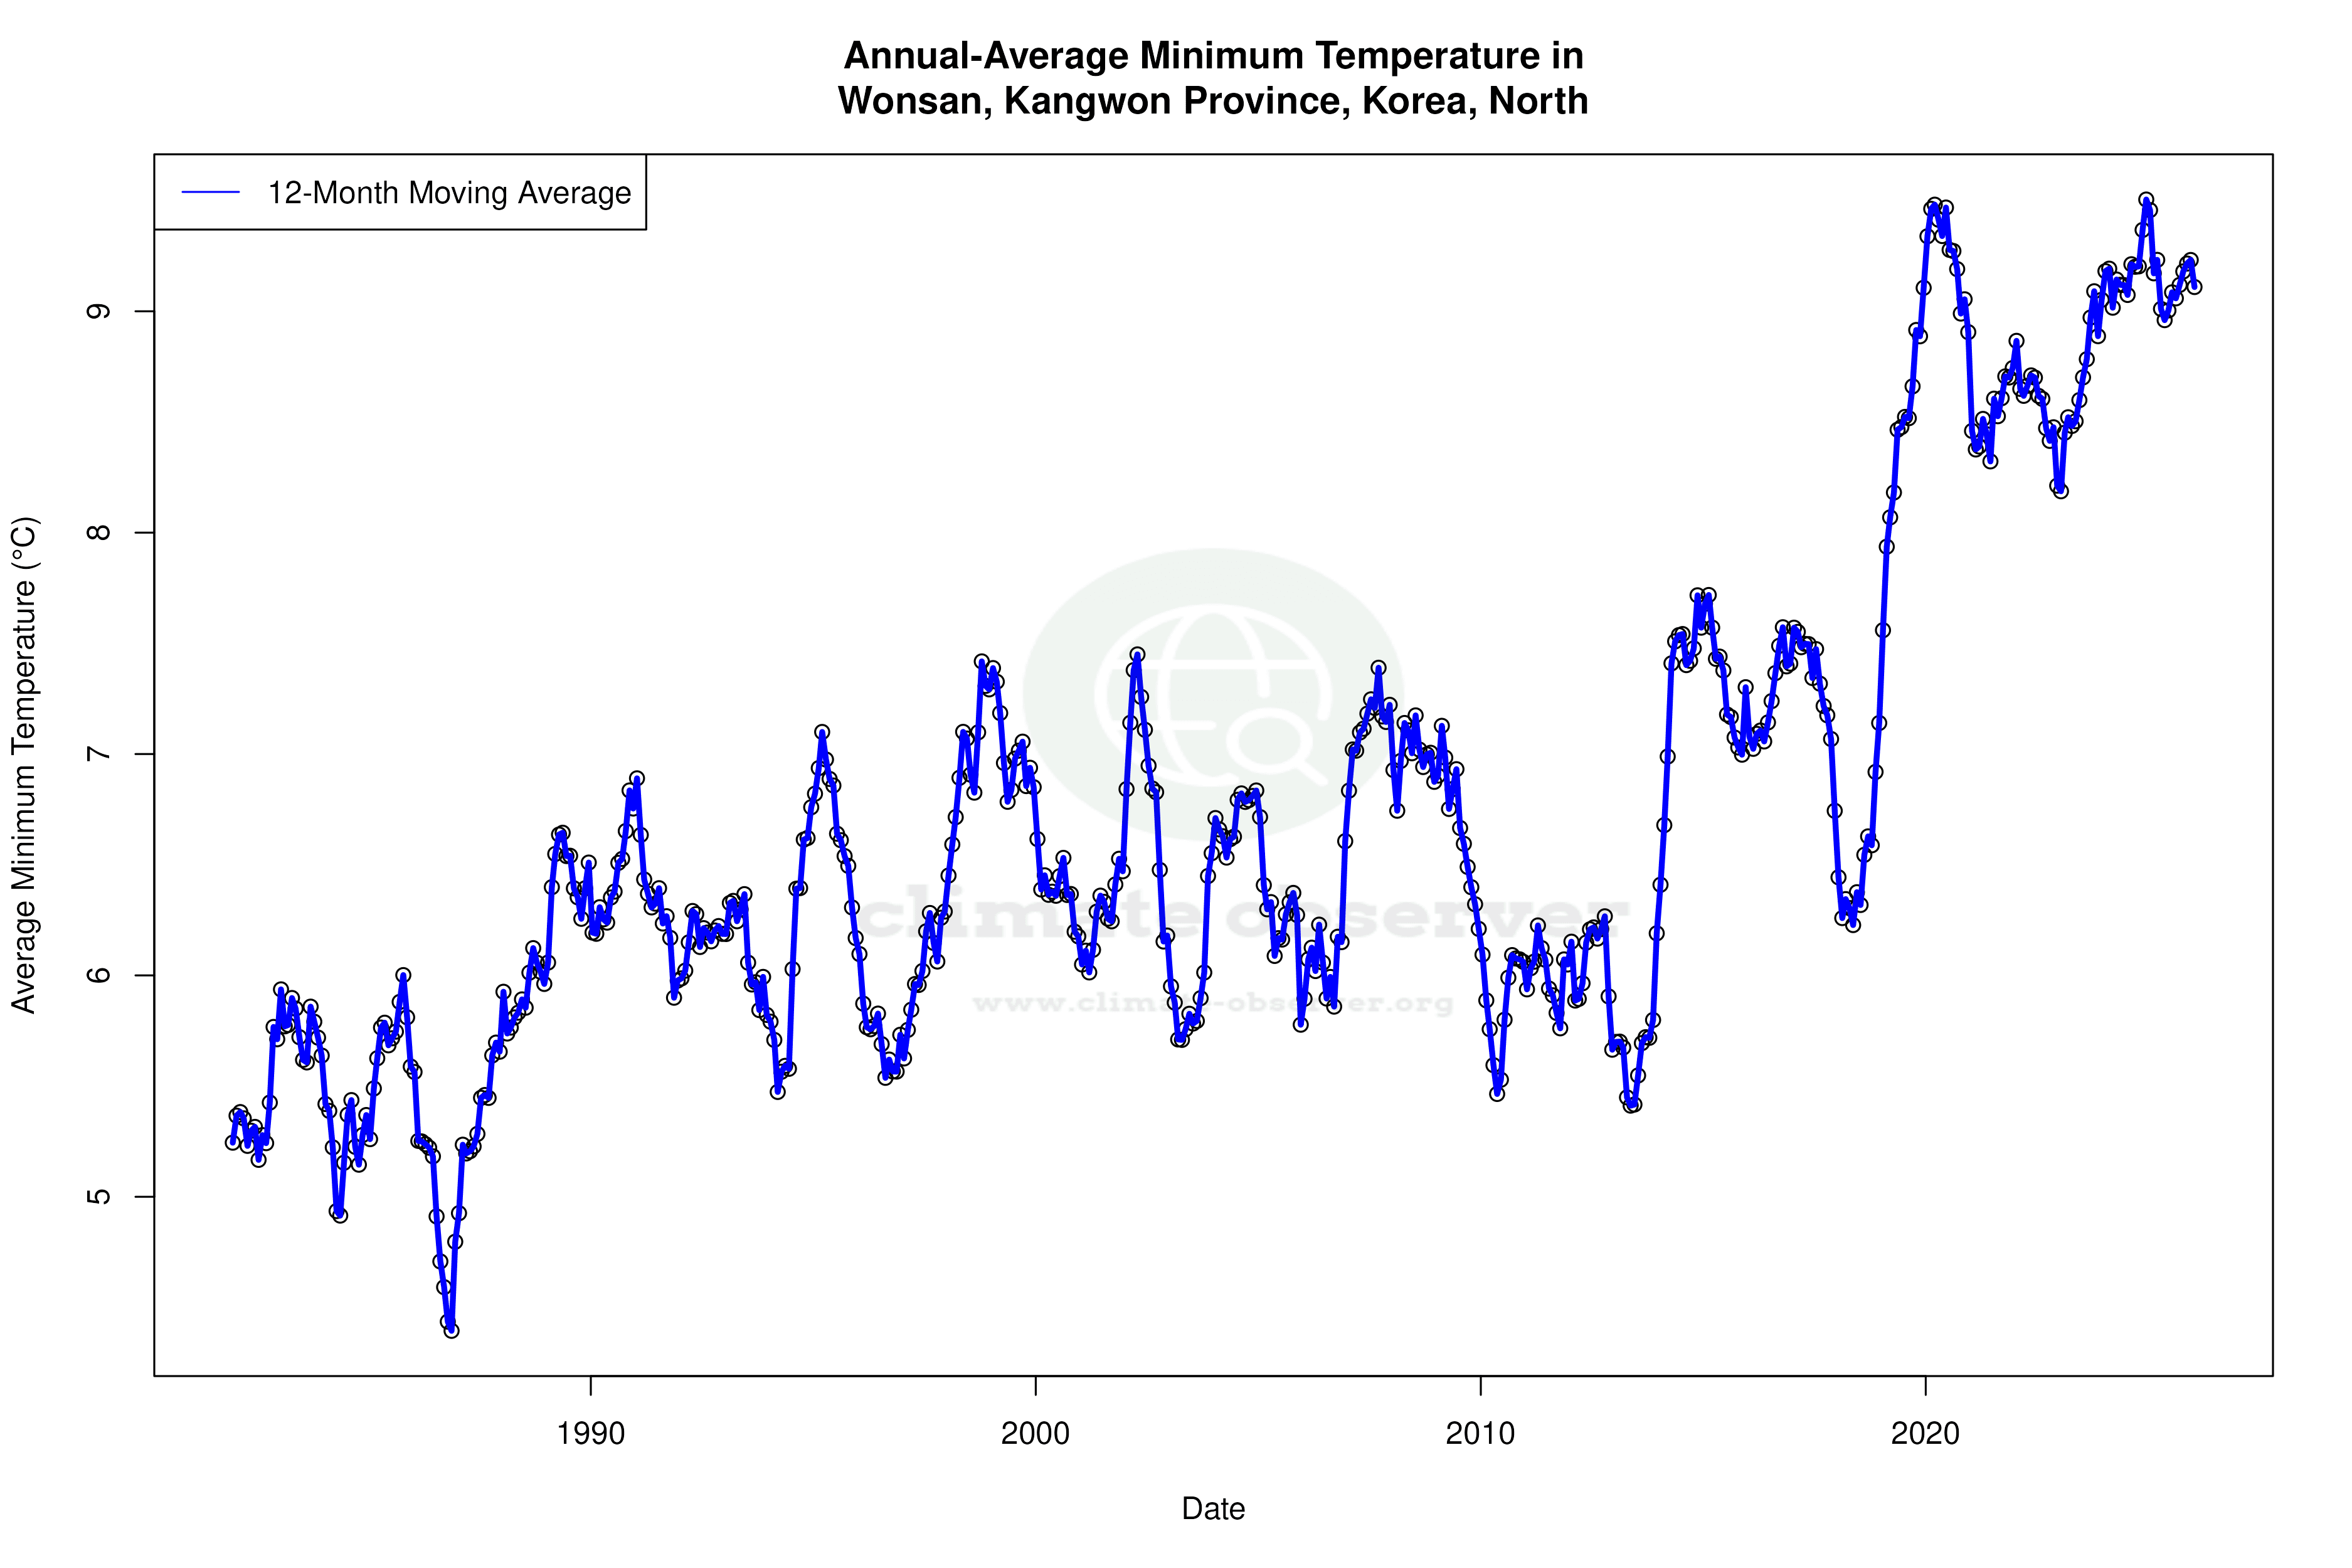


Max Temperature 12-Month MA | 1 of 6
Daily Data Points and Averages Throughout the Year
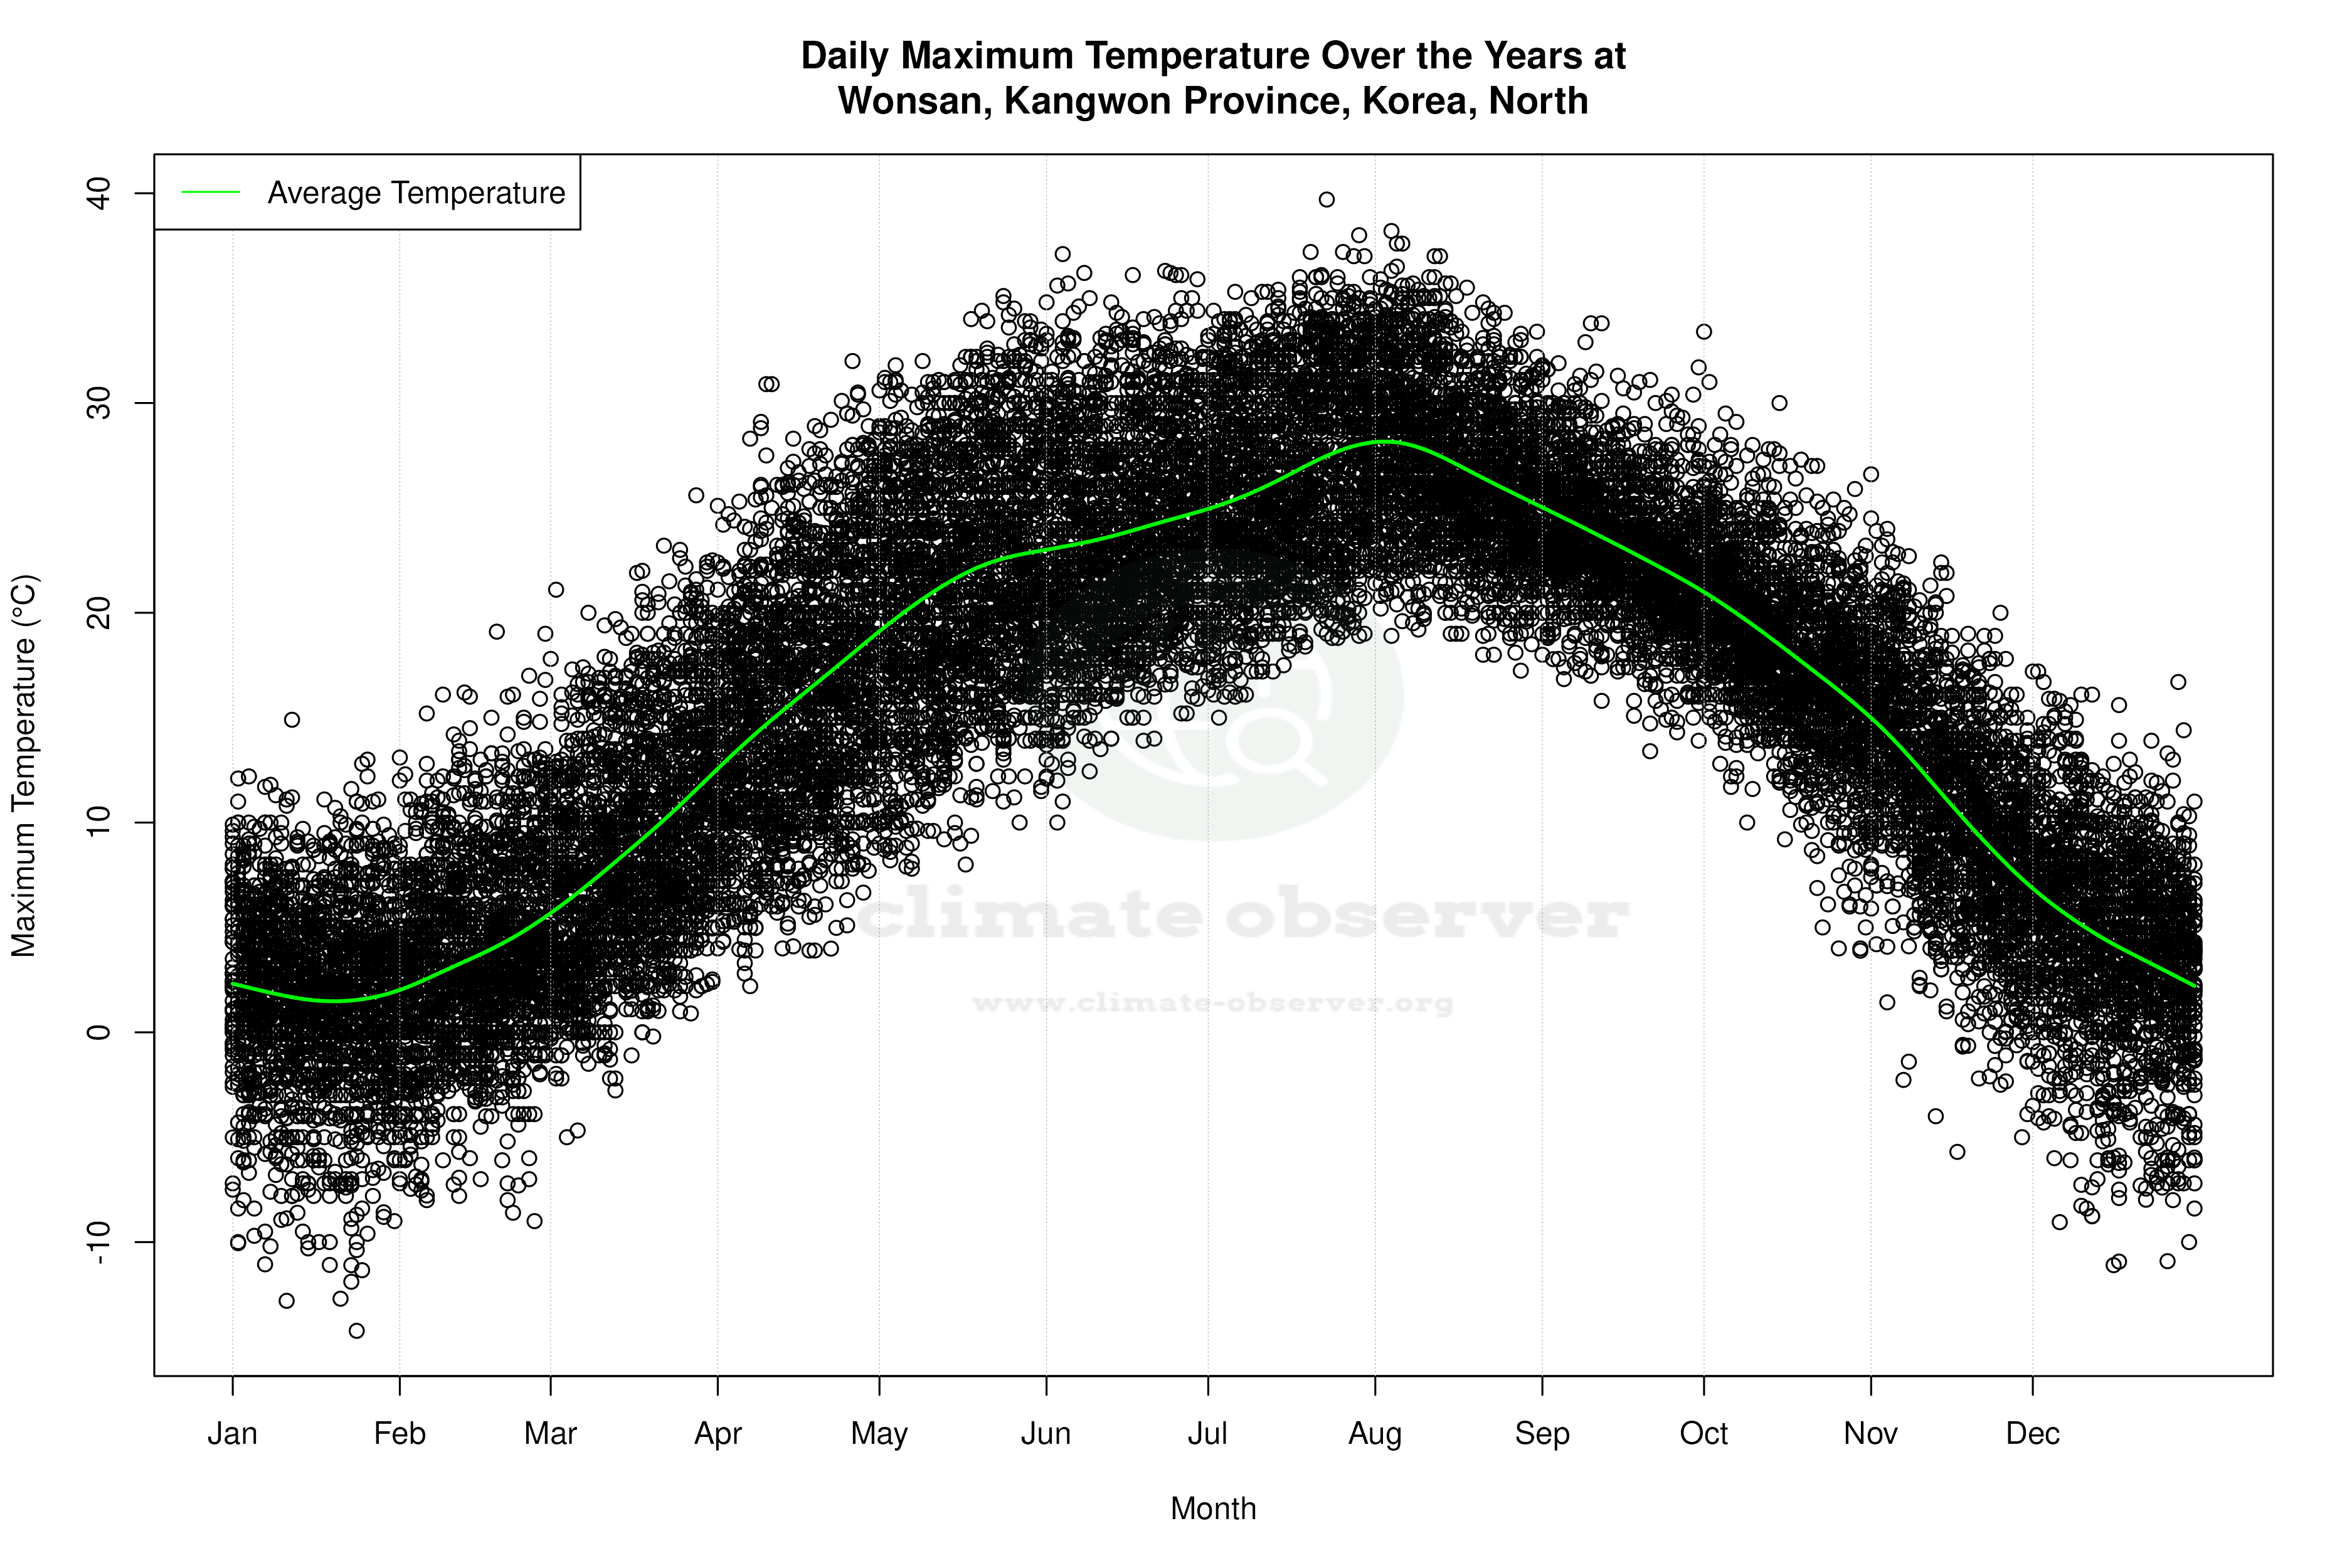


Average Max Temperature Throughout Year | 1 of 5
