Climate for Station: Haeju, South Hwanghae, Korea, North
Loading live weather...
Climate Analysis & Overview
Haeju, situated in North Korea's coastal region, is experiencing a nuanced climate shift with a warming trend in low temperatures and a slight cooling in high temperatures over the past decade. The precipitation pattern has become more evenly distributed, suggesting a shift towards more regular rainfall events.
Coastal Climate Dynamics
Haeju is positioned at a latitude of 38.033 and a longitude of 125.7, placing it within the humid continental climate zone according to the Köppen classification. This region is influenced by its proximity to the Yellow Sea, which moderates temperatures and contributes to its distinct seasonal variations. The city experiences cold, dry winters and warm, humid summers, characteristic of this climate type.
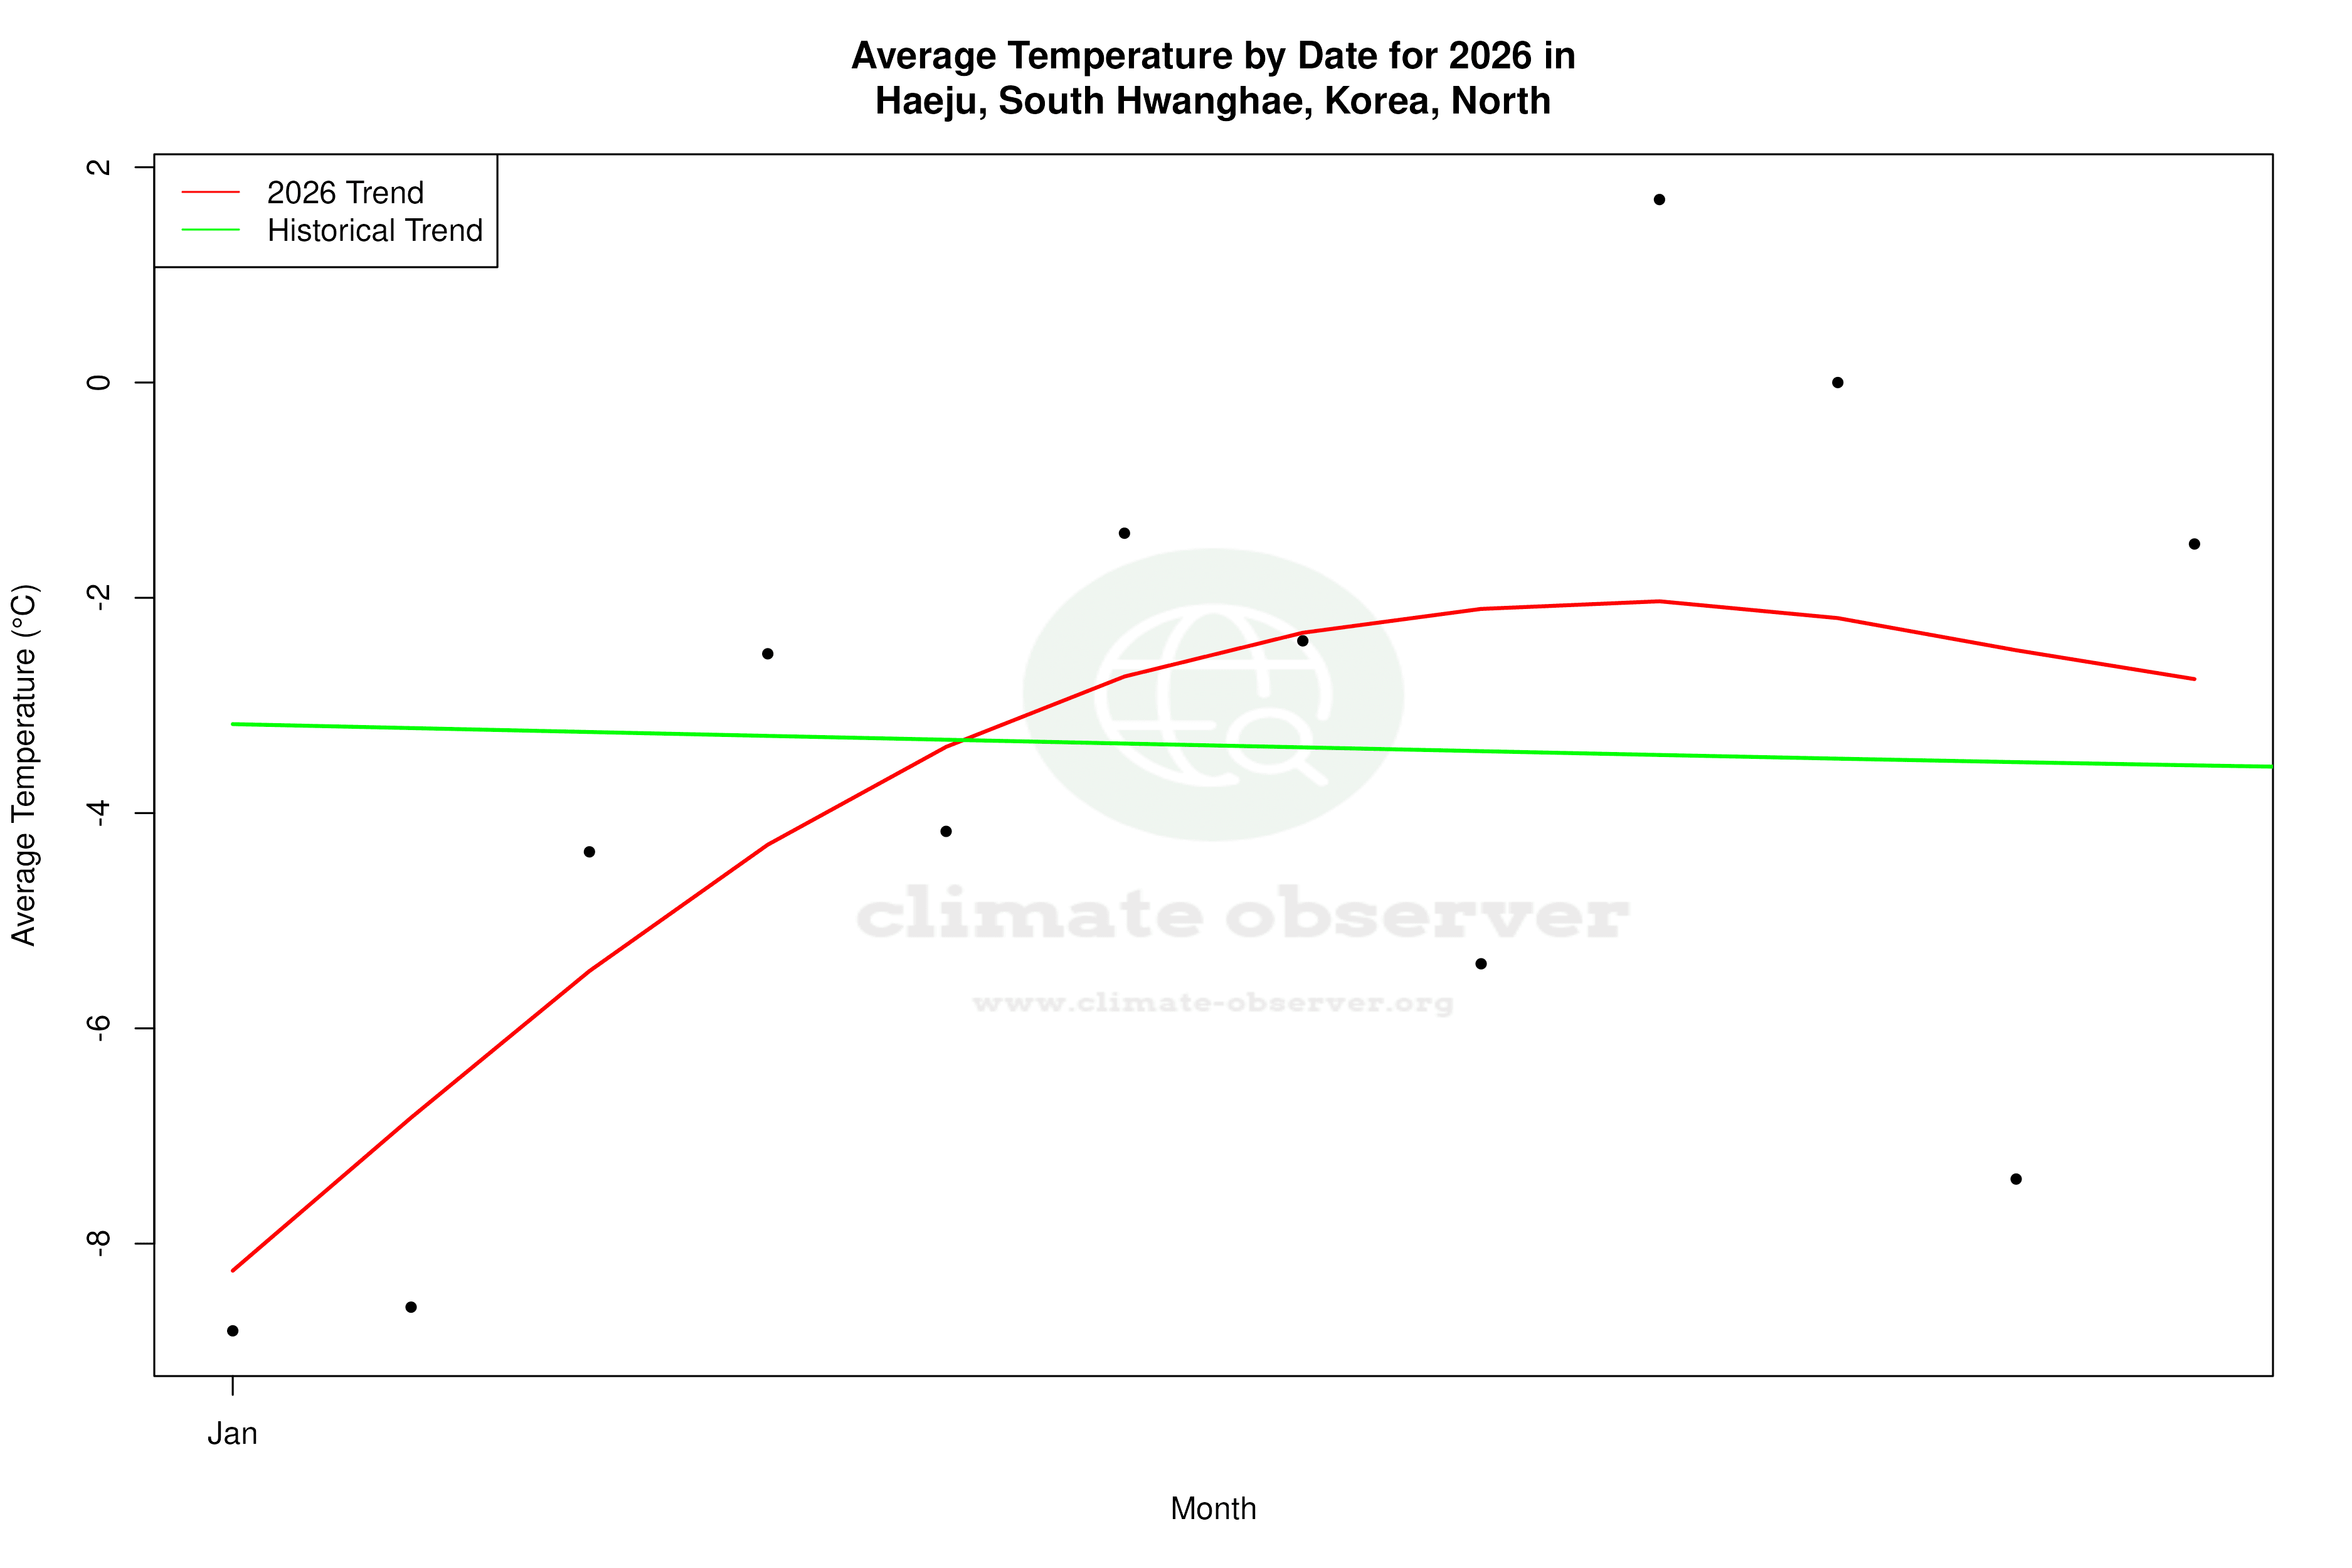
Temperature Trends: A Tale of Two Extremes
Over the past decade, Haeju has seen contrasting temperature trends. While the high temperatures have shown a slight cooling of -0.17°C (-0.31°F), the low temperatures have increased significantly by 1.60°C (2.88°F). This divergence suggests a narrowing of the temperature range between day and night, possibly due to increased cloud cover or urban heat effects. In the broader context, the all-time trends indicate a warming pattern with highs rising by 0.21°C (0.38°F) and lows by 0.36°C (0.65°F), reinforcing the gradual warming trend in the region.
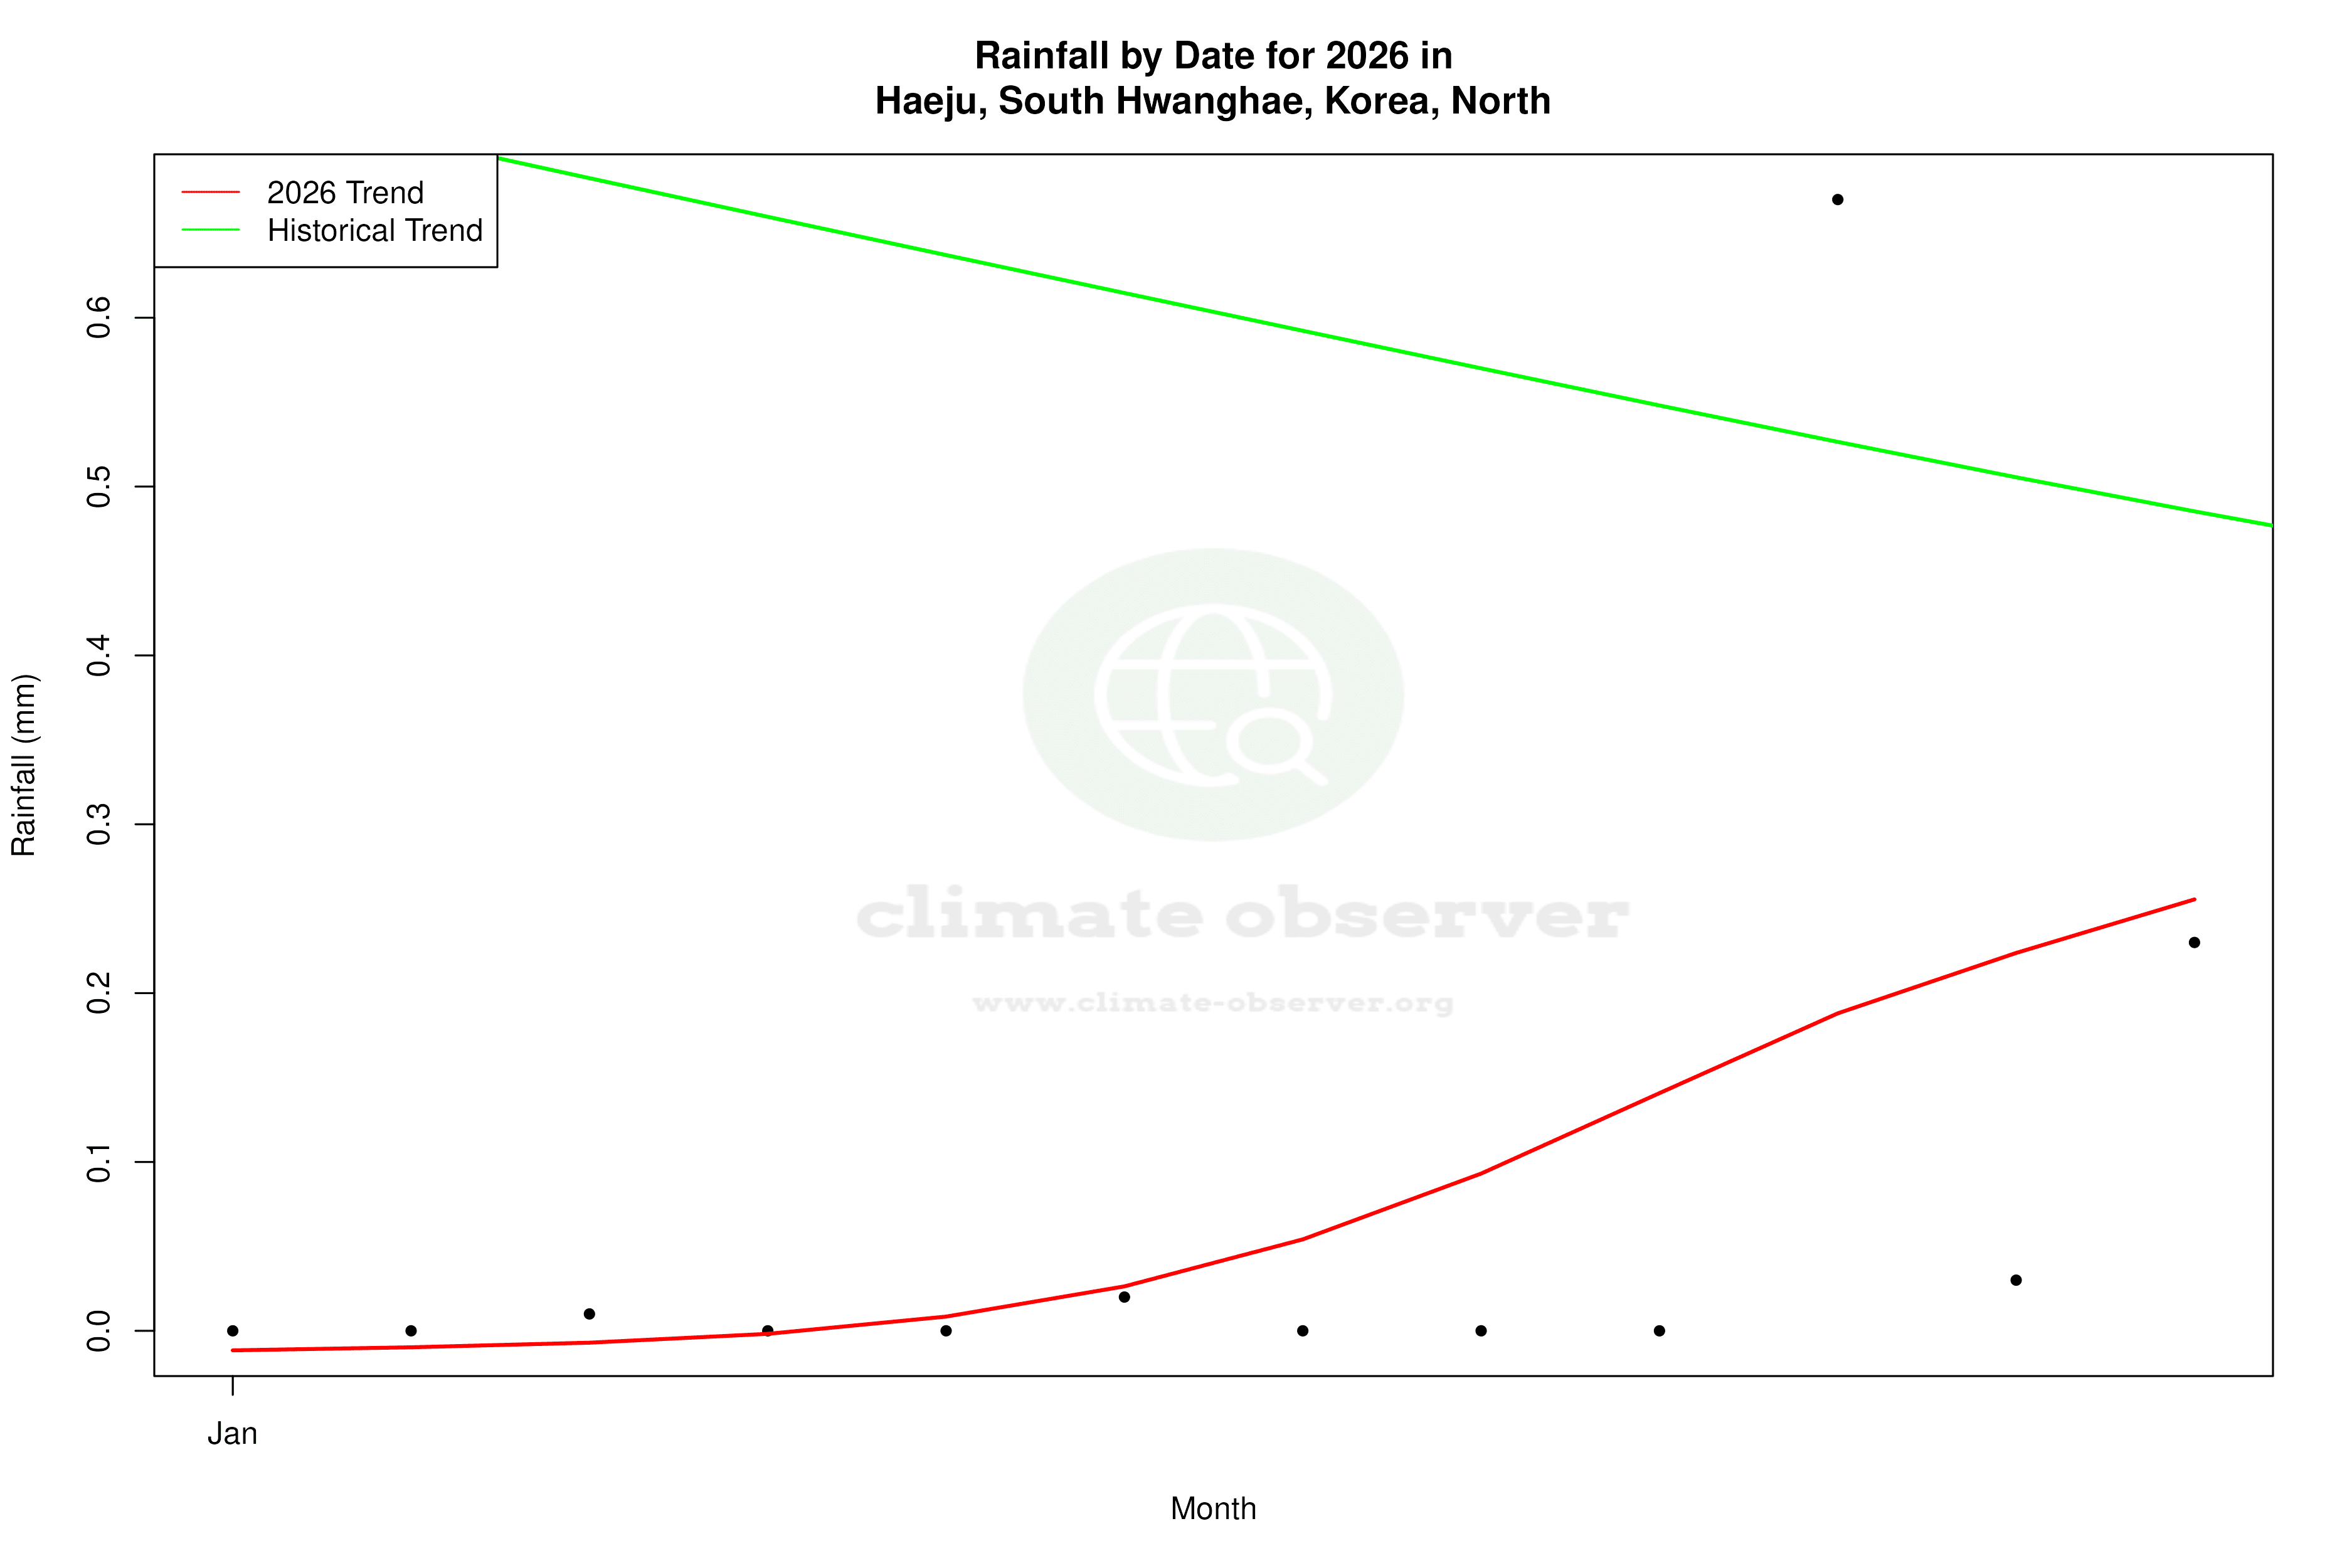
Precipitation Patterns: A Shift Towards Evenness
The Precipitation Concentration Index (PCI) has decreased from a baseline of 19.67 to a current value of 14.46, indicating a more even distribution of rainfall throughout the year. This shift suggests that precipitation events are becoming less concentrated and more frequent, potentially reducing the risk of extreme flooding events. Such a change could be beneficial for agriculture, allowing for more consistent water availability.
Temperature Extremes: Record Highs and Lows
Haeju's climate records reveal an all-time high of 37.2°C (98.96°F) and a low of -19.0°C (-2.2°F). These extremes highlight the region's vulnerability to both heatwaves and cold snaps, which can have significant implications for energy consumption and public health. The record high temperatures emphasize the need for adaptive strategies to mitigate the impact of heat on the population.
Regional Climate Goals and Implications
North Korea has been focusing on enhancing its resilience to climate change, with efforts to improve agricultural productivity and manage water resources effectively. The observed trends in Haeju align with these goals, as the more evenly distributed precipitation could support agricultural activities. However, the warming trend in low temperatures may necessitate adjustments in crop selection and irrigation practices to adapt to changing growing conditions.
Station Statistics
10-Year Trend
High: -0.90 °F/decade
Low: +1.91 °F/decade
Rain: +0.023 in/decade
25-Year Trend
High: +0.21 °F/decade
Low: +1.02 °F/decade
Rain: +0.000 in/decade
50-Year Trend
High: +0.35 °F/decade
Low: +0.76 °F/decade
Rain: +0.008 in/decade
All-Time Trend
High: +0.31 °F/decade
Low: +0.76 °F/decade
Rain: +0.008 in/decade
Percentage Above-Average Days
Last 12 Months: 55.2%
This Year: 59.1%
Precipitation Concentration Index (PCI) ℹ️
Last 12 Months: 15.3
Historical Average: 20.2
Percentile Rank of Last 12 Months ℹ️
High: 55th percentile
Low: 90th percentile
Rain: 58th percentile
Change in Variance ℹ️
High: +1.3%
Low: +4.2%
Intraday: -16.8%
Data Coverage
89.2%
First Year of Data
1957
Station Location
Historical Weather Records
| Max High | Avg High | Min High | Max Avg | Avg Avg | Min Avg | Max Low | Avg Low | Min Low | Max Precipitation | Avg Precipitation | Max Snow | Avg Snow | |
|---|---|---|---|---|---|---|---|---|---|---|---|---|---|
| Record | 98.96 °F | — | 8.96 °F | 89.06 °F | — | 1.22 °F | 82.04 °F | — | -2.20 °F | 12.99 in | — | — | — |
| January | 53.60 °F | 33.60 °F | 9.14 °F | 49.46 °F | 25.75 °F | 1.22 °F | 44.06 °F | 18.38 °F | -2.02 °F | 1.63 in | 0.02 in | — | — |
| February | 58.46 °F | 38.24 °F | 13.64 °F | 53.24 °F | 30.22 °F | 7.16 °F | 46.94 °F | 22.24 °F | -2.20 °F | 1.67 in | 0.02 in | — | — |
| March | 73.22 °F | 48.45 °F | 21.20 °F | 60.44 °F | 39.81 °F | 14.18 °F | 52.16 °F | 31.10 °F | 10.40 °F | 1.80 in | 0.04 in | — | — |
| April | 81.86 °F | 60.80 °F | 39.02 °F | 71.24 °F | 51.72 °F | 27.68 °F | 60.44 °F | 42.20 °F | 21.02 °F | 2.91 in | 0.07 in | — | — |
| May | 94.10 °F | 70.32 °F | 51.98 °F | 78.98 °F | 61.43 °F | 46.40 °F | 66.49 °F | 52.37 °F | 32.00 °F | 5.16 in | 0.11 in | — | — |
| June | 96.80 °F | 77.34 °F | 60.44 °F | 83.30 °F | 69.44 °F | 54.32 °F | 72.50 °F | 62.02 °F | 46.40 °F | 4.37 in | 0.14 in | — | — |
| July | 96.80 °F | 80.91 °F | 60.80 °F | 88.52 °F | 75.00 °F | 57.38 °F | 81.50 °F | 69.76 °F | 51.62 °F | 12.99 in | 0.41 in | — | — |
| August | 98.96 °F | 83.58 °F | 64.58 °F | 89.06 °F | 76.92 °F | 62.42 °F | 82.04 °F | 70.73 °F | 49.64 °F | 8.07 in | 0.30 in | — | — |
| September | 93.20 °F | 77.30 °F | 59.72 °F | 83.48 °F | 69.10 °F | 51.44 °F | 77.00 °F | 61.24 °F | 36.14 °F | 5.39 in | 0.13 in | — | — |
| October | 85.28 °F | 66.58 °F | 41.72 °F | 76.46 °F | 57.42 °F | 34.70 °F | 68.54 °F | 48.57 °F | 23.54 °F | 4.35 in | 0.06 in | — | — |
| November | 77.00 °F | 51.90 °F | 21.02 °F | 66.74 °F | 43.70 °F | 15.26 °F | 63.32 °F | 36.01 °F | 12.02 °F | 1.38 in | 0.05 in | — | — |
| December | 62.96 °F | 38.45 °F | 8.96 °F | 53.78 °F | 30.83 °F | 3.56 °F | 46.04 °F | 23.75 °F | -0.40 °F | 2.09 in | 0.02 in | — | — |
Data Visualisations
Remove WatermarksCurrent Year Climate Trends vs Historical


Max Temperature this Year | 1 of 6
Climate 12-Month Moving Averages


Max Temperature 12-Month MA | 1 of 6
Daily Data Points and Averages Throughout the Year
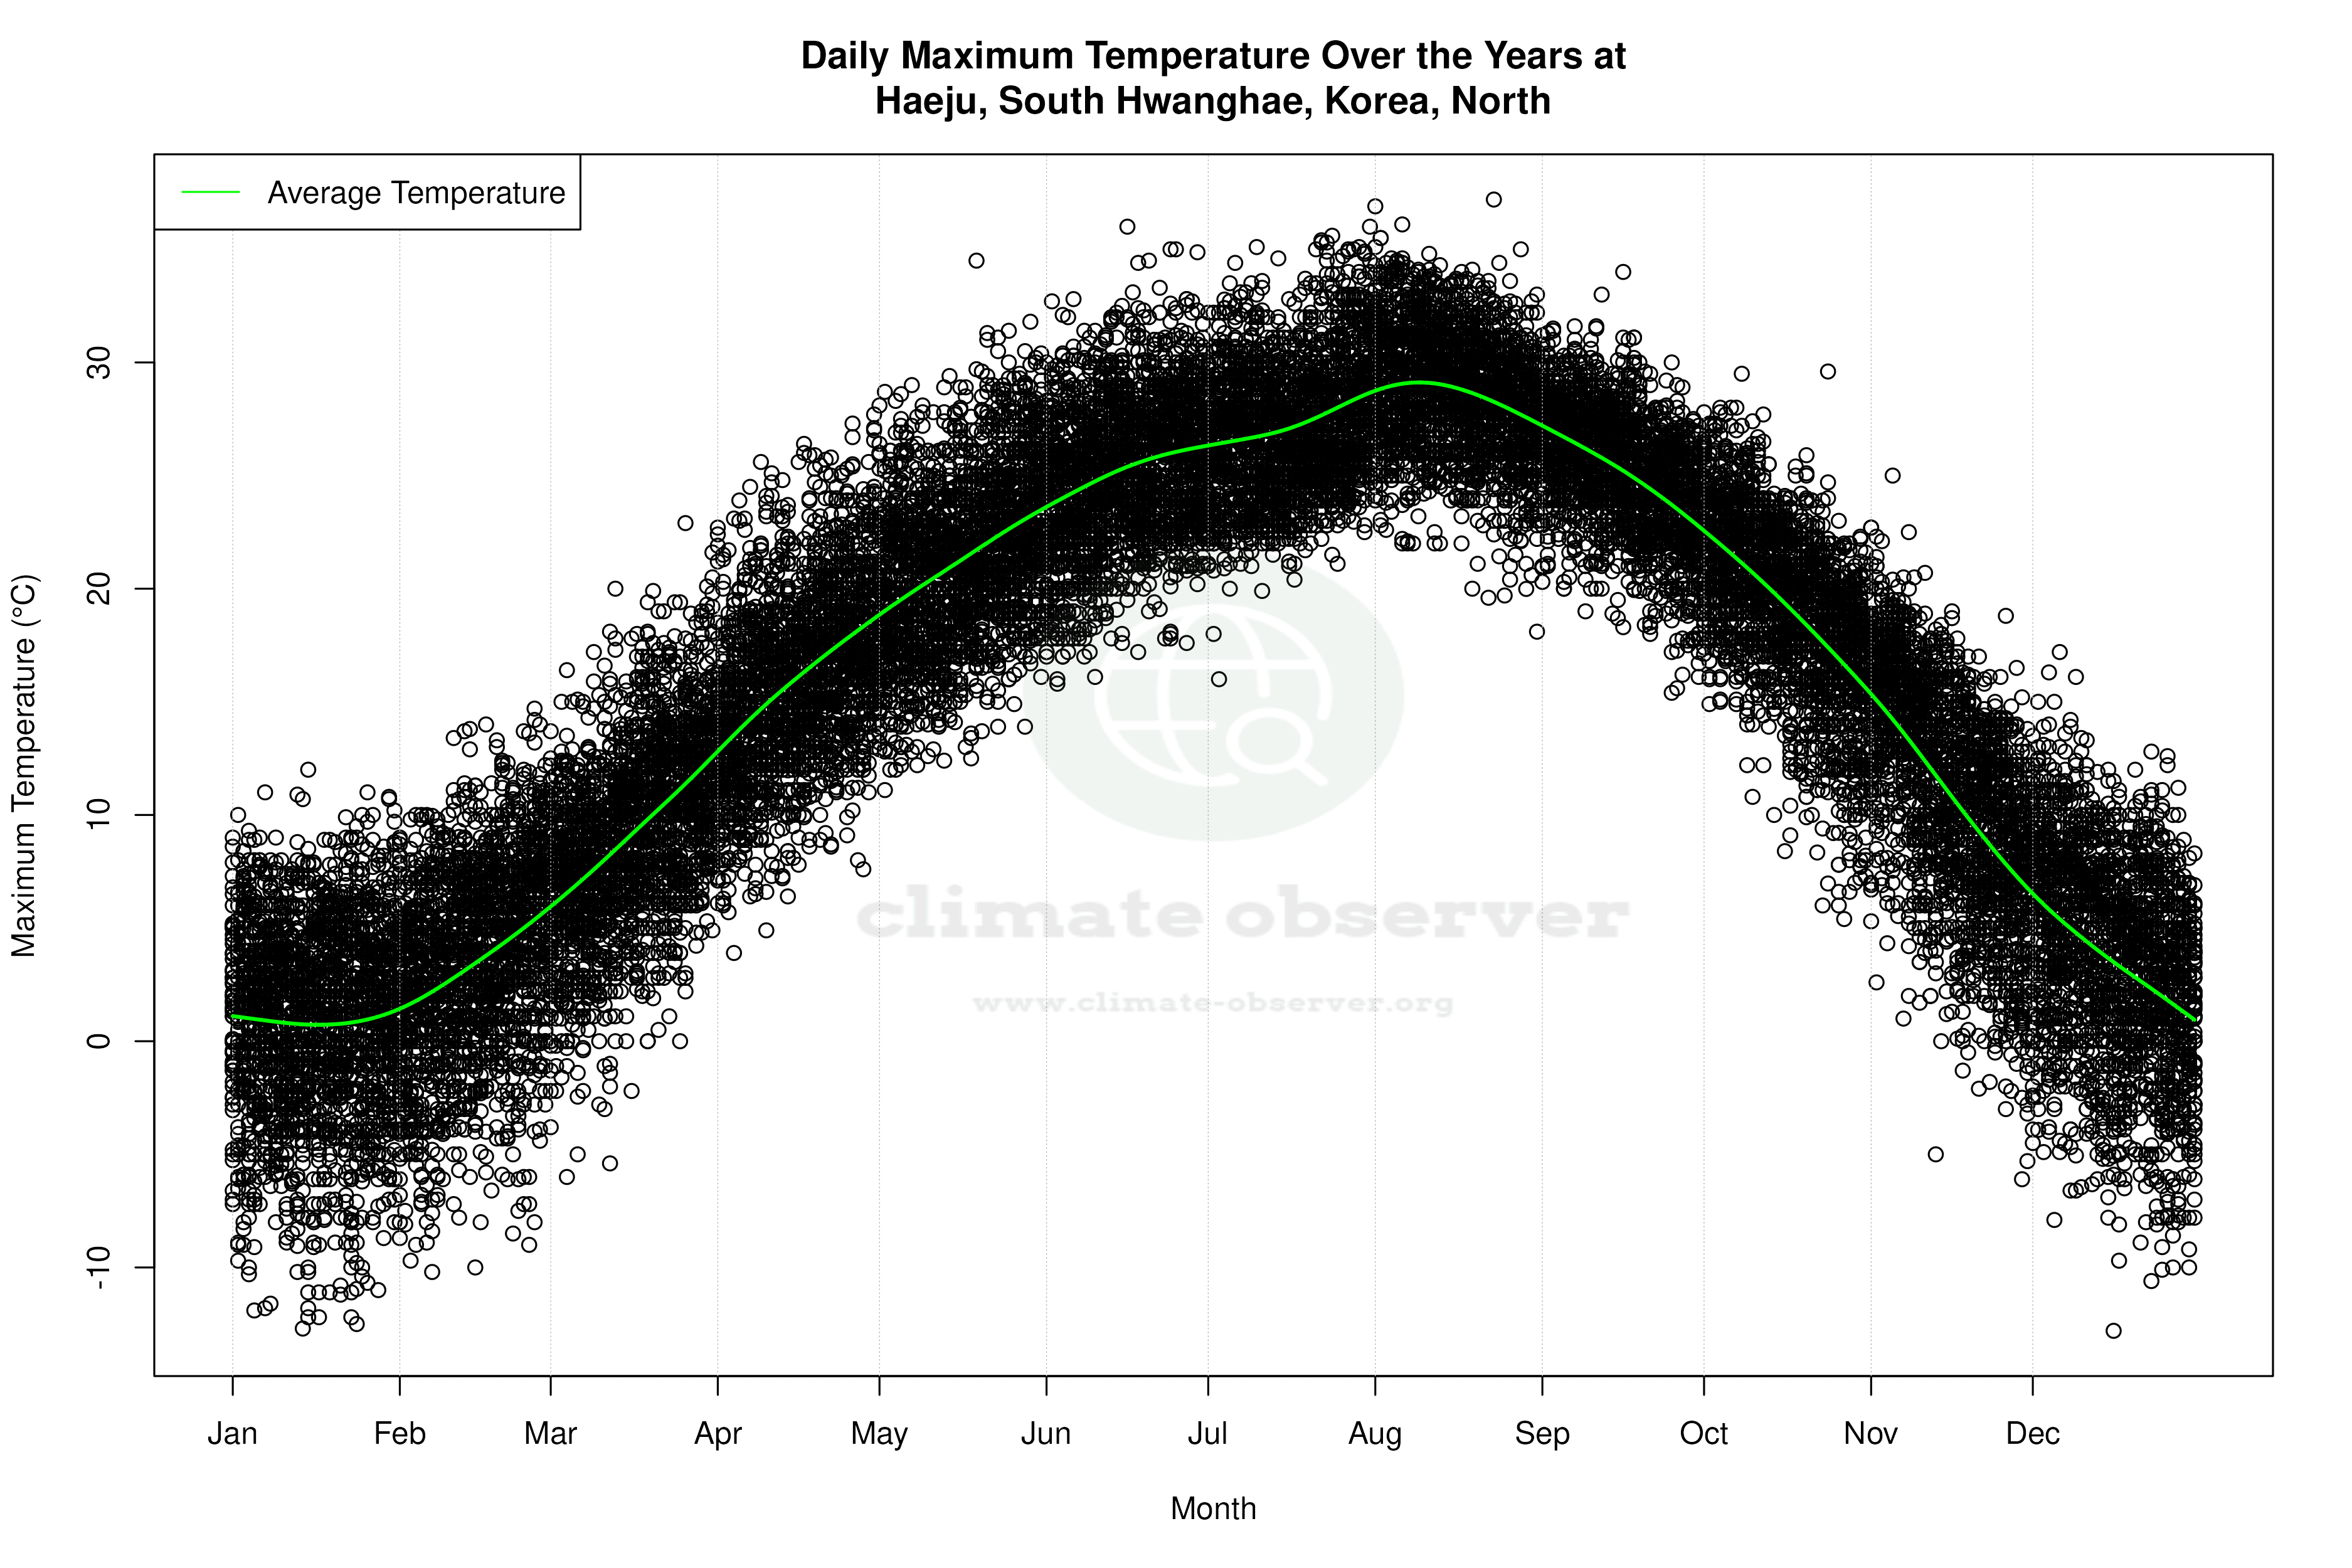


Average Max Temperature Throughout Year | 1 of 5
