Climate for Station: Jeju, Korea, South
Loading live weather...
Climate Analysis & Overview
Jeju's climate is experiencing a subtle warming trend, with notable changes in temperature extremes and precipitation patterns. The island's unique geography plays a significant role in shaping its climate, and recent data highlights both short-term and long-term shifts.
Island Climate Dynamics
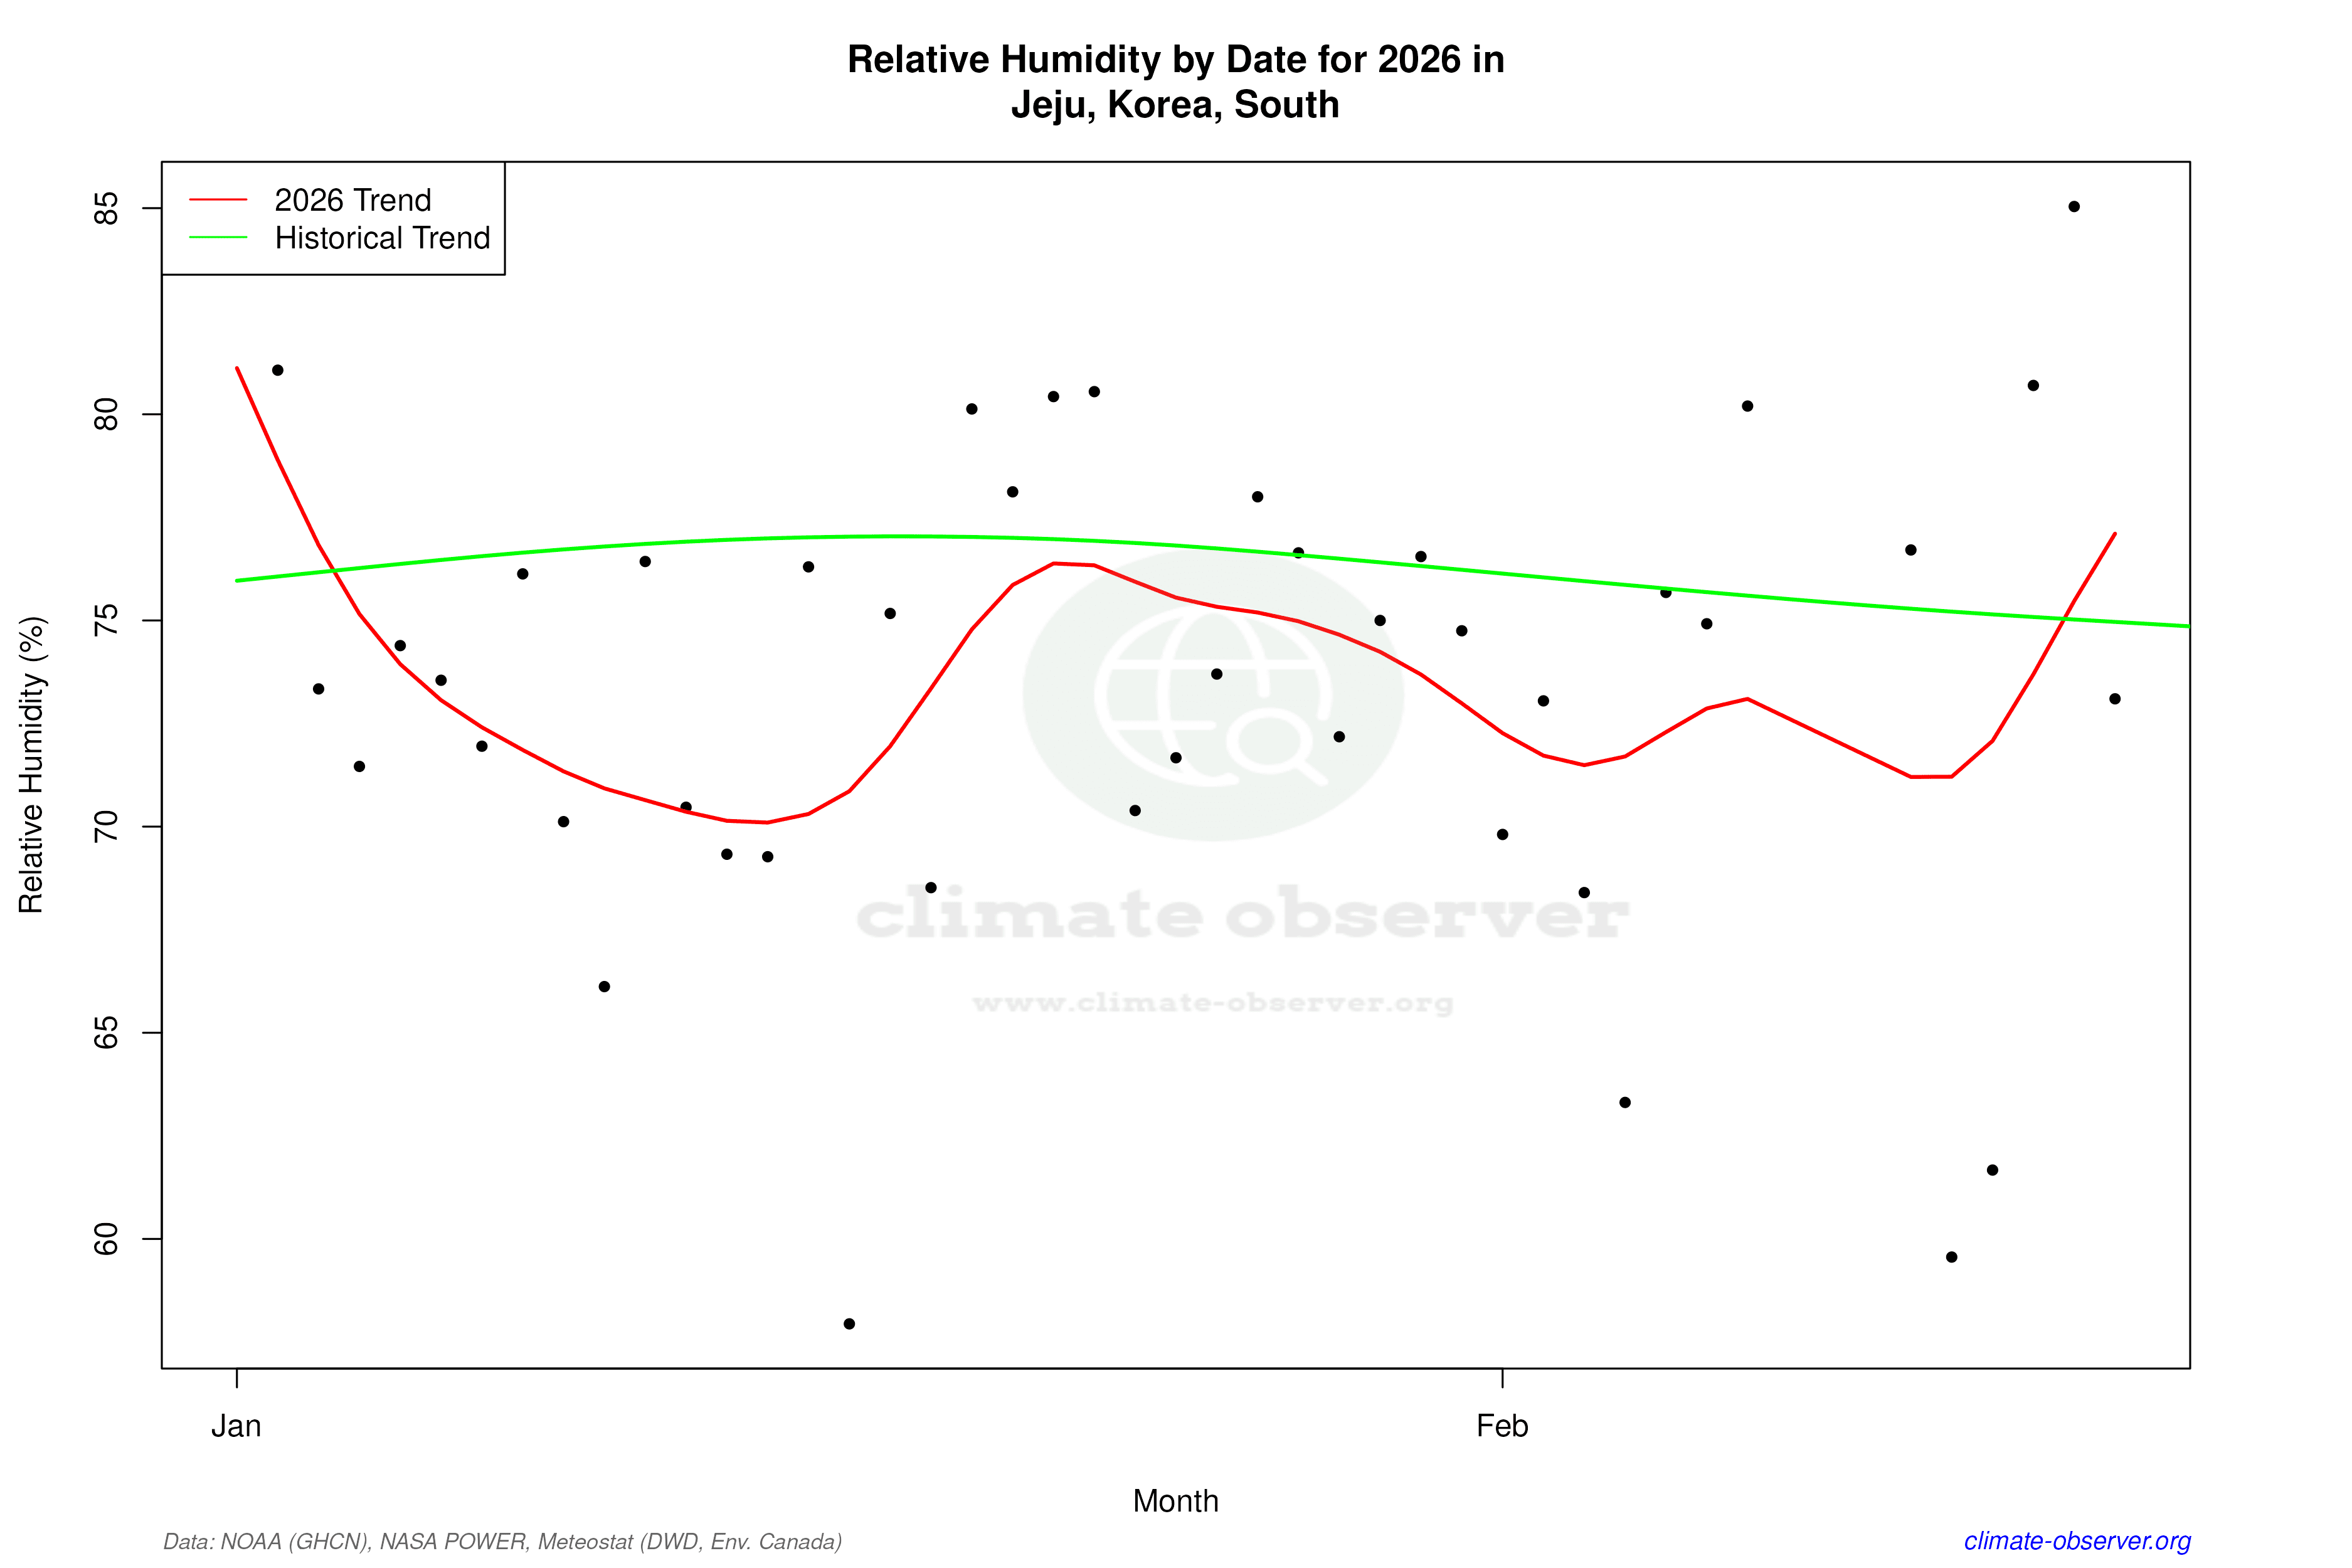
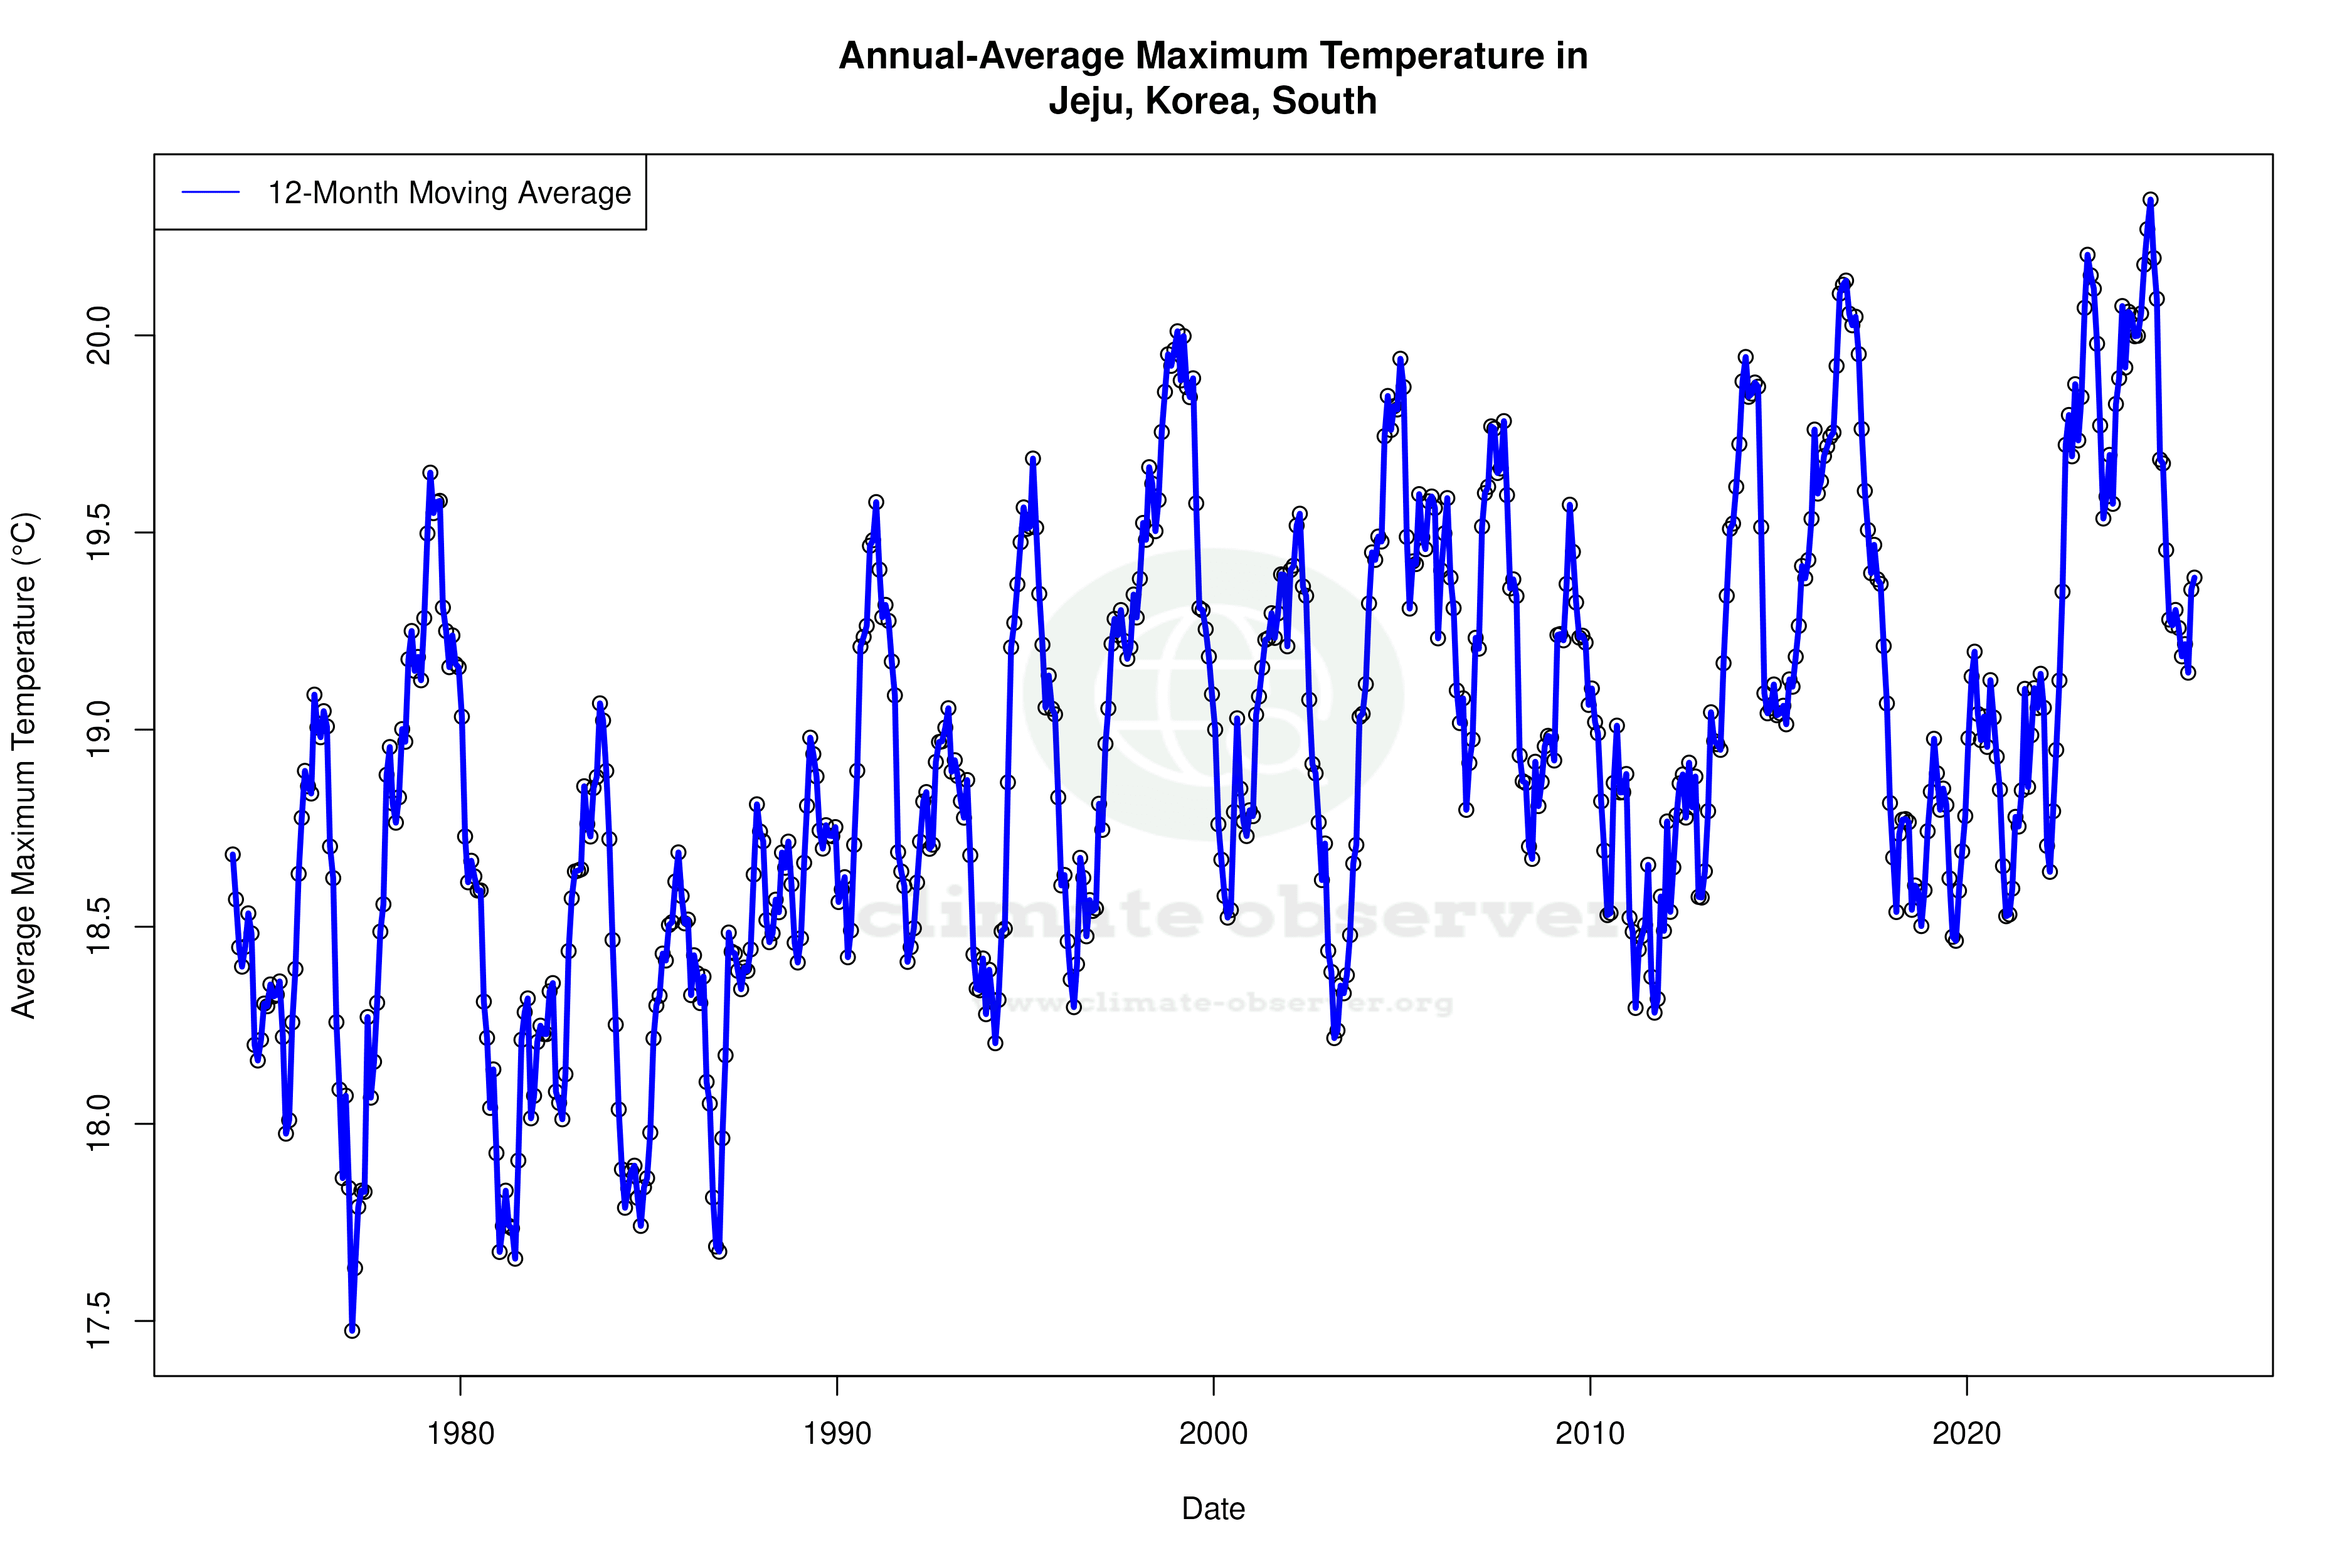
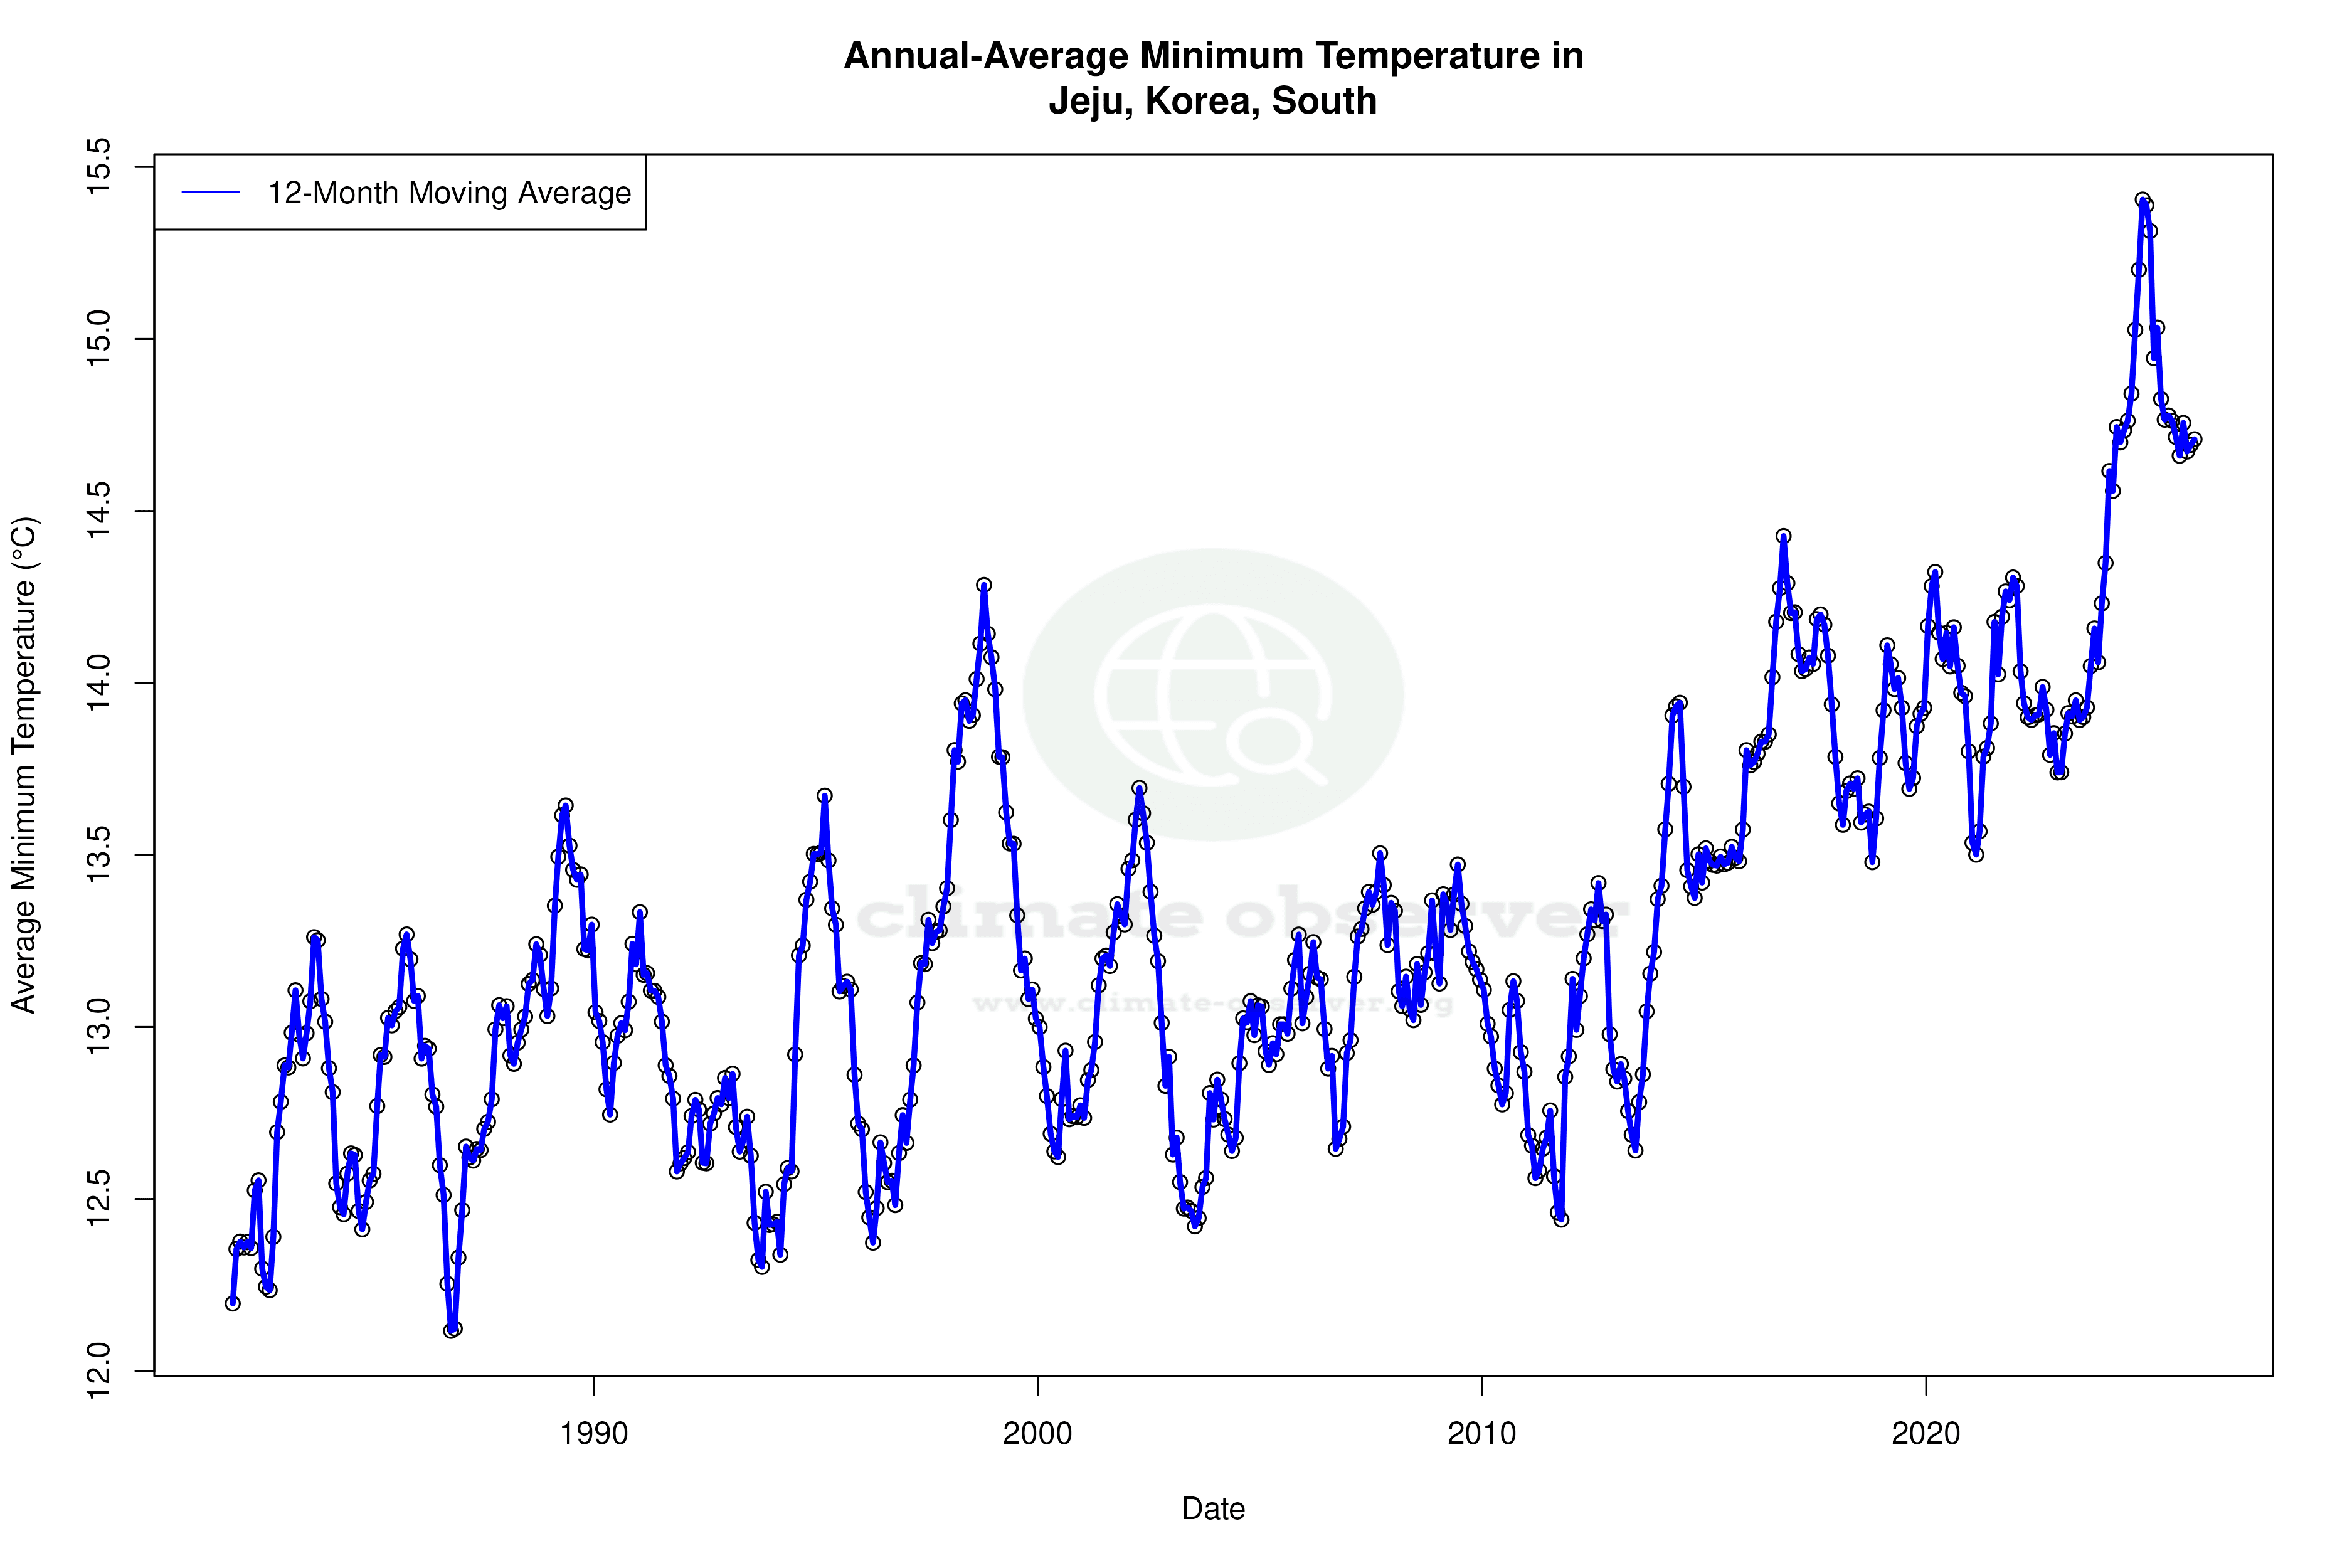
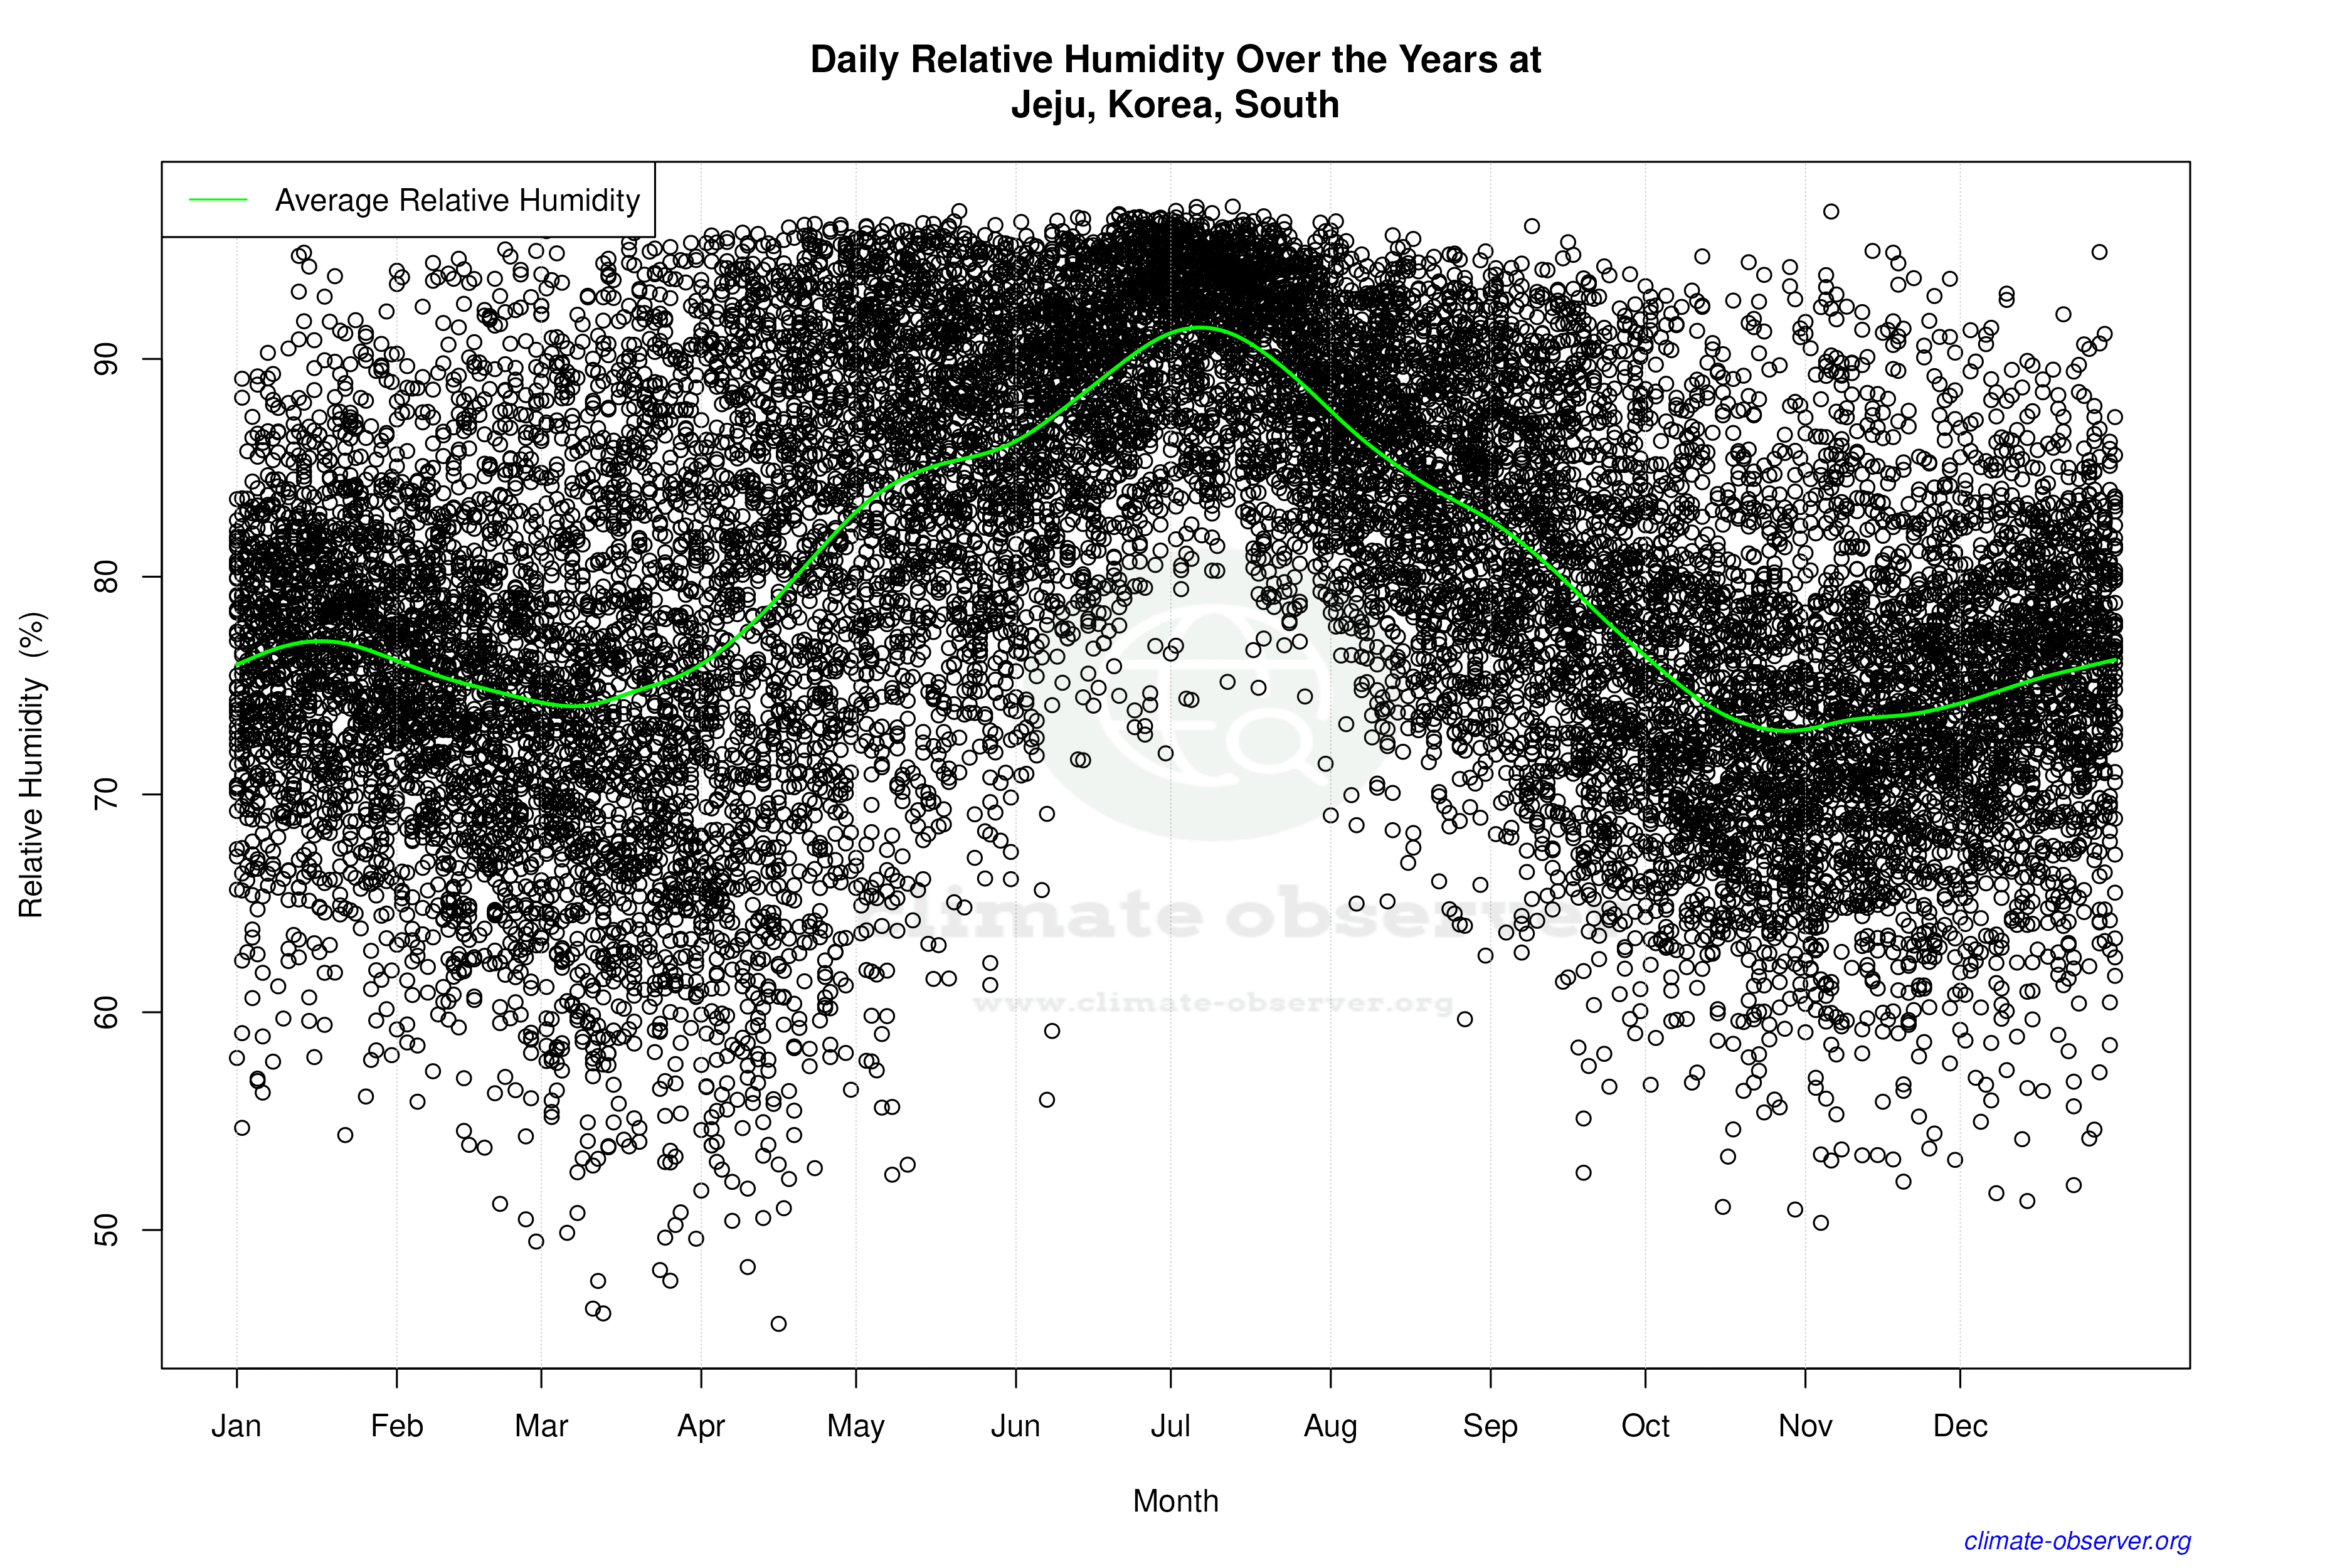
Jeju Island, located off the southern coast of Korea, is classified under the Köppen climate classification as Cfa, indicating a humid subtropical climate. This classification is heavily influenced by the island's mountainous terrain and proximity to the sea, which moderate temperatures and contribute to high humidity levels. Over the past decade, Jeju has seen a warming trend with highs increasing by 0.99°C (1.78°F) and lows by 1.02°C (1.84°F). These changes are more pronounced than the all-time trends, which show a rise of 0.16°C (0.29°F) for highs and 0.35°C (0.63°F) for lows. This suggests a more rapid warming in recent years, likely influenced by both local and global climatic factors.
Temperature Extremes and Records
Jeju's climate data reveals significant temperature extremes, with a recorded maximum temperature of 43.4°C (110.1°F) and a minimum of -10.5°C (13.1°F). These extremes underscore the island's capacity for both intense heat and cold, despite its generally mild climate. The warming trends observed in both highs and lows suggest that these extremes may become more frequent or intense, posing challenges for local ecosystems and human activities.
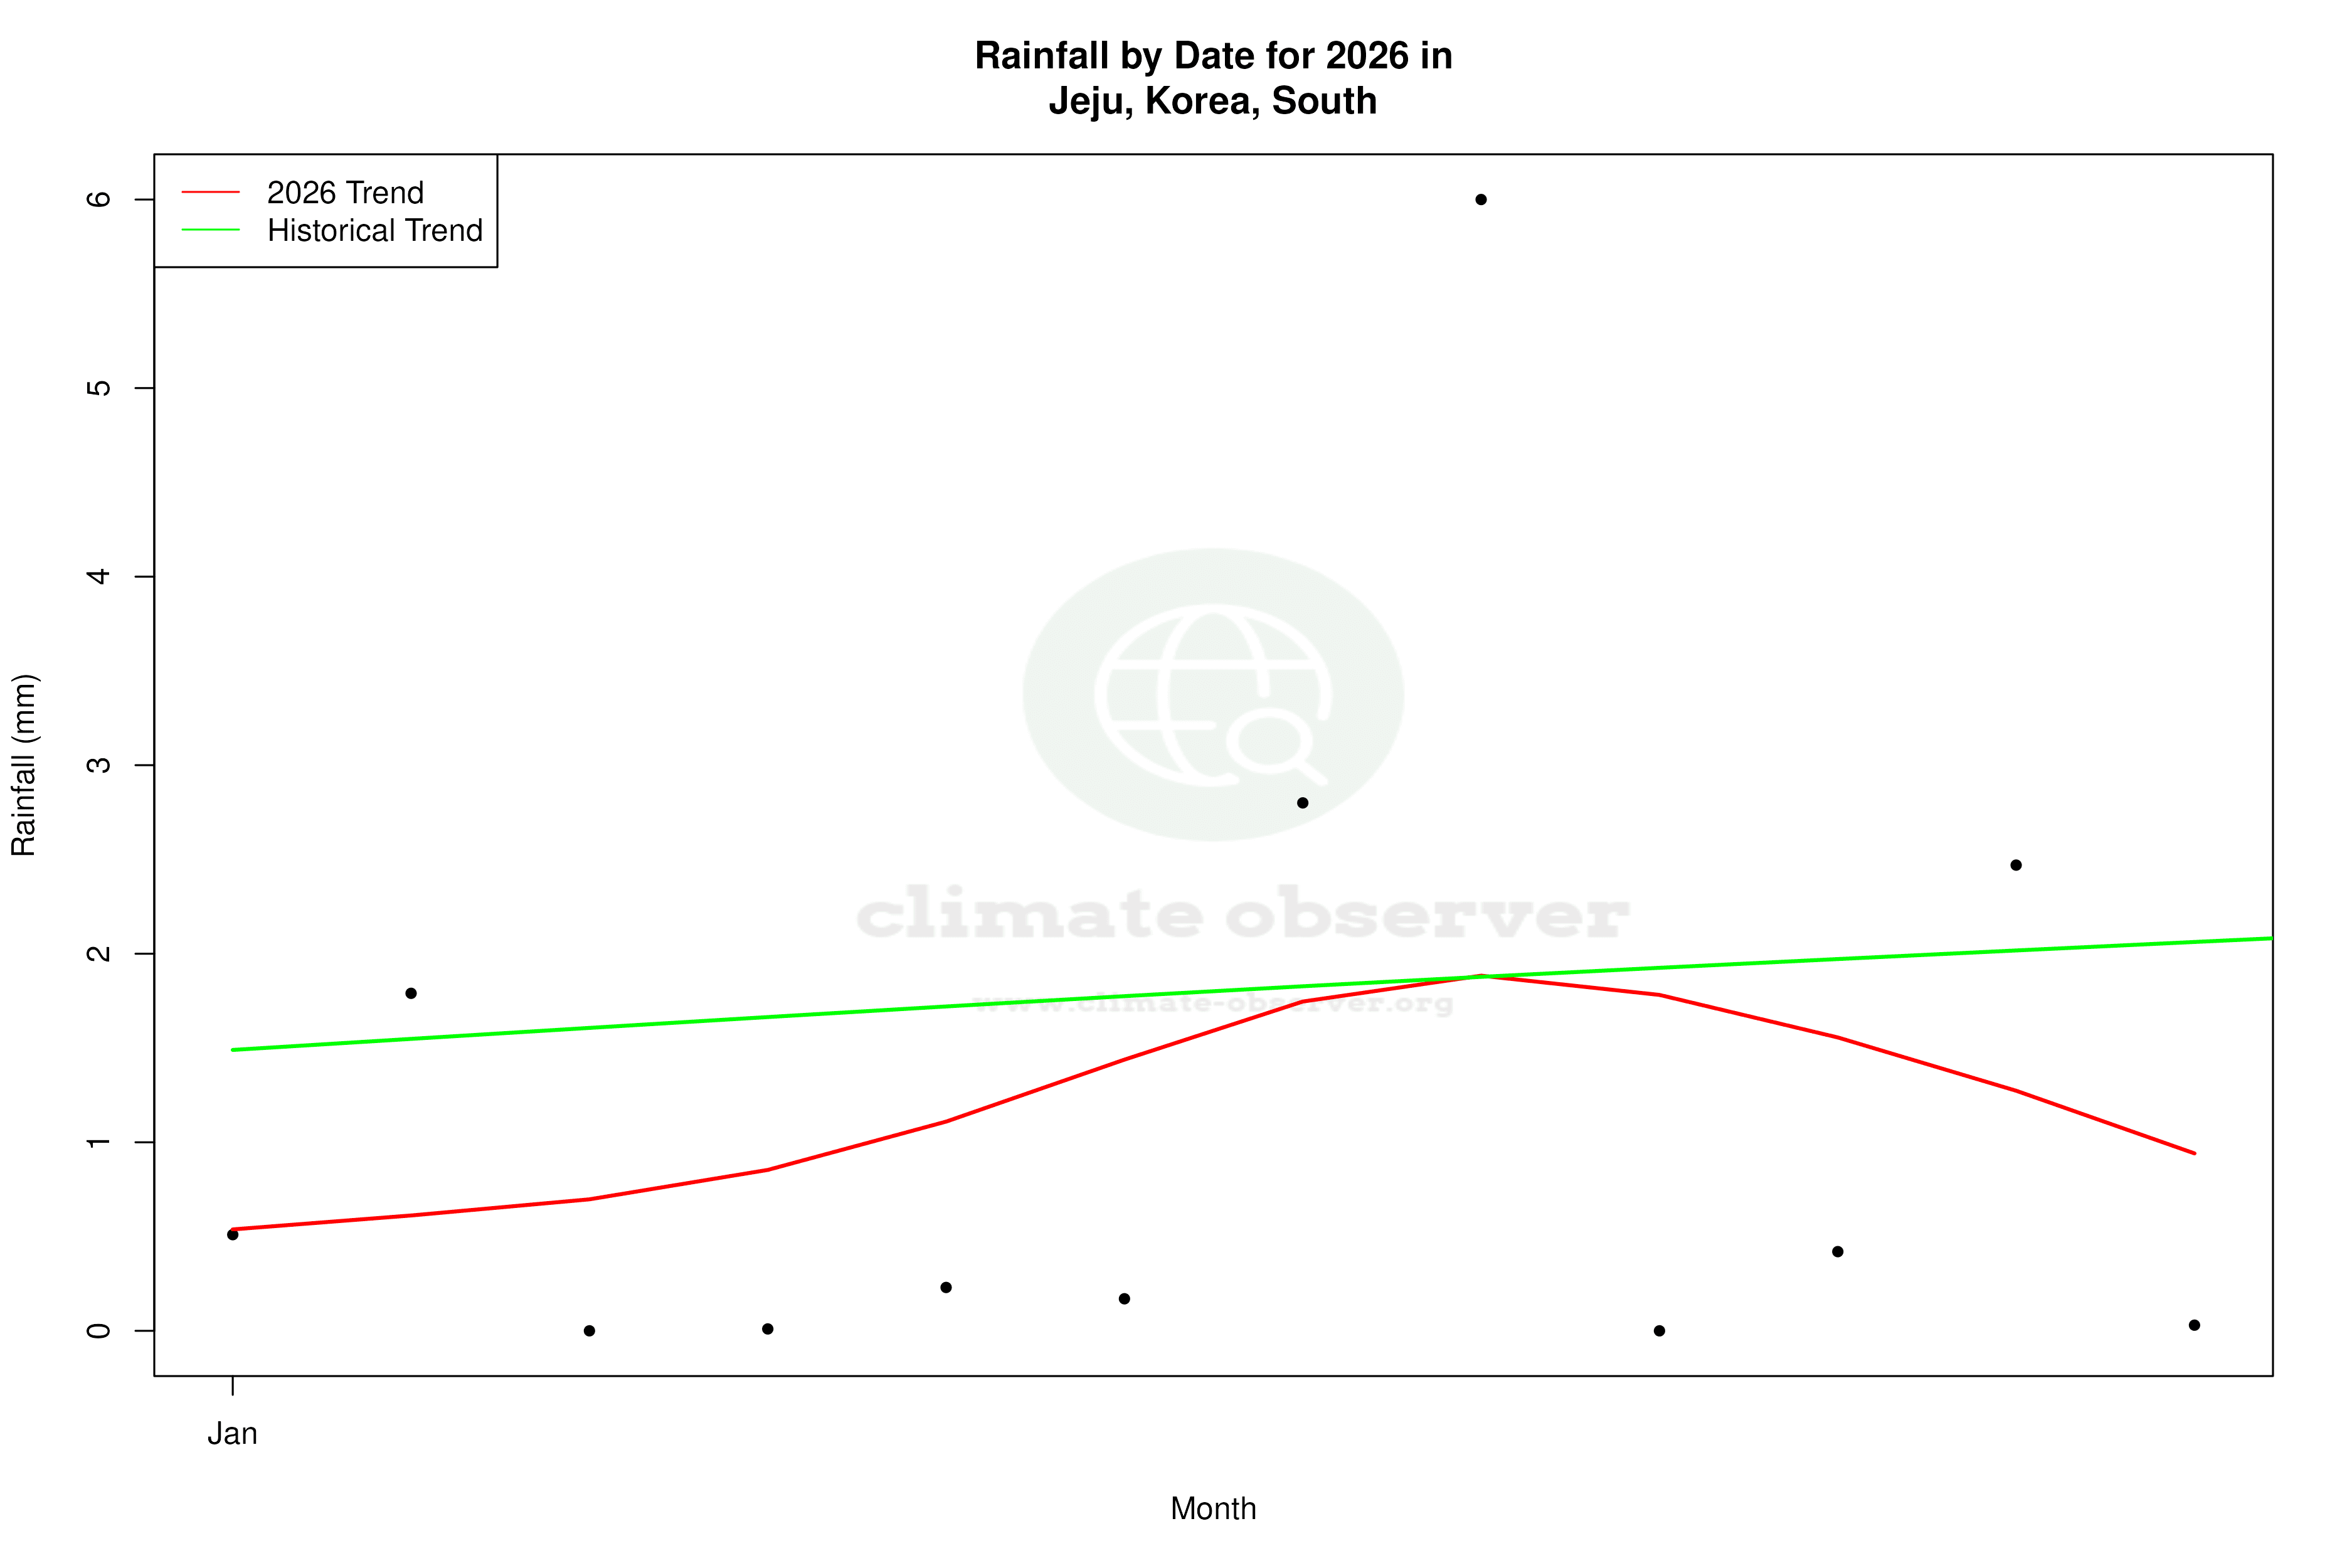
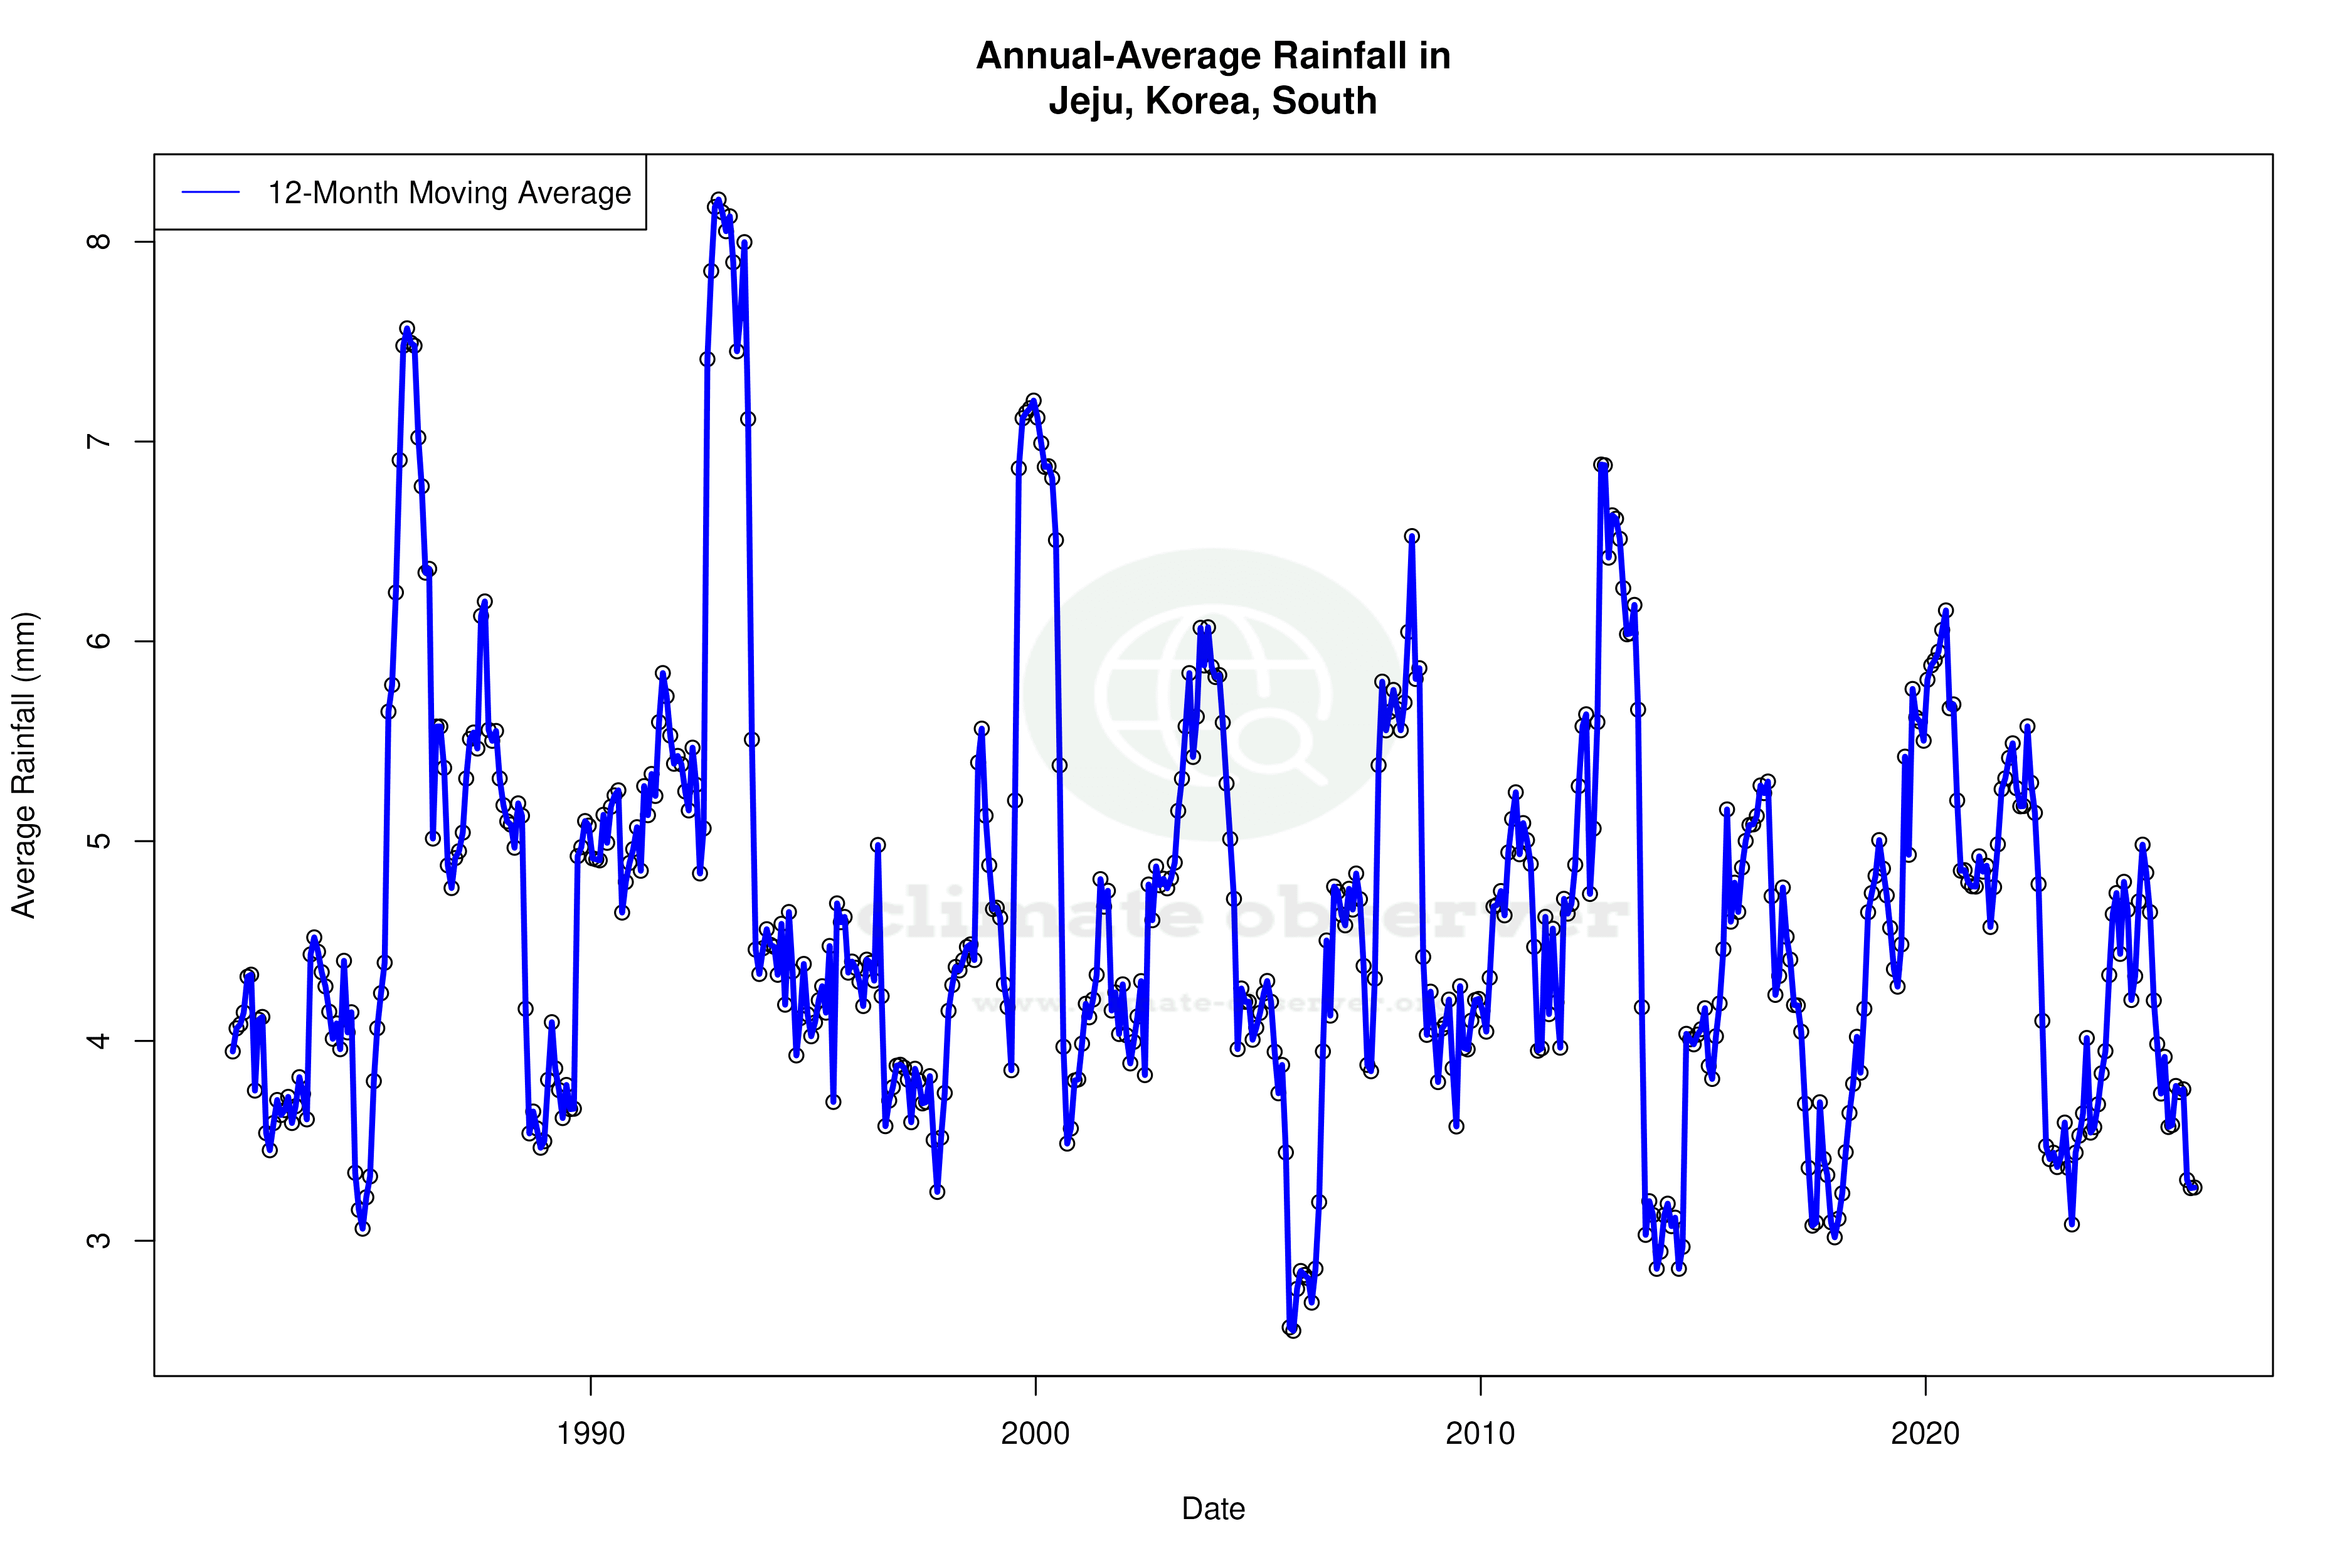
Precipitation Patterns and Distribution
The Precipitation Concentration Index (PCI) for Jeju has decreased from a baseline of 14.0 to a current value of 11.9, indicating a more even distribution of rainfall across the year. This change suggests that while the overall amount of precipitation may not have significantly altered, the frequency and intensity of rain events have become more balanced. Such shifts can have implications for water resource management and agricultural practices on the island.
Regional Climate Context
Jeju's climate trends are reflective of broader regional patterns in South Korea, where efforts to mitigate climate change impacts are ongoing. The country's commitment to reducing greenhouse gas emissions and enhancing climate resilience is critical as it faces increasingly variable weather patterns. Recent weather events, such as typhoons and heatwaves, have highlighted the need for adaptive strategies to cope with these changes.
Implications for the Future
The observed warming trends and changes in precipitation patterns on Jeju Island highlight the dynamic nature of its climate. As these trends continue, they may influence various sectors, including agriculture, tourism, and infrastructure. Understanding and adapting to these changes will be crucial for the island's sustainable development and resilience in the face of climate change.
Station Statistics
10-Year Trend
High: +2.15 °F/decade
Low: +2.07 °F/decade
Rain: -0.016 in/decade
25-Year Trend
High: +0.44 °F/decade
Low: +1.37 °F/decade
Rain: -0.005 in/decade
50-Year Trend
High: +0.42 °F/decade
Low: +0.63 °F/decade
Rain: -0.005 in/decade
All-Time Trend
High: +0.41 °F/decade
Low: +0.63 °F/decade
Rain: -0.005 in/decade
Percentage Above-Average Days
Last 12 Months: 50.4%
This Year: 38.2%
Precipitation Concentration Index (PCI) ℹ️
Last 12 Months: 9.1
Historical Average: 13.7
Percentile Rank of Last 12 Months ℹ️
High: 99th percentile
Low: 98th percentile
Rain: 13th percentile
Change in Variance ℹ️
High: +3.7%
Low: +8.2%
Intraday: -31.8%
Data Coverage
69.5%
First Year of Data
1951
Station Location
Historical Weather Records
| Max High | Avg High | Min High | Max Avg | Avg Avg | Min Avg | Max Low | Avg Low | Min Low | Max Precipitation | Avg Precipitation | Max Snow | Avg Snow | |
|---|---|---|---|---|---|---|---|---|---|---|---|---|---|
| Record | 110.12 °F | — | 30.20 °F | 90.86 °F | — | 26.78 °F | 85.46 °F | — | 13.10 °F | 11.81 in | — | — | — |
| January | 71.60 °F | 47.13 °F | 30.20 °F | 65.66 °F | 42.43 °F | 27.86 °F | 59.54 °F | 38.39 °F | 13.10 °F | 2.72 in | 0.08 in | — | — |
| February | 76.10 °F | 48.93 °F | 30.20 °F | 66.92 °F | 43.67 °F | 26.78 °F | 61.52 °F | 38.78 °F | 21.20 °F | 2.36 in | 0.10 in | — | — |
| March | 82.94 °F | 55.22 °F | 33.80 °F | 68.90 °F | 49.20 °F | 29.66 °F | 63.86 °F | 43.52 °F | 20.30 °F | 2.40 in | 0.12 in | — | — |
| April | 86.18 °F | 63.62 °F | 46.76 °F | 75.38 °F | 57.23 °F | 41.72 °F | 69.26 °F | 50.66 °F | 33.44 °F | 4.80 in | 0.13 in | — | — |
| May | 89.60 °F | 70.82 °F | 55.22 °F | 82.04 °F | 64.30 °F | 50.72 °F | 74.66 °F | 58.09 °F | 42.80 °F | 4.75 in | 0.13 in | — | — |
| June | 94.10 °F | 76.53 °F | 64.40 °F | 87.26 °F | 70.86 °F | 59.90 °F | 82.04 °F | 65.92 °F | 43.88 °F | 8.27 in | 0.25 in | — | — |
| July | 108.86 °F | 84.14 °F | 66.56 °F | 89.24 °F | 78.83 °F | 64.58 °F | 84.92 °F | 74.25 °F | 56.66 °F | 8.90 in | 0.30 in | — | — |
| August | 110.12 °F | 85.71 °F | 69.80 °F | 90.86 °F | 80.67 °F | 69.26 °F | 85.46 °F | 76.15 °F | 57.92 °F | 11.81 in | 0.35 in | — | — |
| September | 94.28 °F | 78.73 °F | 67.24 °F | 87.08 °F | 73.58 °F | 61.16 °F | 82.40 °F | 69.37 °F | 47.48 °F | 9.57 in | 0.29 in | — | — |
| October | 87.44 °F | 70.56 °F | 53.24 °F | 80.96 °F | 65.01 °F | 48.02 °F | 77.72 °F | 60.14 °F | 34.34 °F | 6.84 in | 0.10 in | — | — |
| November | 83.12 °F | 61.01 °F | 42.08 °F | 74.48 °F | 55.47 °F | 39.20 °F | 70.68 °F | 50.33 °F | 26.60 °F | 4.25 in | 0.10 in | — | — |
| December | 71.96 °F | 51.45 °F | 34.70 °F | 66.02 °F | 46.58 °F | 30.20 °F | 62.60 °F | 41.99 °F | 20.84 °F | 1.81 in | 0.07 in | — | — |
Data Visualisations
Remove WatermarksCurrent Year Climate Trends vs Historical


Max Temperature this Year | 1 of 6
Climate 12-Month Moving Averages


Max Temperature 12-Month MA | 1 of 6
Daily Data Points and Averages Throughout the Year


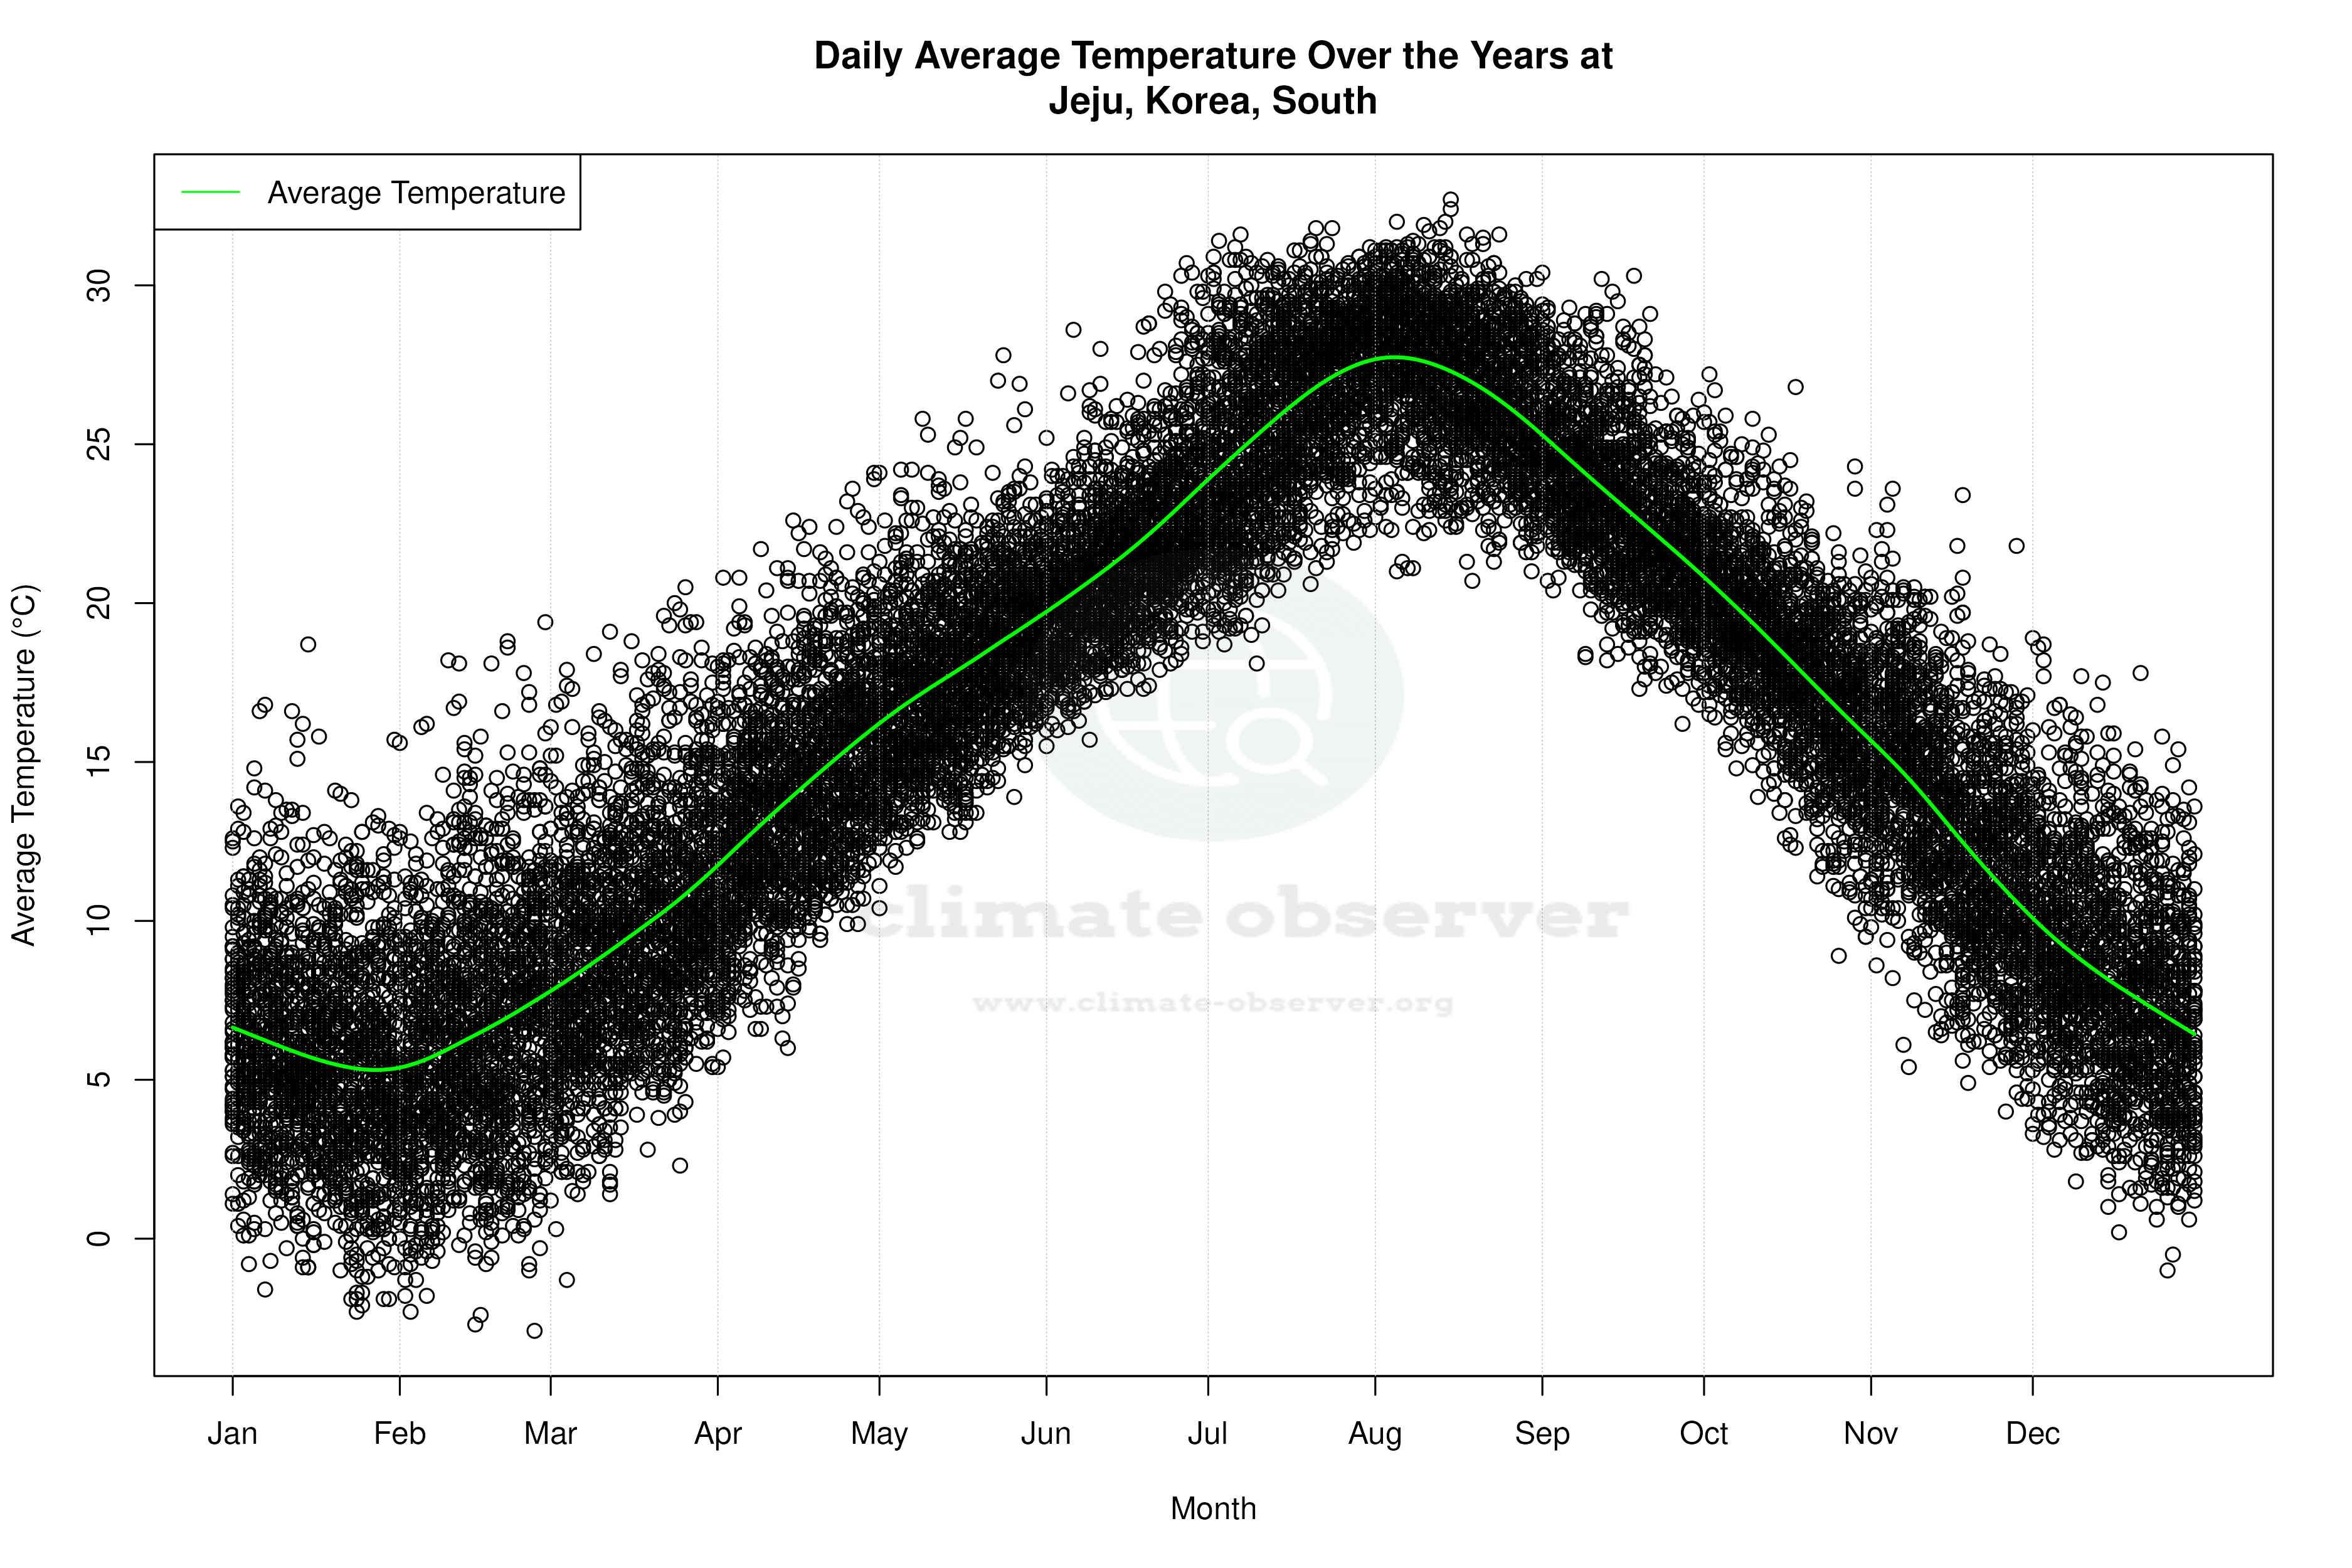

Average Max Temperature Throughout Year | 1 of 5
