Climate for Station: Aktobe, Aktobe Region, Kazakhstan
Loading live weather...
Climate Analysis & Overview
Aktobe, located in the heart of Kazakhstan, is experiencing a notable warming trend over the past decade, with significant increases in both high and low temperatures. The region's precipitation patterns have become more evenly distributed, suggesting a shift in local climate dynamics.
Warming Trends in Aktobe
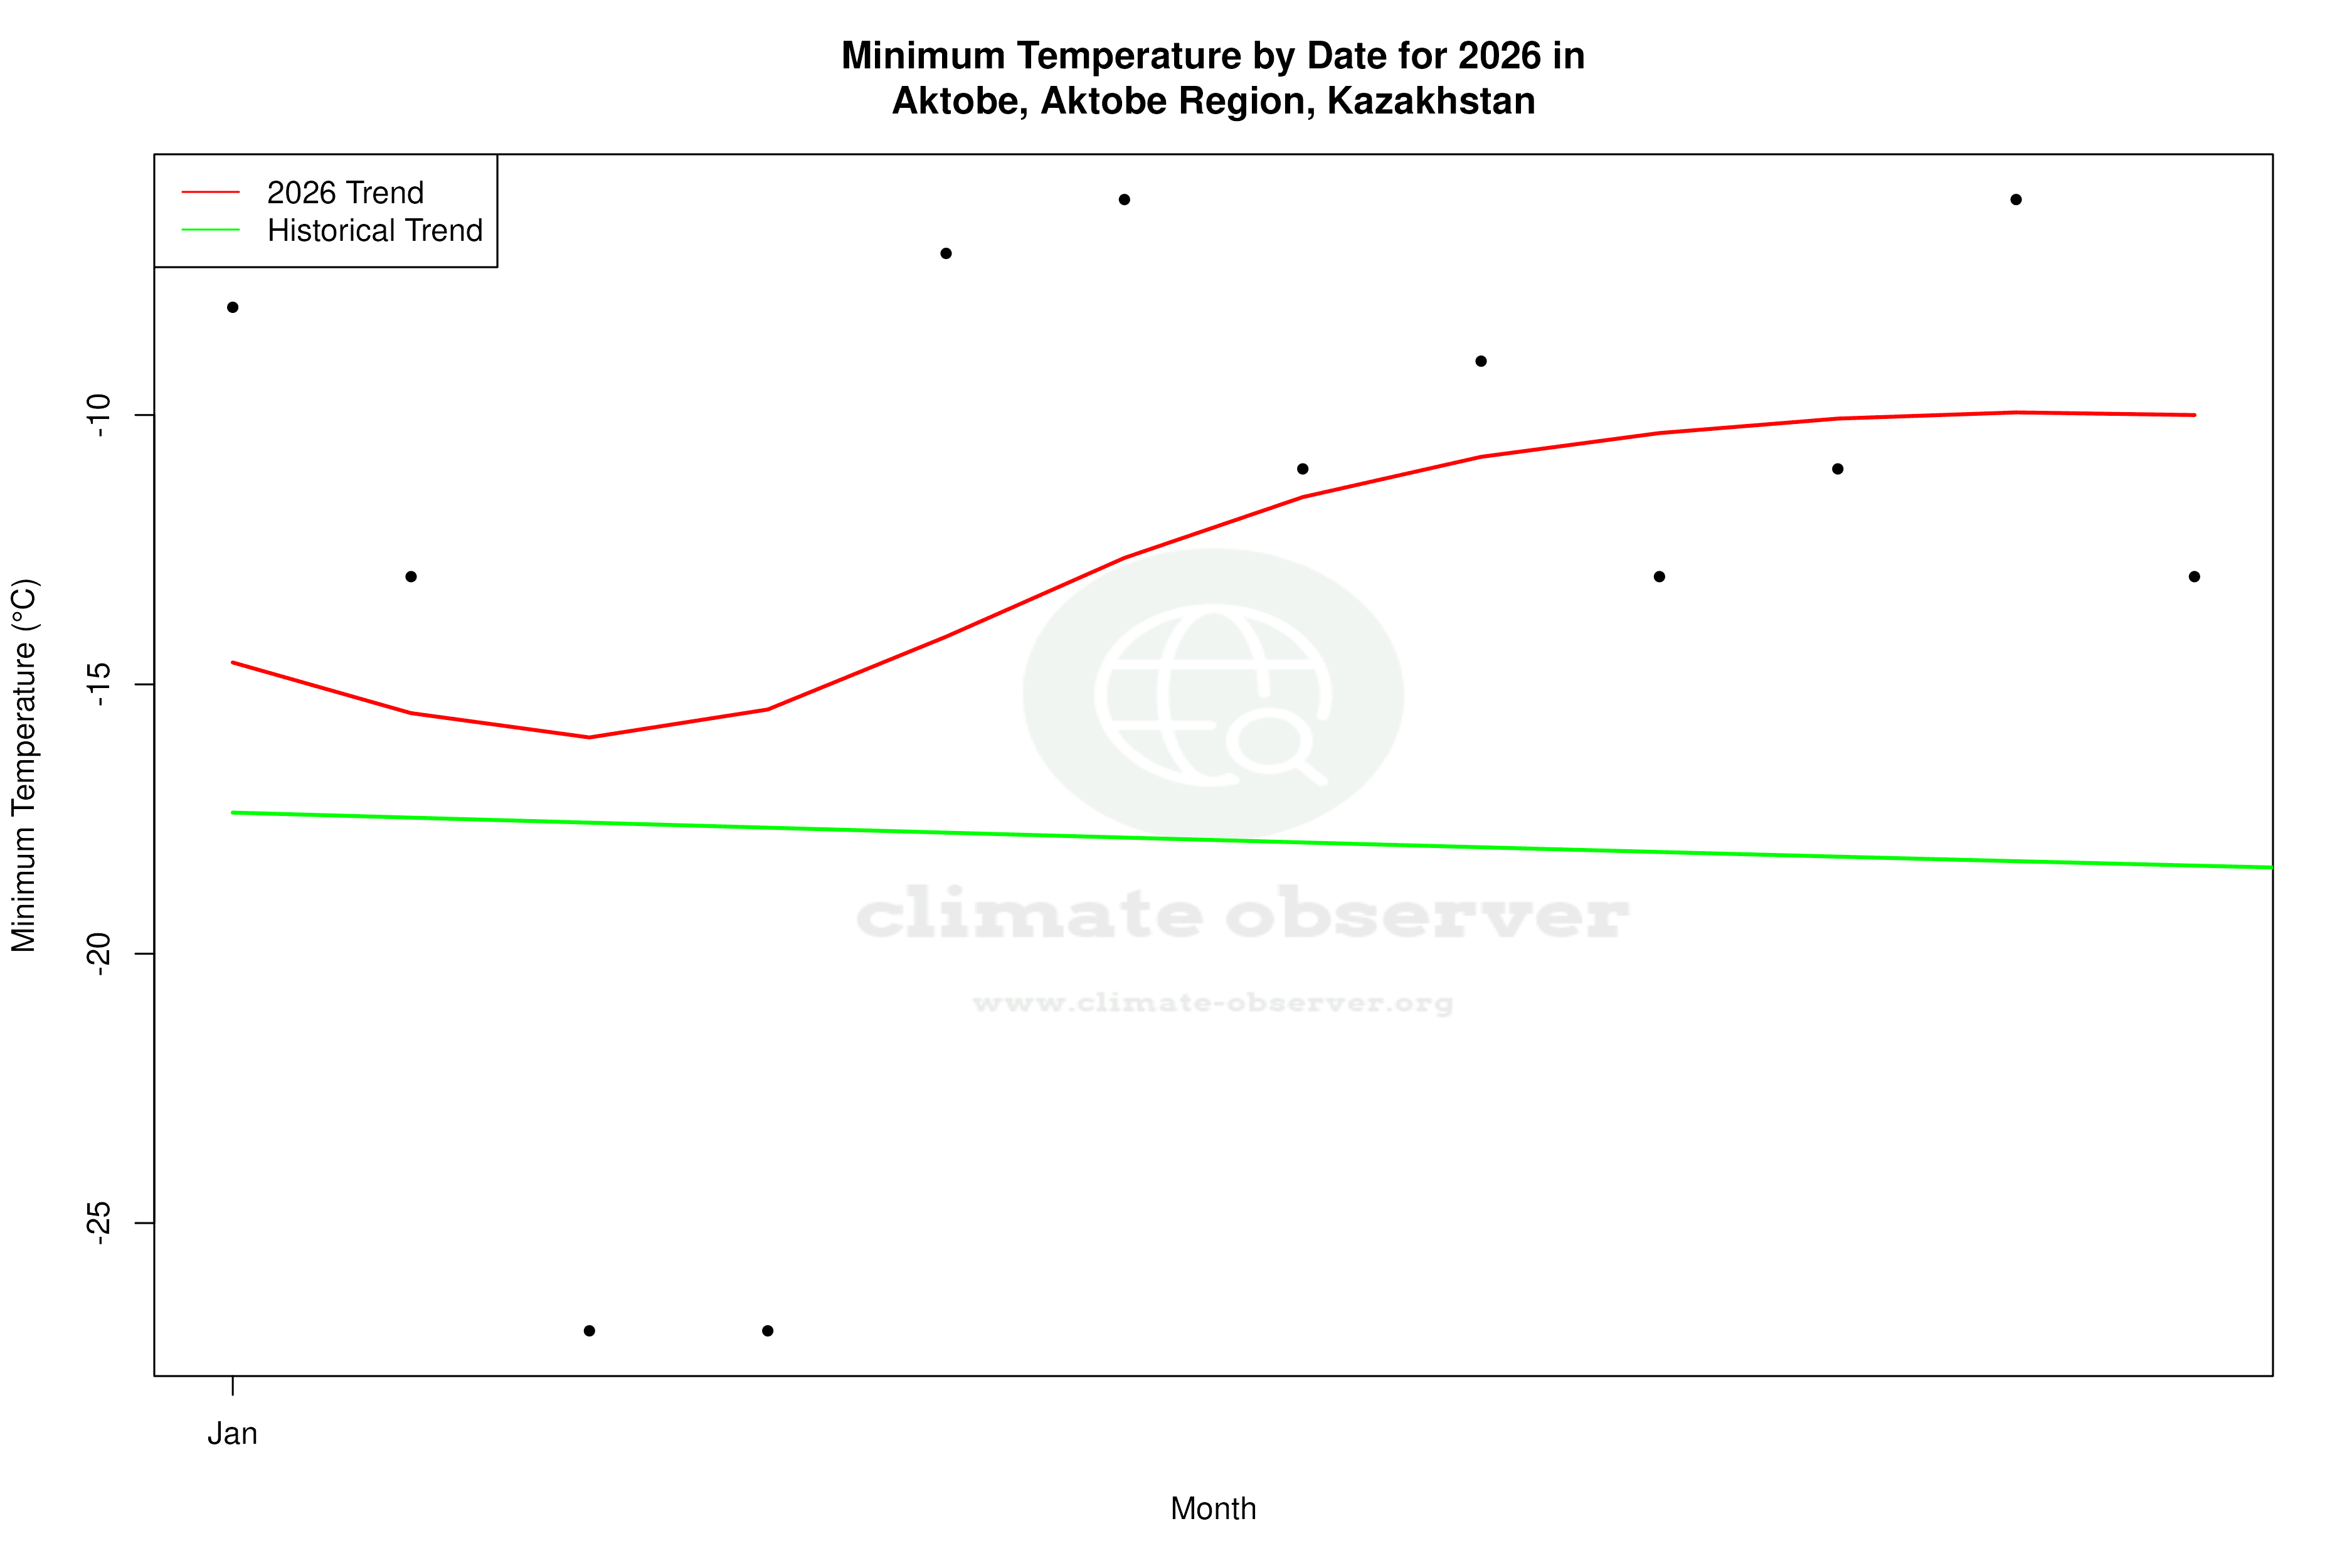
Aktobe's climate, classified as a cold semi-arid climate under the Köppen system, is characterised by hot summers and cold winters. Over the past ten years, the city has seen a significant warming trend, with average high temperatures increasing by 1.61°C (2.90°F) and lows rising by 1.30°C (2.35°F). This recent warming is more pronounced than the all-time trends, which show a smaller increase of 0.27°C (0.49°F) for highs and 0.25°C (0.45°F) for lows. This discrepancy highlights a recent acceleration in temperature changes, possibly influenced by regional climate initiatives aimed at mitigating extreme weather events.
Temperature Extremes
Aktobe's temperature records reflect its continental climate, with an all-time high of 42.9°C (109.2°F) and a chilling low of -48.5°C (-55.3°F). These extremes underscore the region's susceptibility to significant temperature fluctuations, which are further exacerbated by the ongoing warming trends. The city's geographical position, far from moderating oceanic influences, contributes to these sharp thermal oscillations.
Precipitation Patterns and Distribution
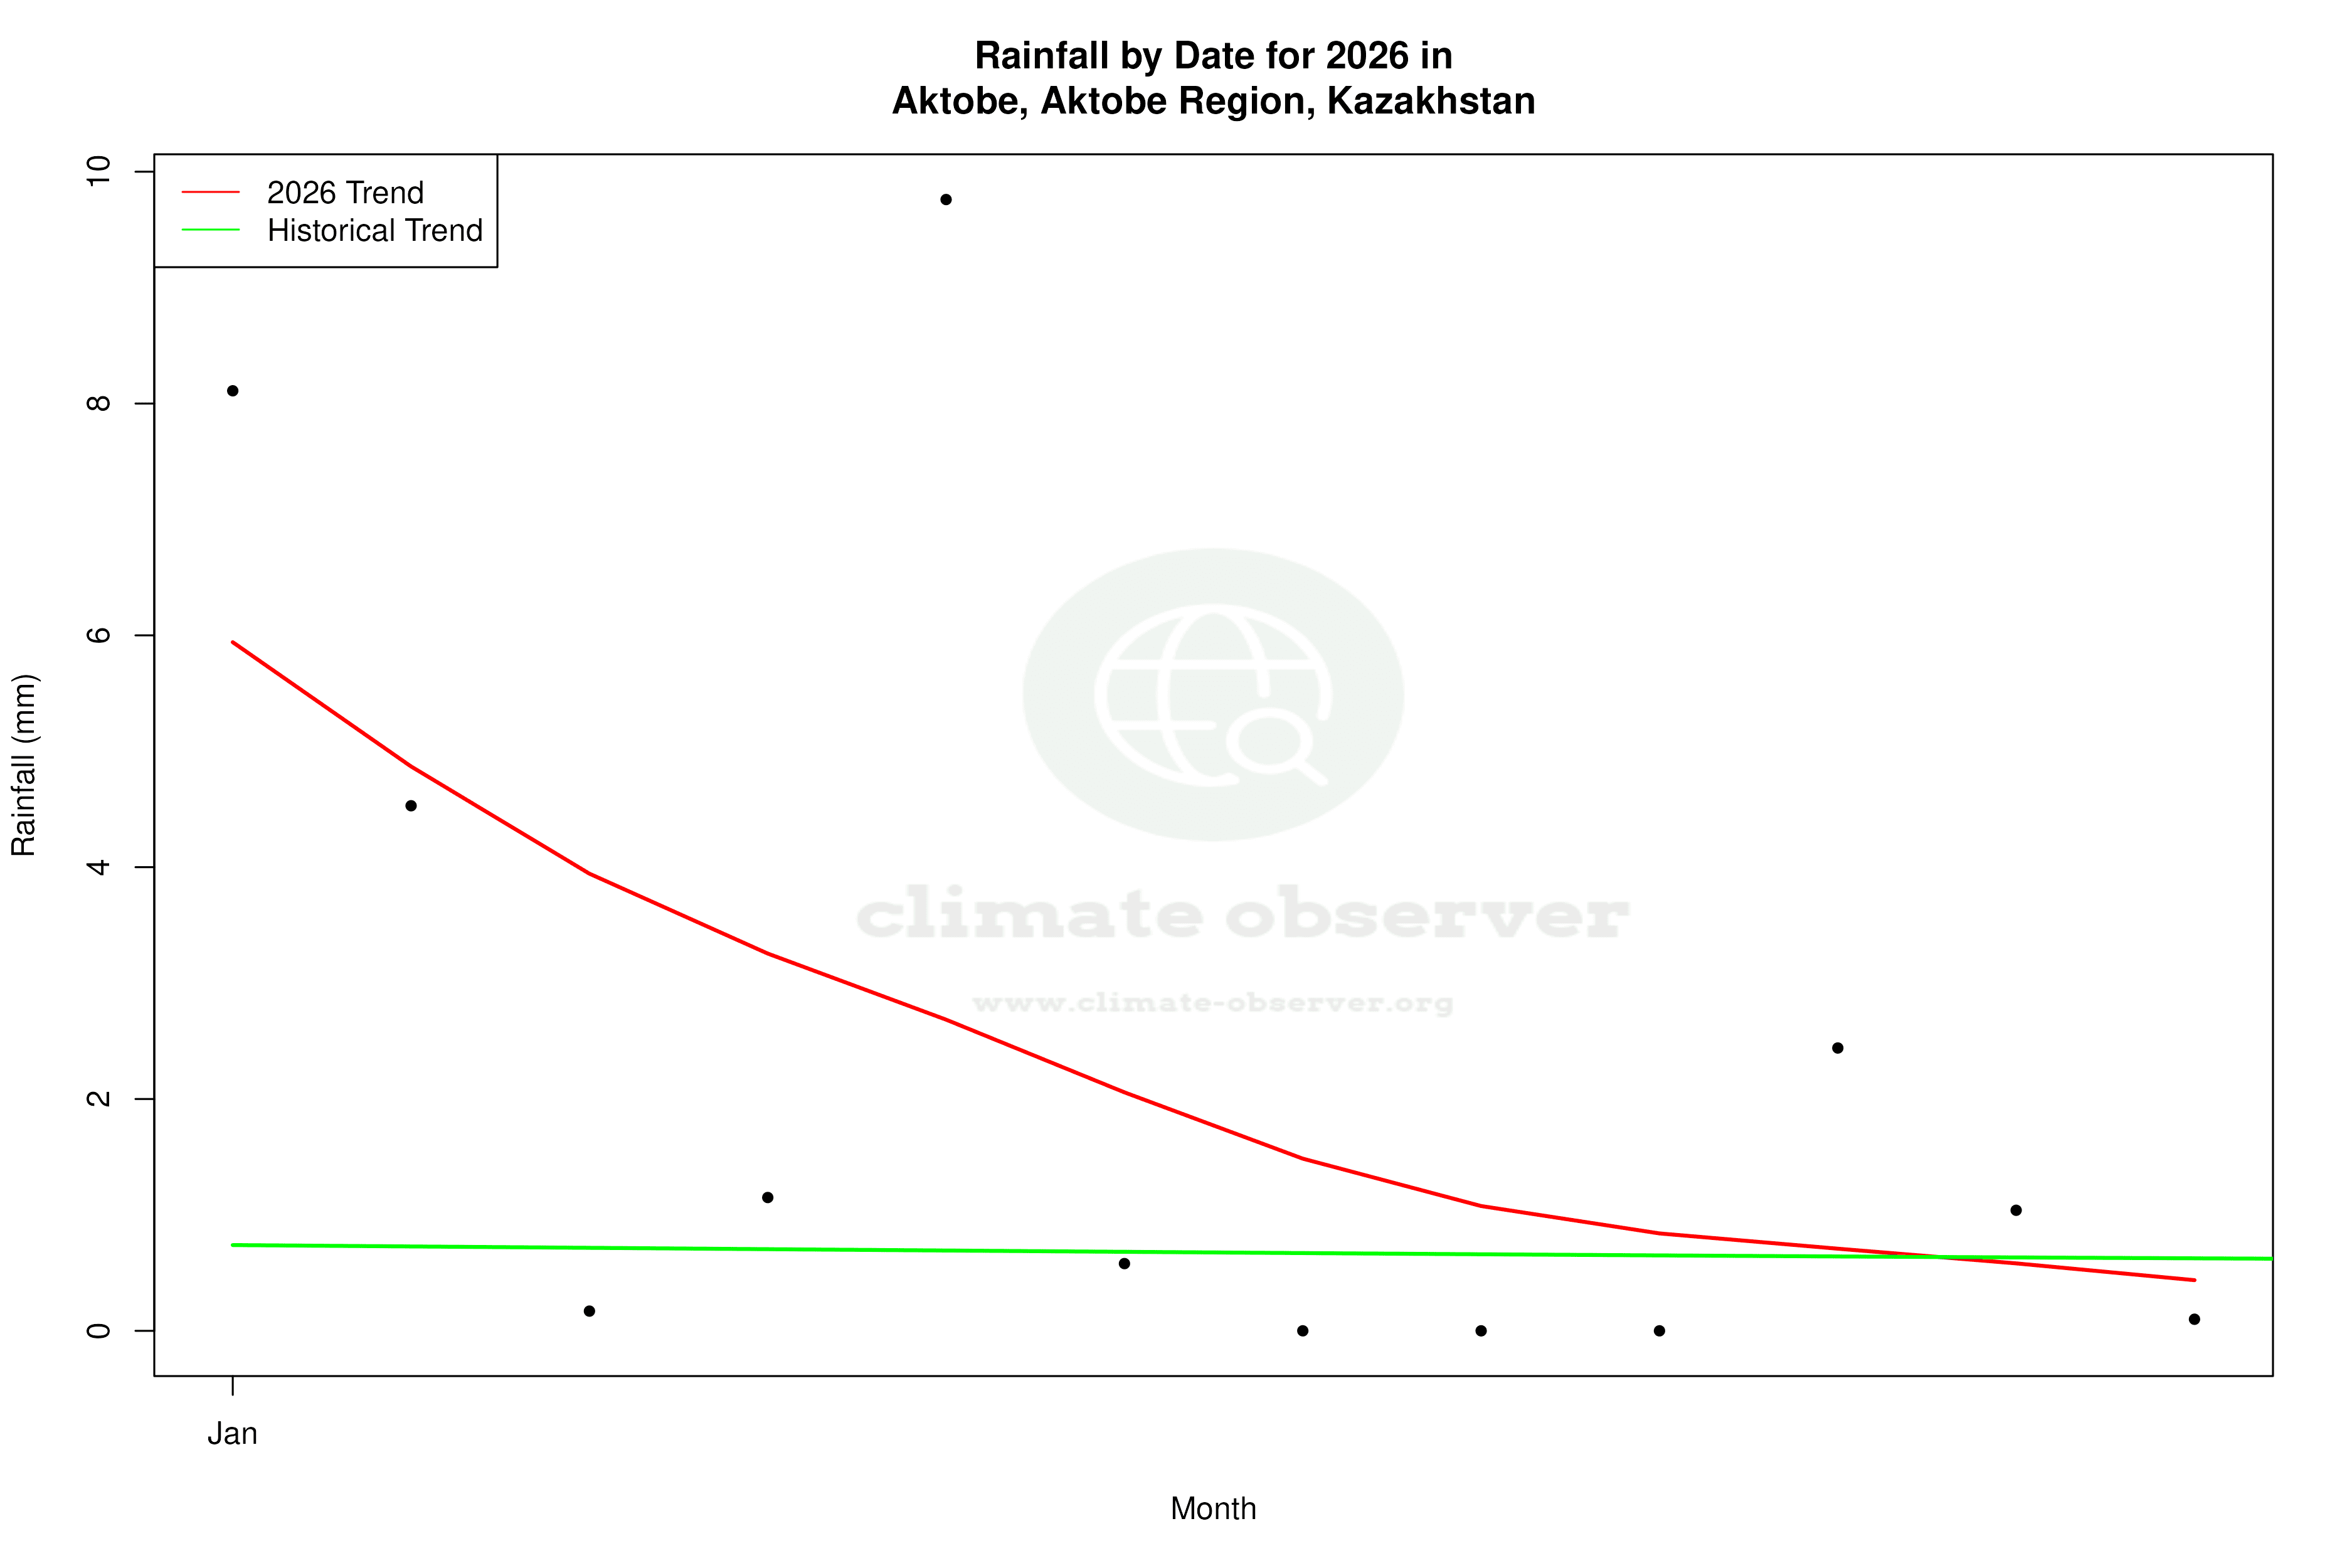
The Precipitation Concentration Index (PCI) for Aktobe has decreased from a baseline of 12.1 to a current value of 9.1, indicating a more even distribution of rainfall throughout the year. This shift suggests that precipitation events are becoming less concentrated and more evenly spread, which can be beneficial for agriculture and water management in the region. A PCI under 10 signifies a very even distribution, which could help mitigate some of the impacts of the warming trend by providing more consistent water availability.
Regional Climate Initiatives
Kazakhstan has been actively working towards regional climate goals, focusing on reducing greenhouse gas emissions and enhancing sustainable land use. These efforts may be contributing to the observed changes in Aktobe's climate patterns. The city's recent temperature increases and more evenly distributed precipitation could be early indicators of the effectiveness of such initiatives. However, continued monitoring and adaptation are crucial to manage the impacts of these climatic shifts effectively.
Implications for Aktobe's Future
Aktobe's evolving climate profile, marked by warming temperatures and changes in precipitation distribution, presents both challenges and opportunities. The ongoing warming trend requires adaptive strategies to manage heat-related risks, while the more evenly distributed rainfall could support agricultural resilience. Understanding these dynamics is essential for developing effective climate policies and ensuring sustainable development in the region.
Station Statistics
10-Year Trend
High: +1.74 °C/decade
Low: +1.84 °C/decade
Rain: +0.11 mm/decade
25-Year Trend
High: +0.48 °C/decade
Low: +0.33 °C/decade
Rain: +0.07 mm/decade
50-Year Trend
High: +0.53 °C/decade
Low: +0.34 °C/decade
Rain: +0.04 mm/decade
All-Time Trend
High: +0.27 °C/decade
Low: +0.25 °C/decade
Rain: +0.04 mm/decade
Percentage Above-Average Days
Last 12 Months: 60.0%
This Year: 44.9%
Precipitation Concentration Index (PCI) ℹ️
Last 12 Months: 12.7
Historical Average: 11.5
Percentile Rank of Last 12 Months ℹ️
High: 99th percentile
Low: 98th percentile
Rain: 76th percentile
Change in Variance ℹ️
High: -8.1%
Low: -13.1%
Intraday: +10.1%
Data Coverage
92.6%
First Year of Data
1904
Station Location
Historical Weather Records
| Max High | Avg High | Min High | Max Avg | Avg Avg | Min Avg | Max Low | Avg Low | Min Low | Max Precipitation | Avg Precipitation | Max Snow | Avg Snow | |
|---|---|---|---|---|---|---|---|---|---|---|---|---|---|
| Record | 42.9 °C | — | -36.9 °C | 34.3 °C | — | -42.2 °C | 26.4 °C | — | -48.5 °C | 84.0 mm | — | — | — |
| January | 4.5 °C | -9.7 °C | -36.9 °C | 2.4 °C | -14.0 °C | -42.2 °C | 0.7 °C | -18.5 °C | -48.5 °C | 20.1 mm | 0.6 mm | — | — |
| February | 5.5 °C | -8.7 °C | -29.0 °C | 2.7 °C | -13.6 °C | -35.1 °C | 1.0 °C | -18.5 °C | -45.0 °C | 18.7 mm | 0.6 mm | — | — |
| March | 23.6 °C | -1.7 °C | -22.5 °C | 13.8 °C | -6.5 °C | -27.9 °C | 9.0 °C | -11.1 °C | -37.0 °C | 26.5 mm | 0.6 mm | — | — |
| April | 30.9 °C | 12.7 °C | -9.8 °C | 21.5 °C | 6.5 °C | -14.4 °C | 16.0 °C | 0.7 °C | -19.0 °C | 29.9 mm | 0.8 mm | — | — |
| May | 39.0 °C | 22.4 °C | 0.2 °C | 30.2 °C | 15.4 °C | -1.9 °C | 24.0 °C | 7.9 °C | -7.6 °C | 32.5 mm | 0.9 mm | — | — |
| June | 40.3 °C | 27.5 °C | 7.9 °C | 32.3 °C | 20.6 °C | 5.3 °C | 24.1 °C | 12.9 °C | -0.9 °C | 40.0 mm | 1.0 mm | — | — |
| July | 42.3 °C | 29.7 °C | 15.0 °C | 34.3 °C | 22.9 °C | 11.1 °C | 26.4 °C | 15.4 °C | 4.1 °C | 48.6 mm | 1.0 mm | — | — |
| August | 42.9 °C | 28.1 °C | 9.0 °C | 33.8 °C | 20.7 °C | 6.8 °C | 25.0 °C | 13.4 °C | 0.7 °C | 41.0 mm | 0.8 mm | — | — |
| September | 39.0 °C | 21.1 °C | 2.8 °C | 28.4 °C | 13.7 °C | 0.2 °C | 21.1 °C | 7.1 °C | -7.9 °C | 36.3 mm | 0.7 mm | — | — |
| October | 40.8 °C | 10.9 °C | -9.6 °C | 19.9 °C | 4.8 °C | -19.5 °C | 14.6 °C | -0.1 °C | -22.8 °C | 28.0 mm | 0.9 mm | — | — |
| November | 17.0 °C | 0.5 °C | -24.3 °C | 12.4 °C | -3.5 °C | -27.7 °C | 9.0 °C | -7.3 °C | -35.0 °C | 45.9 mm | 0.8 mm | — | — |
| December | 13.0 °C | -6.7 °C | -32.1 °C | 4.6 °C | -10.6 °C | -33.9 °C | 2.0 °C | -14.6 °C | -41.5 °C | 84.0 mm | 0.8 mm | — | — |
Data Visualisations
Remove WatermarksCurrent Year Climate Trends vs Historical
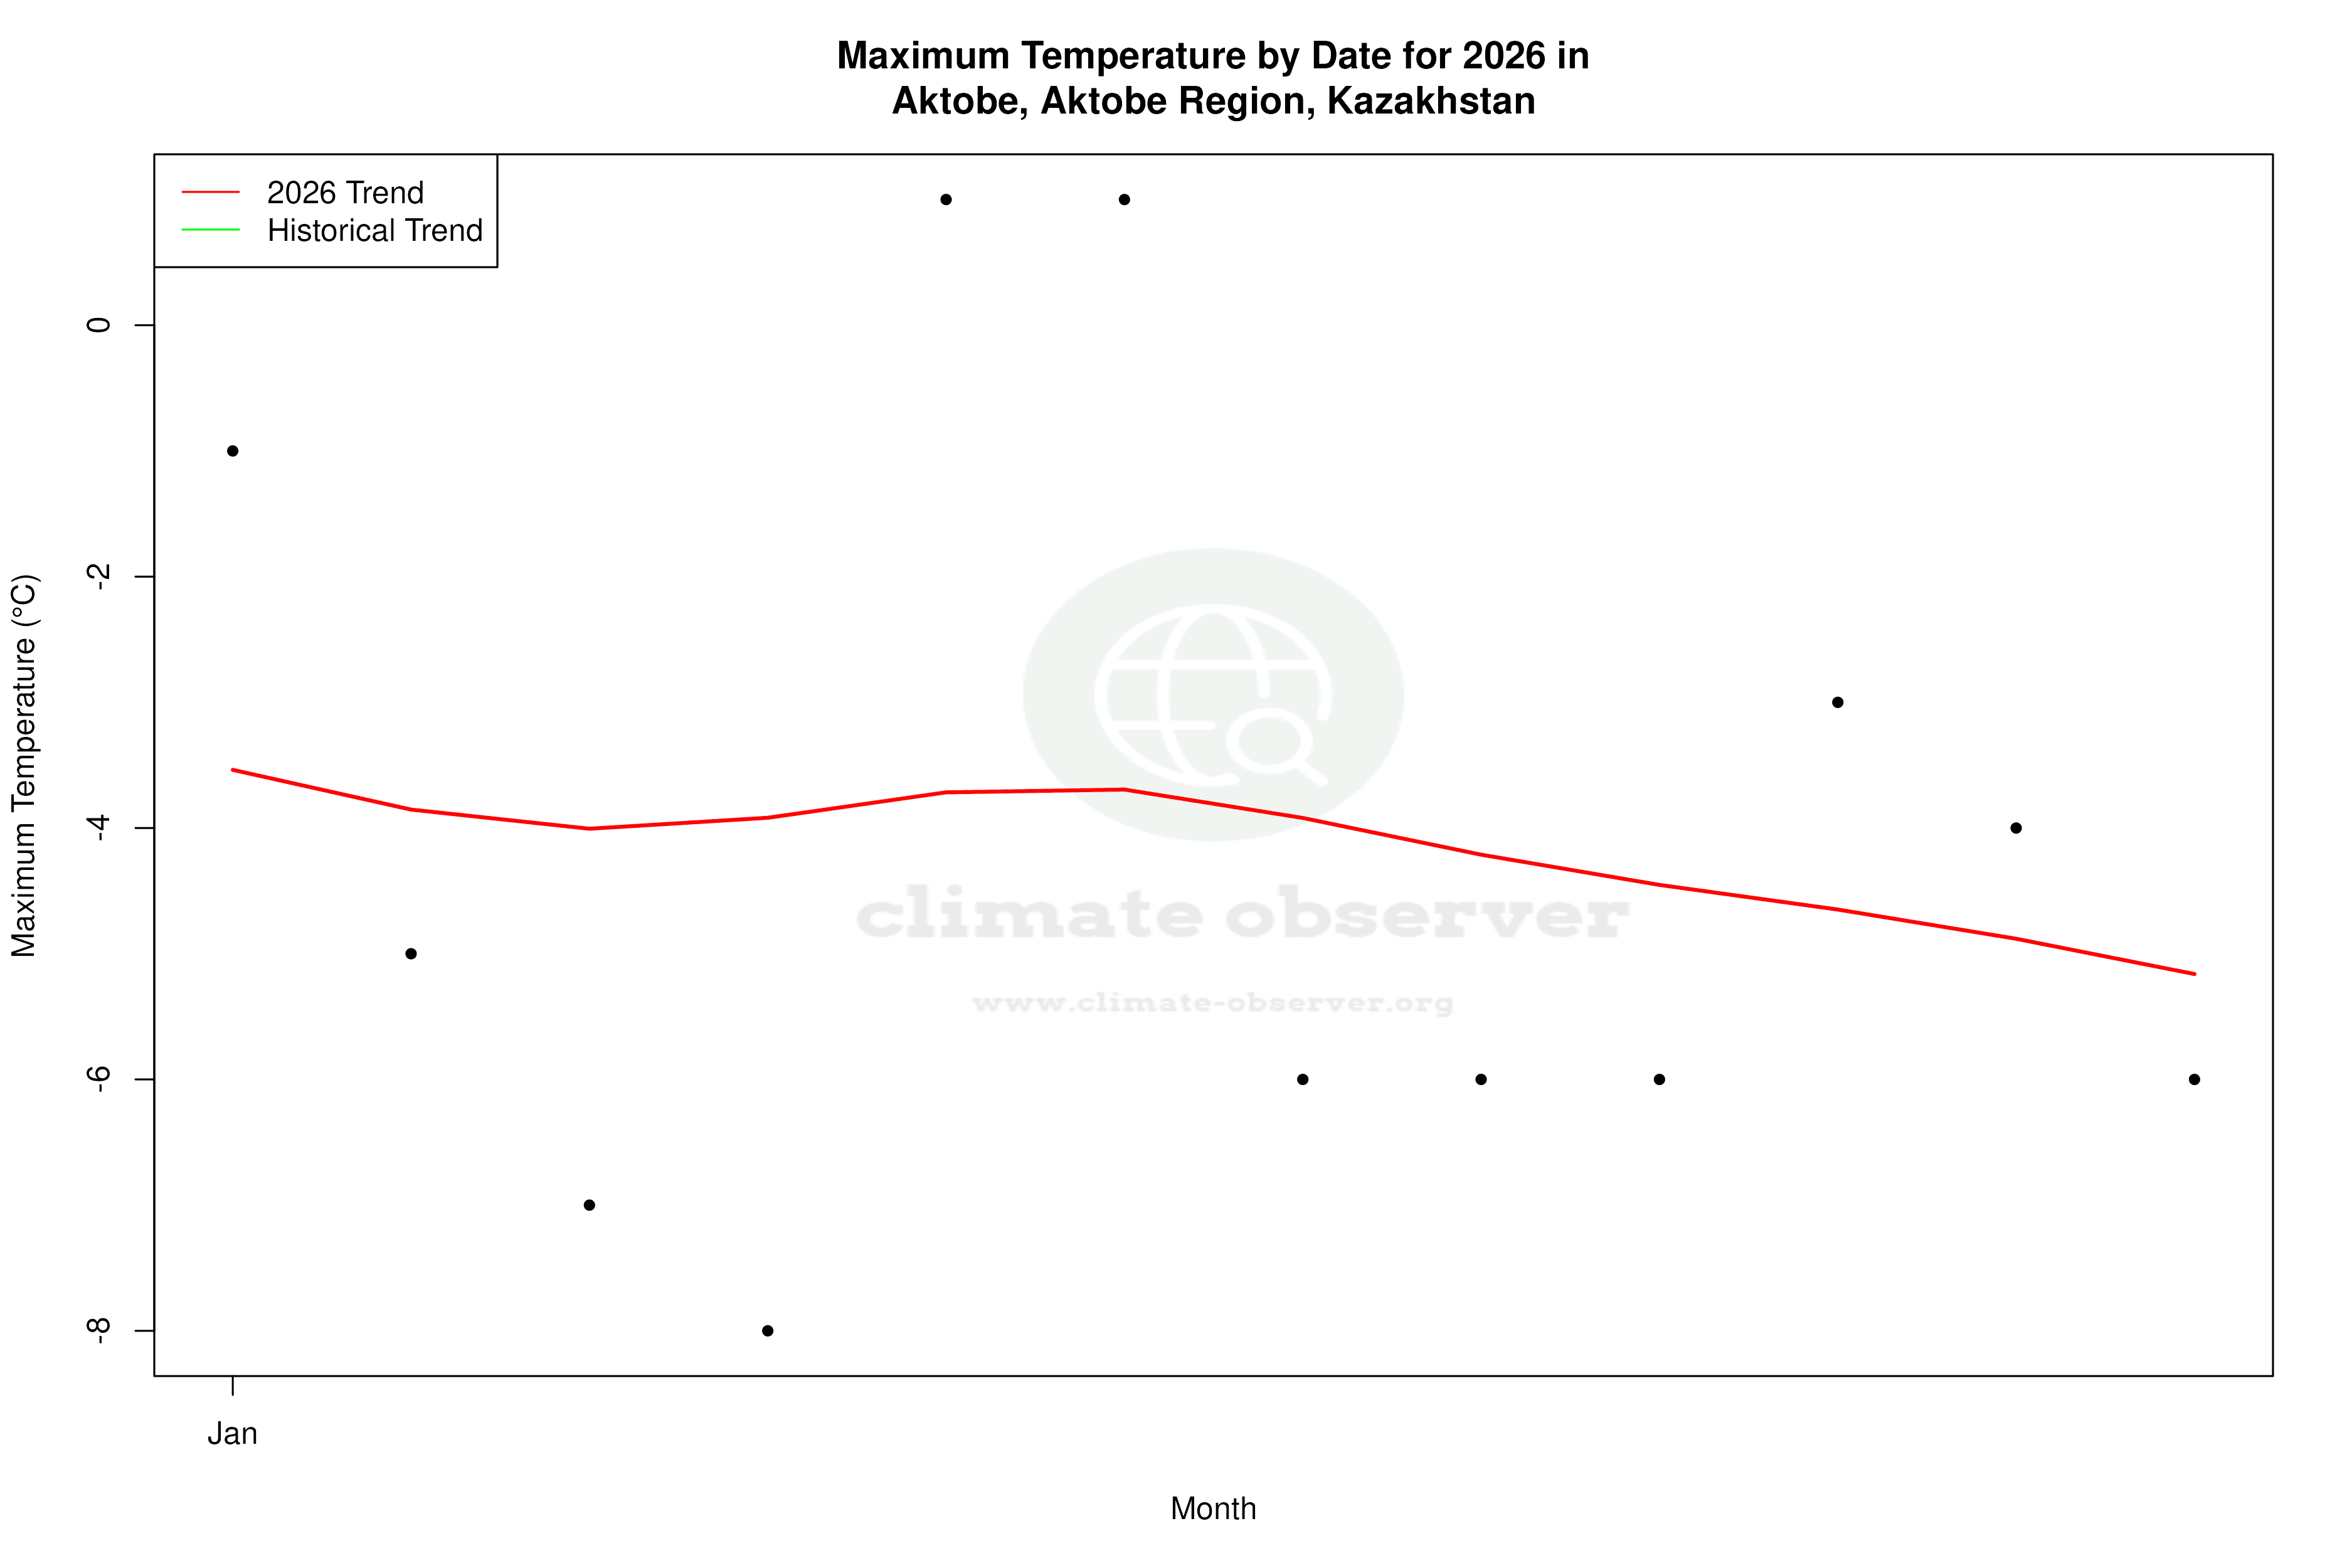


Max Temperature this Year | 1 of 6
Climate 12-Month Moving Averages


Max Temperature 12-Month MA | 1 of 6
Daily Data Points and Averages Throughout the Year


Average Max Temperature Throughout Year | 1 of 5
