Climate for Station: Taipak, West Kazakhstan Region, Kazakhstan
Loading live weather...
Climate Analysis & Overview
Taipak is experiencing noticeable warming trends, particularly in its nighttime temperatures, with a significant rise over the past decade. Precipitation patterns have become more evenly distributed, suggesting a shift in local climate dynamics.
Warming Nights in Taipak
Located in the western region of Kazakhstan, Taipak falls under the Köppen climate classification of Dfa, indicating a humid continental climate with hot summers and cold winters. The local geography, characterised by flat plains and proximity to the Ural River, influences its climate patterns. Over the past decade, Taipak has experienced a substantial warming trend in its nighttime temperatures, with lows rising by 2.72°C (4.90°F). This increase is more pronounced than the all-time trend, which shows a rise of 0.45°C (0.81°F). Such changes can impact local agriculture and energy demand, aligning with Kazakhstan's regional climate goals to adapt to changing weather patterns.
Daytime Temperature Trends
While the nighttime temperatures have shown a significant increase, the daytime highs have also risen, albeit at a slower pace. Over the last ten years, the highs have increased by 0.79°C (1.42°F). In contrast, the all-time trend for daytime highs indicates a more modest warming of 0.34°C (0.61°F). These trends suggest a consistent warming pattern, which could influence the frequency and intensity of heatwaves in the region. Taipak's record high of 46.0°C (114.8°F) underscores the potential for extreme heat events.
Precipitation Patterns: A Shift Towards Even Distribution
The Precipitation Concentration Index (PCI) for Taipak has decreased from a baseline of 12.51 to a current value of 9.59. This change indicates that precipitation is now more evenly distributed throughout the year, reducing the concentration of rainfall in fewer, intense events. Such a shift can mitigate the risk of flooding and soil erosion, contributing to more stable agricultural conditions. This trend aligns with broader regional efforts to manage water resources effectively.
Historical Extremes and Future Implications
Taipak's climatic history is marked by extremes, with a record low temperature of -40.9°C (-41.6°F). While these extremes are part of the historical climate variability, the recent warming trends suggest a potential decrease in the frequency of such low-temperature events. As Kazakhstan continues to address climate change, understanding these localised trends is crucial for developing adaptive strategies.
Regional Climate Goals and Local Impact
Kazakhstan's commitment to reducing greenhouse gas emissions and enhancing climate resilience is reflected in the observed trends in Taipak. The warming temperatures, particularly at night, and the more evenly distributed precipitation patterns provide valuable insights into the region's changing climate. These changes necessitate adaptive measures in agriculture, infrastructure, and resource management to ensure sustainable development in the face of a warming climate.
Station Statistics
10-Year Trend
High: -1.59 °F/decade
Low: +2.64 °F/decade
Rain: -0.003 in/decade
25-Year Trend
High: +0.30 °F/decade
Low: +0.49 °F/decade
Rain: +0.003 in/decade
50-Year Trend
High: +0.75 °F/decade
Low: +0.44 °F/decade
Rain: +0.002 in/decade
All-Time Trend
High: +0.57 °F/decade
Low: +0.77 °F/decade
Rain: +0.001 in/decade
Percentage Above-Average Days
Last 12 Months: 57.3%
This Year: 57.5%
Precipitation Concentration Index (PCI) ℹ️
Last 12 Months: 10.5
Historical Average: 12.5
Percentile Rank of Last 12 Months ℹ️
High: 33rd percentile
Low: 82nd percentile
Rain: 75th percentile
Change in Variance ℹ️
High: -7.9%
Low: -12.8%
Intraday: -1.4%
Data Coverage
92.9%
First Year of Data
1924
Station Location
Historical Weather Records
| Max High | Avg High | Min High | Max Avg | Avg Avg | Min Avg | Max Low | Avg Low | Min Low | Max Precipitation | Avg Precipitation | Max Snow | Avg Snow | |
|---|---|---|---|---|---|---|---|---|---|---|---|---|---|
| Record | 114.80 °F | — | -25.96 °F | 96.26 °F | — | -32.08 °F | 84.02 °F | — | -41.62 °F | 3.00 in | — | — | — |
| January | 50.72 °F | 19.63 °F | -25.96 °F | 43.34 °F | 12.35 °F | -32.08 °F | 35.60 °F | 5.34 °F | -41.62 °F | 0.65 in | 0.02 in | — | — |
| February | 57.74 °F | 21.57 °F | -17.50 °F | 44.60 °F | 13.35 °F | -30.82 °F | 38.12 °F | 5.81 °F | -40.54 °F | 0.73 in | 0.02 in | — | — |
| March | 75.74 °F | 35.67 °F | -4.00 °F | 62.51 °F | 26.91 °F | -15.70 °F | 52.90 °F | 19.36 °F | -30.82 °F | 1.36 in | 0.02 in | — | — |
| April | 92.84 °F | 61.21 °F | 24.80 °F | 77.36 °F | 49.31 °F | 11.12 °F | 65.48 °F | 38.70 °F | -2.74 °F | 1.08 in | 0.02 in | — | — |
| May | 105.98 °F | 76.62 °F | 42.08 °F | 87.80 °F | 64.12 °F | 36.86 °F | 77.00 °F | 51.68 °F | 25.16 °F | 2.15 in | 0.02 in | — | — |
| June | 110.48 °F | 86.47 °F | 53.06 °F | 94.28 °F | 73.84 °F | 44.78 °F | 82.76 °F | 61.23 °F | 34.52 °F | 2.36 in | 0.03 in | — | — |
| July | 114.80 °F | 90.65 °F | 63.14 °F | 96.26 °F | 78.12 °F | 55.76 °F | 84.02 °F | 65.47 °F | 45.14 °F | 1.06 in | 0.02 in | — | — |
| August | 111.92 °F | 87.73 °F | 57.92 °F | 96.26 °F | 74.73 °F | 49.28 °F | 82.40 °F | 61.94 °F | 37.94 °F | 3.00 in | 0.02 in | — | — |
| September | 107.42 °F | 74.64 °F | 37.40 °F | 87.26 °F | 61.43 °F | 34.34 °F | 74.30 °F | 49.61 °F | 22.10 °F | 1.12 in | 0.02 in | — | — |
| October | 89.96 °F | 56.32 °F | 23.18 °F | 70.70 °F | 45.22 °F | 16.70 °F | 55.94 °F | 36.16 °F | 5.90 °F | 1.21 in | 0.03 in | — | — |
| November | 70.70 °F | 38.22 °F | -4.36 °F | 56.66 °F | 30.67 °F | -14.44 °F | 52.70 °F | 24.45 °F | -24.88 °F | 0.99 in | 0.02 in | — | — |
| December | 51.26 °F | 25.30 °F | -15.52 °F | 44.24 °F | 18.76 °F | -26.86 °F | 39.92 °F | 12.80 °F | -37.66 °F | 0.68 in | 0.02 in | — | — |
Data Visualisations
Remove WatermarksCurrent Year Climate Trends vs Historical


Max Temperature this Year | 1 of 6
Climate 12-Month Moving Averages


Max Temperature 12-Month MA | 1 of 6
Daily Data Points and Averages Throughout the Year


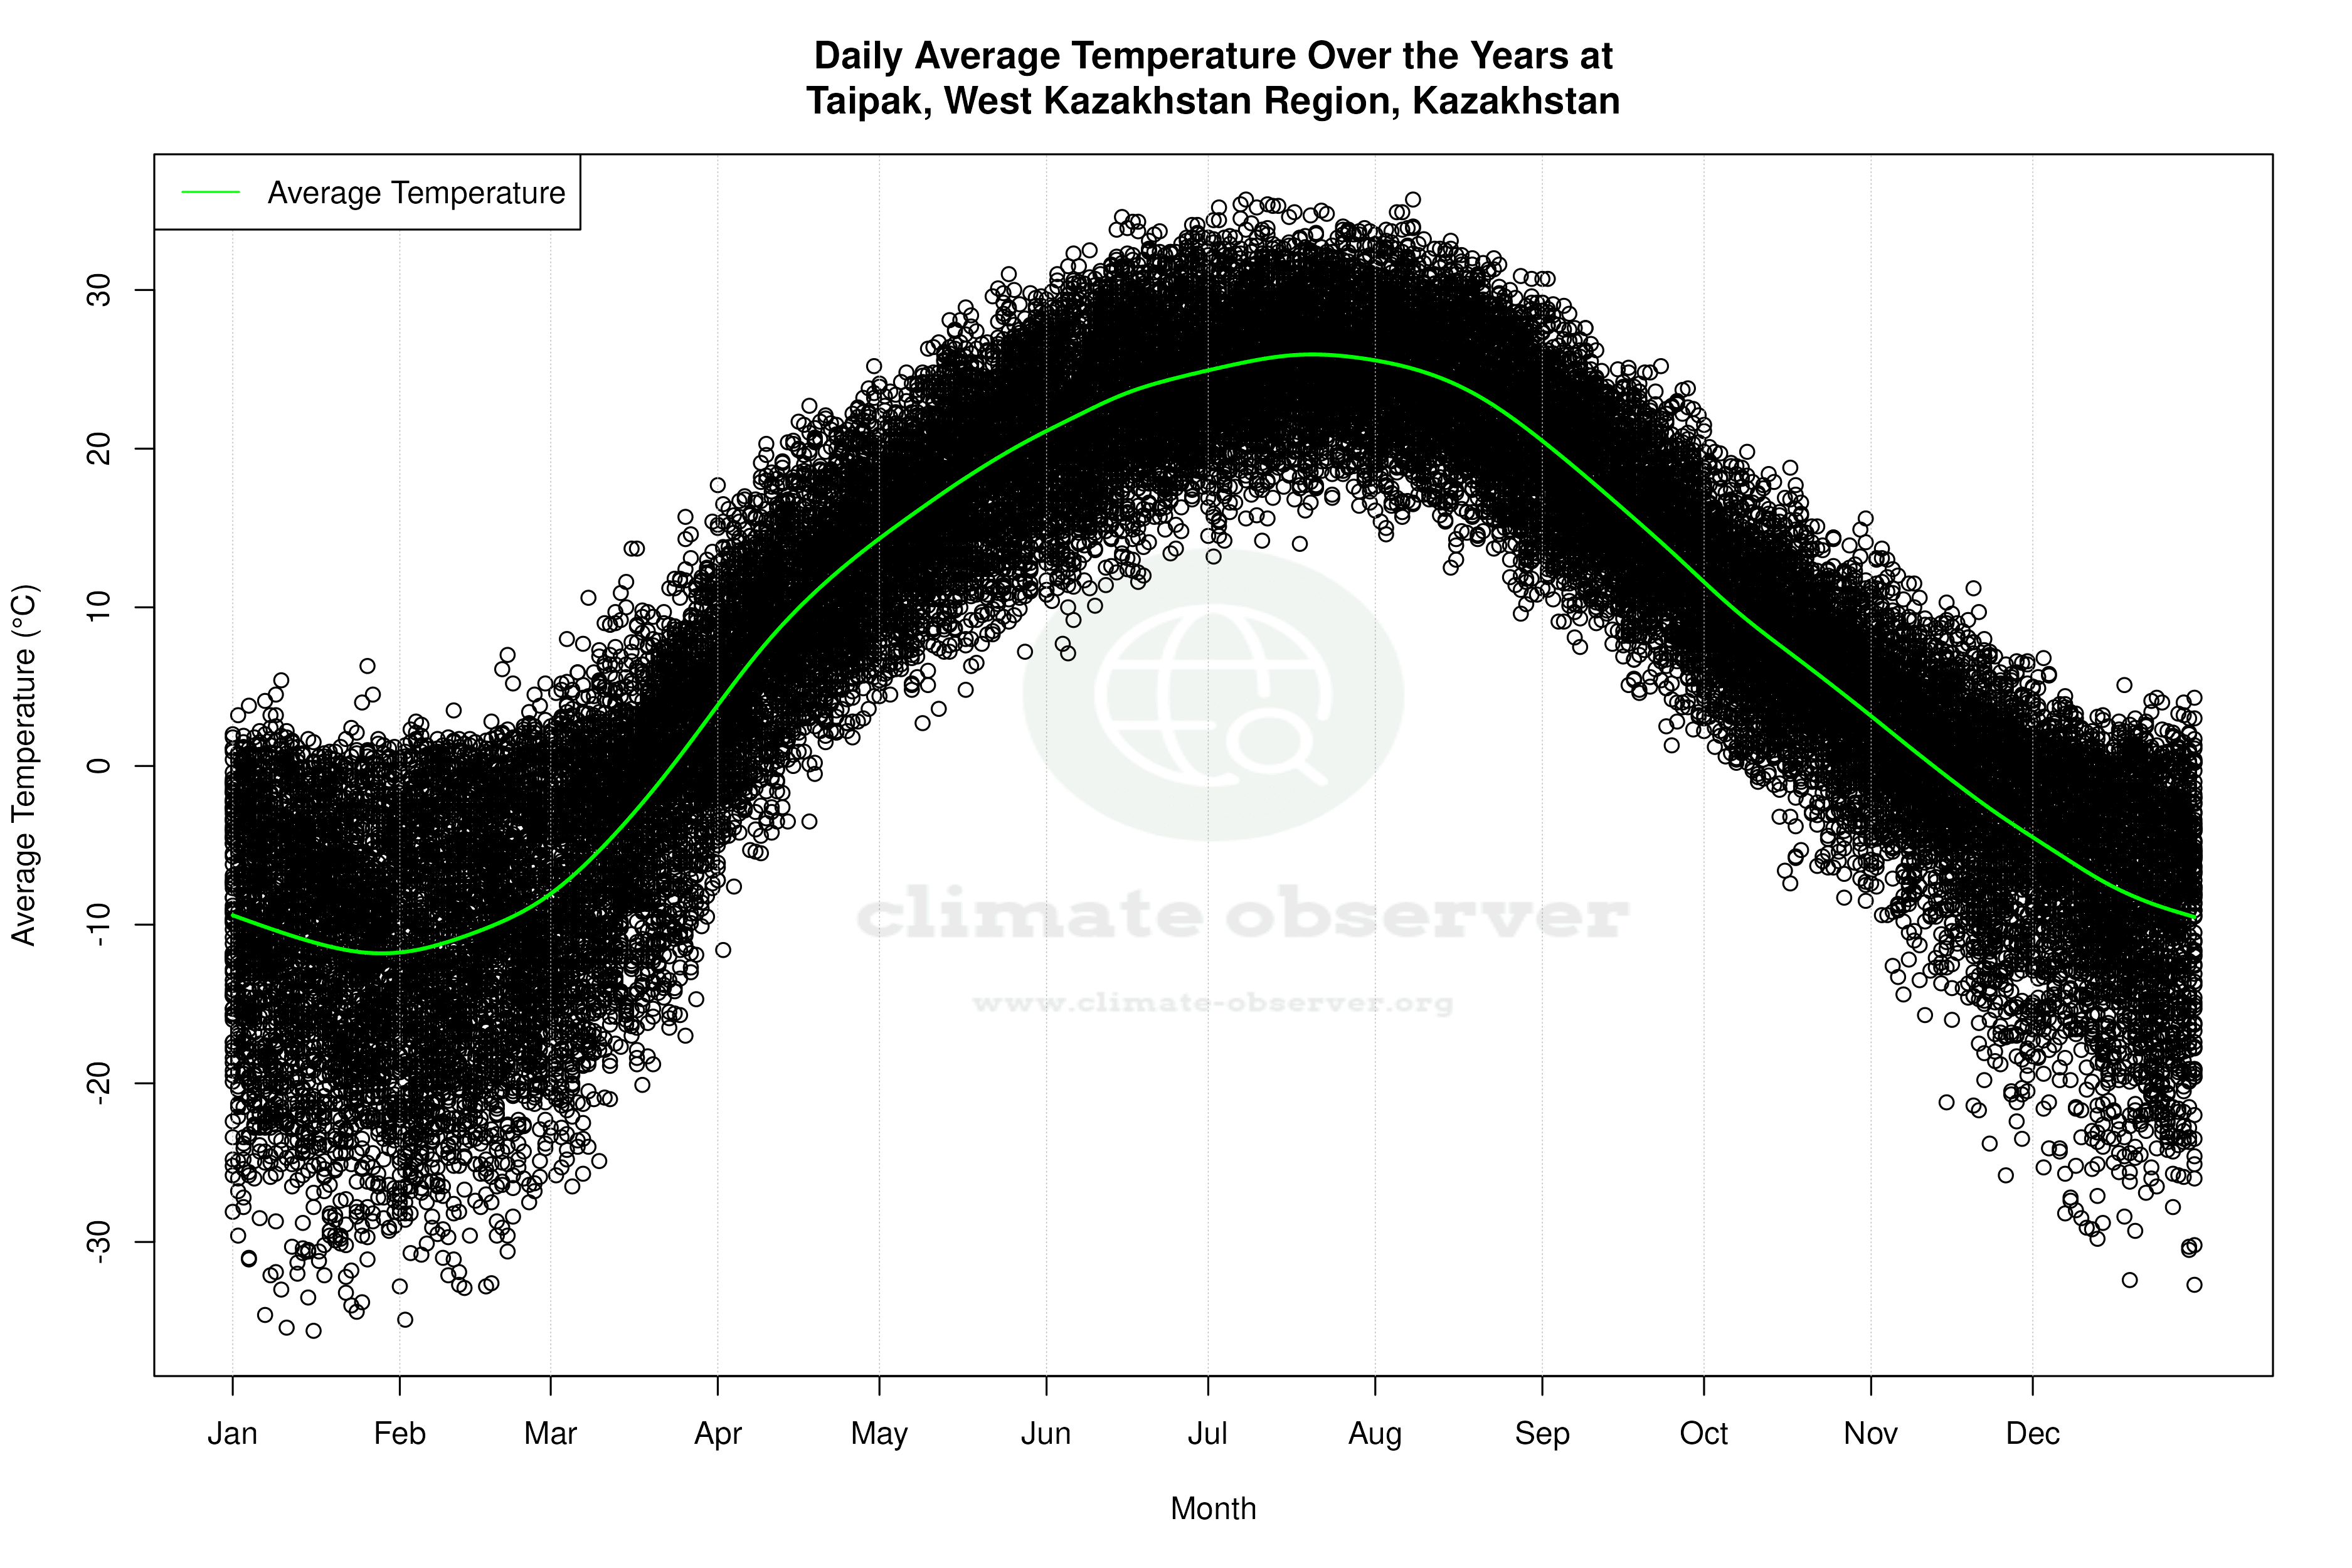


Average Max Temperature Throughout Year | 1 of 5
