Climate for Station: Atyrau, Atyrau Region, Kazakhstan
Loading live weather...
Climate Analysis & Overview
Atyrau's climate is experiencing a notable warming trend, with both highs and lows increasing over the past decade. The region's precipitation has become more evenly distributed, reflecting changes in the local climate dynamics. These shifts align with Kazakhstan's broader climate objectives, focusing on adaptation and resilience.
Atyrau's Climatic Context
Atyrau, located at 47.1167°N, 51.9167°E, is positioned in the western part of Kazakhstan, near the Caspian Sea. It falls under the Köppen climate classification BSk, which denotes a cold semi-arid climate. The proximity to the Caspian Sea influences its weather patterns, moderating temperatures slightly compared to more inland areas. This geographical setting contributes to the unique climatic characteristics observed in the region.
Warming Trends Over Time
The all-time temperature trends for Atyrau reveal a gradual warming. Highs have increased by 0.32°C (0.58°F), while lows have risen by 0.33°C (0.59°F). This warming is more pronounced over the past decade, with highs rising by 1.03°C (1.85°F) and lows by 1.52°C (2.73°F). These trends indicate a significant shift towards warmer conditions, which could impact local ecosystems and human activities.
Precipitation Patterns and PCI
The Precipitation Concentration Index (PCI) provides insight into how rainfall is distributed throughout the year. Atyrau's PCI has decreased from a baseline of 14.05 to a current value of 10.88. This reduction signifies a more even distribution of precipitation events, suggesting a shift away from concentrated heavy rainfalls towards more consistent, moderate precipitation. This change can be beneficial for agriculture and water resource management in the region.
Temperature Extremes
Atyrau has recorded extreme temperatures, with a maximum of 50.0°C (122.0°F) and a minimum of -37.9°C (-36.2°F). These records highlight the region's potential for significant temperature variability. Such extremes can pose challenges for infrastructure, health, and agriculture, necessitating adaptive measures to mitigate adverse impacts.
Regional Climate Goals
Kazakhstan is committed to addressing climate change through national strategies that focus on reducing greenhouse gas emissions and enhancing climate resilience. Atyrau's warming trends and changing precipitation patterns underscore the importance of these initiatives. By understanding and adapting to these climatic changes, Atyrau can contribute to the nation's broader efforts to achieve sustainable development in the face of global climate challenges.
Station Statistics
10-Year Trend
High: +1.47 °C/decade
Low: +1.19 °C/decade
Rain: -0.12 mm/decade
25-Year Trend
High: +0.68 °C/decade
Low: +0.62 °C/decade
Rain: +0.05 mm/decade
50-Year Trend
High: +0.48 °C/decade
Low: +0.57 °C/decade
Rain: +0.05 mm/decade
All-Time Trend
High: +0.32 °C/decade
Low: +0.33 °C/decade
Rain: +0.01 mm/decade
Percentage Above-Average Days
Last 12 Months: 57.8%
This Year: 44.7%
Precipitation Concentration Index (PCI) ℹ️
Last 12 Months: 9.7
Historical Average: 14.7
Percentile Rank of Last 12 Months ℹ️
High: 96th percentile
Low: 98th percentile
Rain: 60th percentile
Change in Variance ℹ️
High: -5.7%
Low: -14.7%
Intraday: -9.0%
Data Coverage
89.0%
First Year of Data
1881
Station Location
Historical Weather Records
| Max High | Avg High | Min High | Max Avg | Avg Avg | Min Avg | Max Low | Avg Low | Min Low | Max Precipitation | Avg Precipitation | Max Snow | Avg Snow | |
|---|---|---|---|---|---|---|---|---|---|---|---|---|---|
| Record | 50.0 °C | — | -28.0 °C | 36.4 °C | — | -33.3 °C | 31.0 °C | — | -37.9 °C | 86.8 mm | — | — | — |
| January | 13.9 °C | -4.4 °C | -28.0 °C | 5.8 °C | -8.7 °C | -32.8 °C | 3.4 °C | -12.1 °C | -37.9 °C | 29.7 mm | 0.4 mm | — | — |
| February | 15.0 °C | -3.3 °C | -25.0 °C | 9.2 °C | -7.8 °C | -32.1 °C | 4.6 °C | -11.7 °C | -37.4 °C | 15.4 mm | 0.4 mm | — | — |
| March | 26.3 °C | 4.6 °C | -18.2 °C | 18.3 °C | -0.6 °C | -26.0 °C | 13.0 °C | -4.8 °C | -32.3 °C | 19.3 mm | 0.4 mm | — | — |
| April | 34.5 °C | 16.6 °C | -1.5 °C | 27.7 °C | 10.3 °C | -6.1 °C | 21.0 °C | 4.8 °C | -12.3 °C | 30.4 mm | 0.5 mm | — | — |
| May | 38.9 °C | 24.9 °C | 9.7 °C | 32.0 °C | 18.8 °C | 4.8 °C | 25.5 °C | 12.4 °C | -2.3 °C | 30.9 mm | 0.6 mm | — | — |
| June | 42.8 °C | 30.2 °C | 10.4 °C | 36.2 °C | 24.0 °C | 7.5 °C | 29.1 °C | 17.4 °C | 2.3 °C | 38.3 mm | 0.6 mm | — | — |
| July | 50.0 °C | 32.7 °C | 17.0 °C | 36.4 °C | 26.4 °C | 15.3 °C | 31.0 °C | 19.7 °C | 8.1 °C | 86.8 mm | 0.5 mm | — | — |
| August | 44.6 °C | 31.1 °C | 16.0 °C | 36.3 °C | 24.4 °C | 11.6 °C | 29.7 °C | 17.7 °C | 4.8 °C | 45.0 mm | 0.4 mm | — | — |
| September | 40.1 °C | 24.0 °C | 6.4 °C | 32.0 °C | 17.2 °C | 1.6 °C | 26.5 °C | 11.2 °C | -5.7 °C | 47.0 mm | 0.4 mm | — | — |
| October | 29.6 °C | 14.3 °C | -4.1 °C | 22.3 °C | 8.7 °C | -9.2 °C | 17.4 °C | 3.7 °C | -15.7 °C | 28.0 mm | 0.5 mm | — | — |
| November | 20.0 °C | 5.1 °C | -18.6 °C | 15.2 °C | 0.7 °C | -23.4 °C | 12.1 °C | -2.9 °C | -29.8 °C | 23.7 mm | 0.5 mm | — | — |
| December | 11.9 °C | -1.6 °C | -26.7 °C | 8.5 °C | -5.1 °C | -33.3 °C | 5.7 °C | -8.4 °C | -35.8 °C | 18.2 mm | 0.5 mm | — | — |
Data Visualisations
Remove WatermarksCurrent Year Climate Trends vs Historical


Max Temperature this Year | 1 of 6
Climate 12-Month Moving Averages


Max Temperature 12-Month MA | 1 of 6
Daily Data Points and Averages Throughout the Year


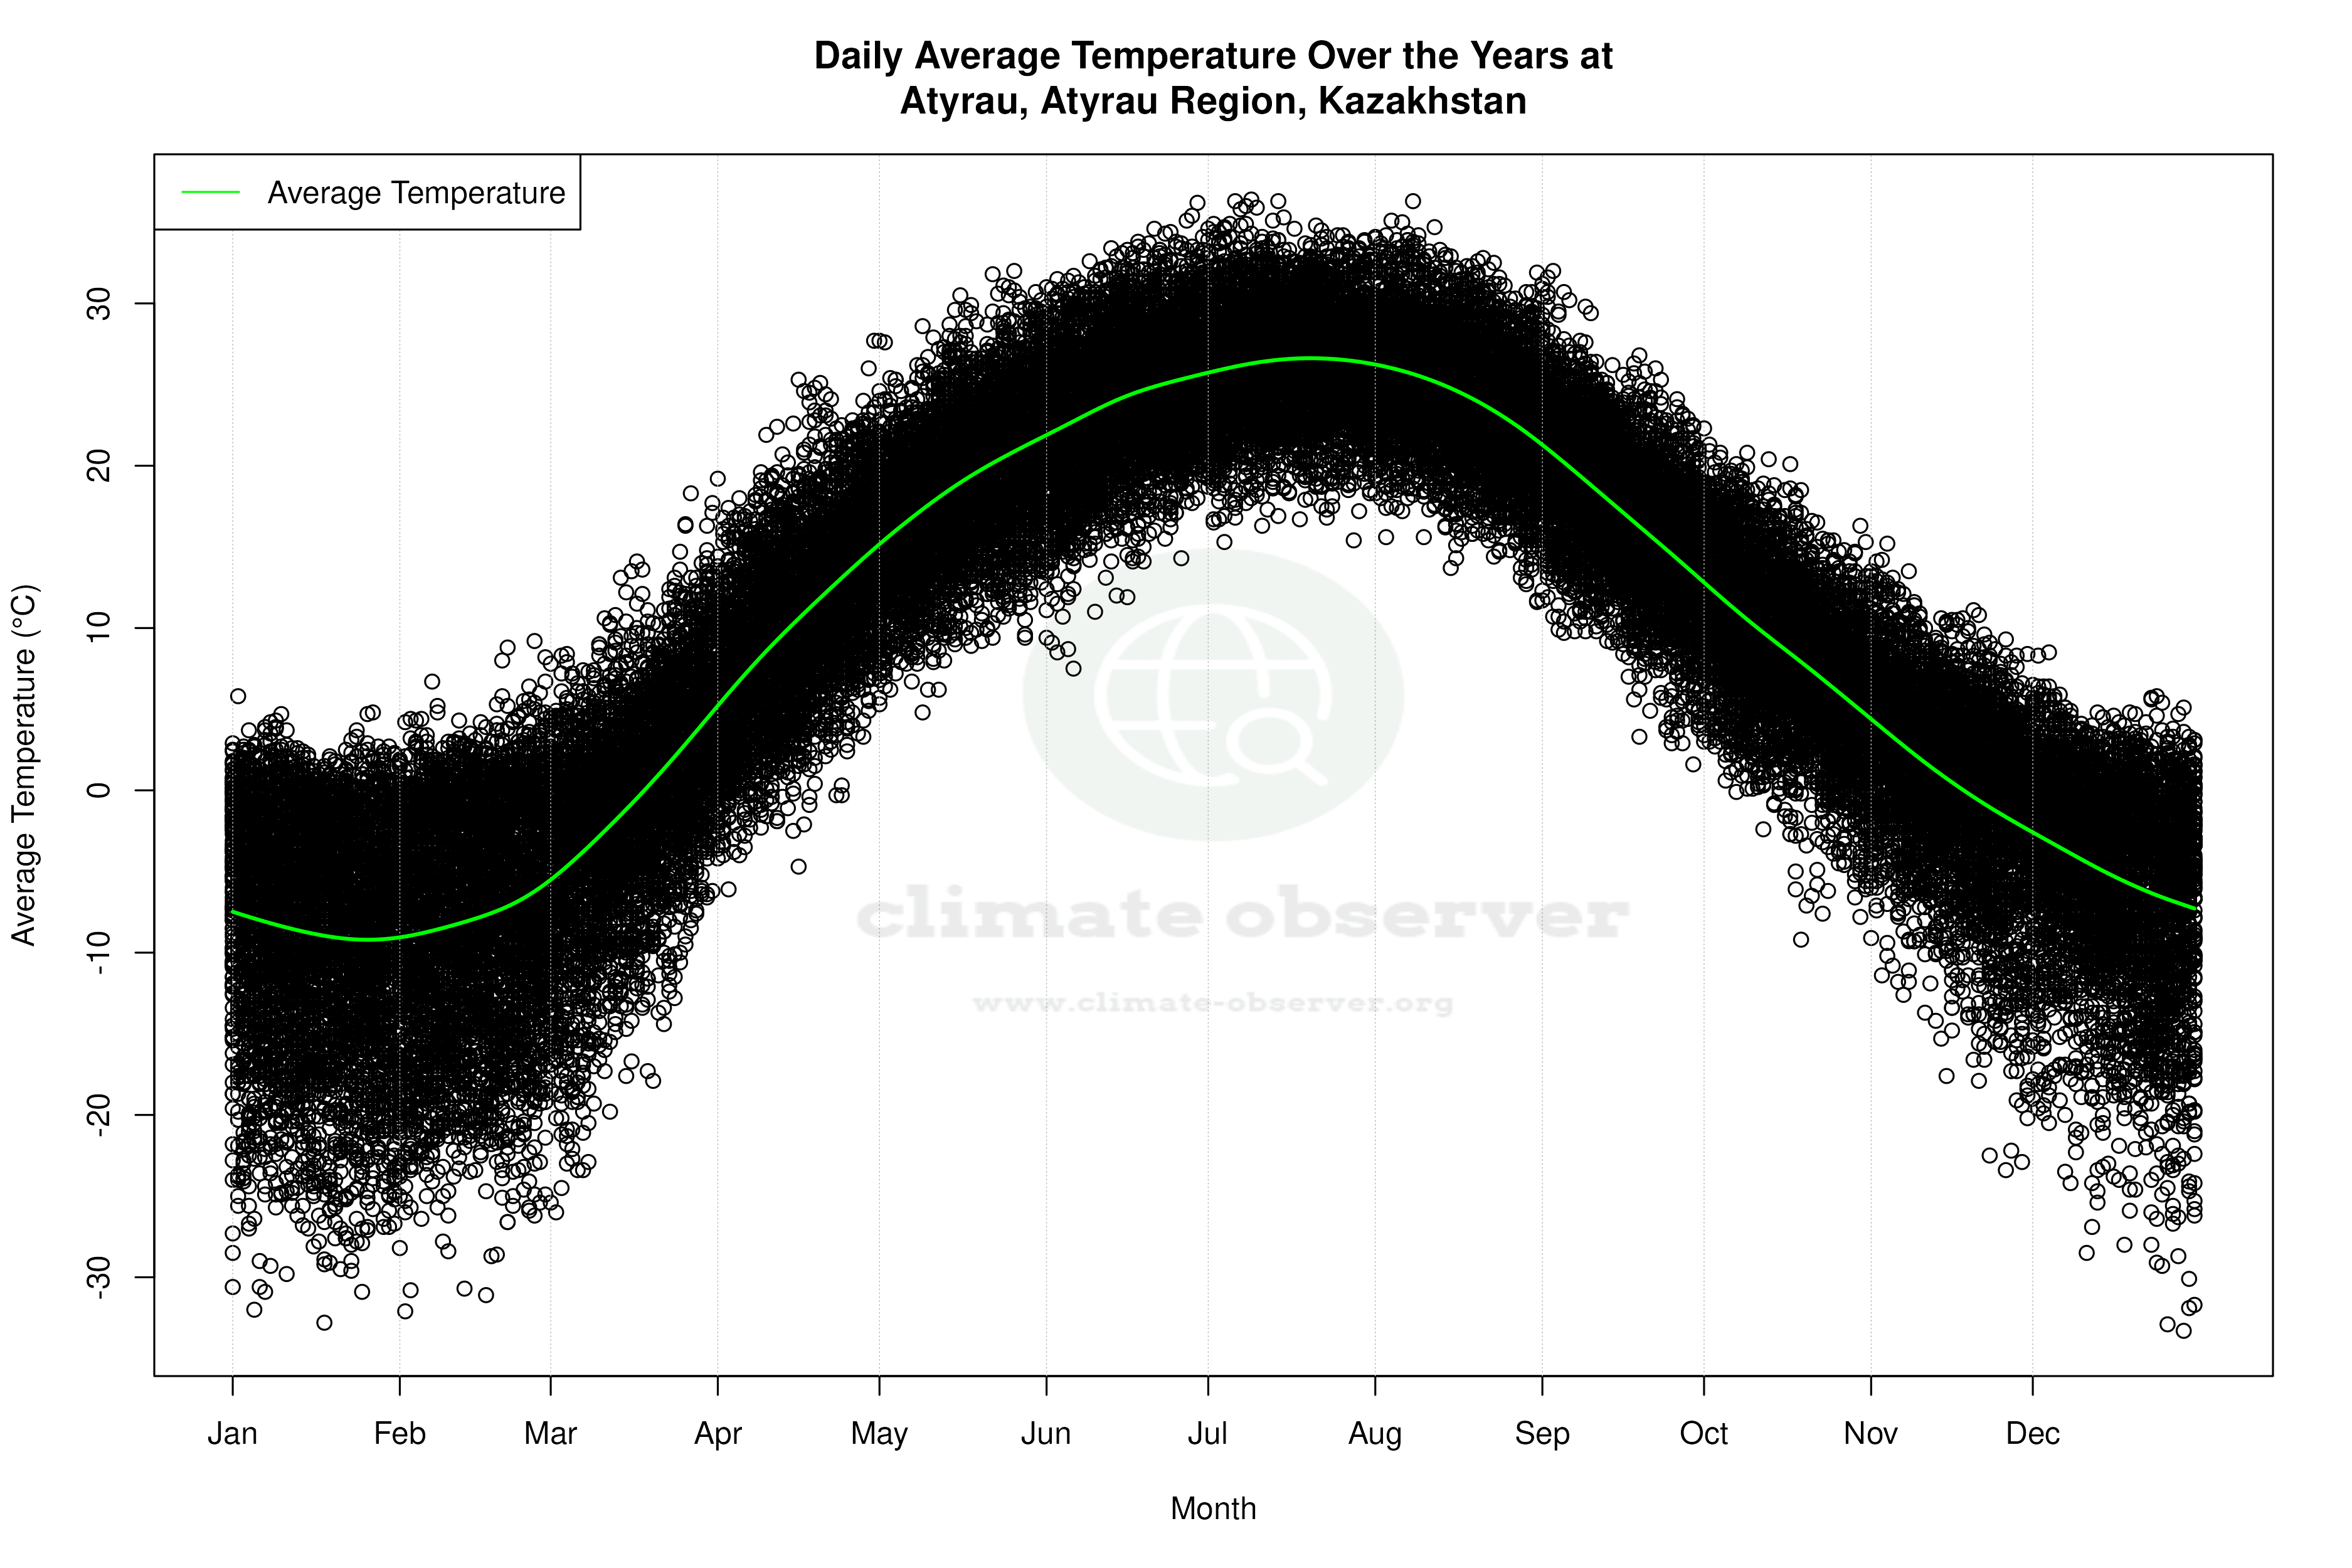


Average Max Temperature Throughout Year | 1 of 5
