Climate for Station: Liepaja, Latvia (Kurzeme), Latvia
Loading live weather...
Climate Analysis & Overview
Liepaja is experiencing a warming trend, with significant increases in both high and low temperatures over the past decade. Precipitation has become more evenly distributed, suggesting a shift towards a more balanced climate pattern. This aligns with Latvia's regional climate goals of reducing extreme weather events.
Coastal Influence on Liepaja's Climate
Liepaja, situated on the western coast of Latvia, experiences a humid continental climate, classified as Dfb under the Köppen system. The Baltic Sea moderates the city's climate, leading to milder winters and cooler summers compared to inland areas. This coastal influence is evident in the city's temperature trends. Over the past decade, Liepaja has seen a warming of 0.66°C (1.19°F) in high temperatures and 0.16°C (0.29°F) in lows. These changes are more pronounced than the all-time trends, which show a rise of 0.23°C (0.41°F) in highs and 0.06°C (0.11°F) in lows. This suggests a recent acceleration in warming, possibly influenced by regional sea surface temperature changes.
Temperature Extremes: A Historical Perspective
Liepaja's temperature records highlight the city's climatic variability. The highest temperature recorded is 35.6°C (96.1°F), while the lowest is -32.9°C (-27.2°F). These extremes underscore the city's capacity for significant thermal oscillations, despite its coastal location. The all-time warming trend, although modest, indicates a gradual shift towards higher temperatures, which could influence future weather patterns and local ecosystems.
Precipitation Patterns: Towards Even Distribution
The Precipitation Concentration Index (PCI) for Liepaja has decreased from a baseline of 11.06 to a current value of 9.34. This decline suggests that precipitation is becoming more evenly distributed throughout the year, reducing the likelihood of intense, concentrated rainfall events. Such a shift could mitigate flood risks and support agricultural stability, aligning with Latvia's climate objectives to adapt to changing precipitation patterns.
Regional Climate Goals and Recent Events
Latvia has been proactive in addressing climate change, aiming to reduce the frequency and impact of extreme weather events. Liepaja's recent climate trends, particularly the more even precipitation distribution, support these goals. Recent weather events, such as milder winters and less severe storms, reflect these changes. The city's climate profile suggests a move towards a more stable and predictable climate, which could benefit both the local population and the environment.
Implications of Warming Trends
The warming trends observed in Liepaja raise important considerations for future climate resilience. The increased temperatures, particularly in the last decade, may affect local biodiversity and energy consumption patterns. As the city continues to warm, strategies to adapt to these changes will become increasingly important. This includes enhancing infrastructure to cope with potential heatwaves and ensuring sustainable water management practices to accommodate the evolving precipitation patterns.
Station Statistics
10-Year Trend
High: +0.56 °F/decade
Low: -0.18 °F/decade
Rain: -0.020 in/decade
25-Year Trend
High: +0.98 °F/decade
Low: +0.53 °F/decade
Rain: -0.008 in/decade
50-Year Trend
High: +0.93 °F/decade
Low: +0.59 °F/decade
Rain: +0.001 in/decade
All-Time Trend
High: +0.41 °F/decade
Low: +0.11 °F/decade
Rain: +0.002 in/decade
Percentage Above-Average Days
Last 12 Months: 51.9%
This Year: 61.1%
Precipitation Concentration Index (PCI) ℹ️
Last 12 Months: 10.2
Historical Average: 10.9
Percentile Rank of Last 12 Months ℹ️
High: 83rd percentile
Low: 65th percentile
Rain: 18th percentile
Change in Variance ℹ️
High: -3.8%
Low: -13.0%
Intraday: +47.2%
Data Coverage
83.1%
First Year of Data
1881
Station Location
Historical Weather Records
| Max High | Avg High | Min High | Max Avg | Avg Avg | Min Avg | Max Low | Avg Low | Min Low | Max Precipitation | Avg Precipitation | Max Snow | Avg Snow | |
|---|---|---|---|---|---|---|---|---|---|---|---|---|---|
| Record | 96.08 °F | — | -8.14 °F | 82.58 °F | — | -16.60 °F | 73.04 °F | — | -27.22 °F | 4.57 in | — | — | — |
| January | 49.82 °F | 32.08 °F | -8.14 °F | 47.30 °F | 28.33 °F | -16.60 °F | 44.78 °F | 23.76 °F | -27.22 °F | 0.85 in | 0.06 in | — | — |
| February | 59.90 °F | 32.00 °F | -3.82 °F | 50.72 °F | 27.98 °F | -13.00 °F | 45.14 °F | 23.17 °F | -24.88 °F | 0.82 in | 0.05 in | — | — |
| March | 66.20 °F | 37.73 °F | 7.88 °F | 55.22 °F | 32.57 °F | 5.54 °F | 44.60 °F | 27.56 °F | -9.22 °F | 0.92 in | 0.04 in | — | — |
| April | 79.88 °F | 47.99 °F | 28.94 °F | 67.82 °F | 41.34 °F | 20.84 °F | 58.28 °F | 35.18 °F | 13.82 °F | 0.98 in | 0.04 in | — | — |
| May | 86.36 °F | 58.38 °F | 36.14 °F | 77.18 °F | 50.84 °F | 32.36 °F | 65.66 °F | 43.29 °F | 24.26 °F | 1.29 in | 0.05 in | — | — |
| June | 91.40 °F | 64.43 °F | 44.60 °F | 82.58 °F | 57.80 °F | 34.16 °F | 71.60 °F | 51.04 °F | 30.20 °F | 1.60 in | 0.06 in | — | — |
| July | 92.66 °F | 69.30 °F | 54.68 °F | 82.40 °F | 63.20 °F | 48.20 °F | 73.04 °F | 56.67 °F | 39.20 °F | 3.88 in | 0.08 in | — | — |
| August | 96.08 °F | 69.16 °F | 54.50 °F | 80.06 °F | 62.72 °F | 49.28 °F | 71.06 °F | 56.34 °F | 37.40 °F | 4.57 in | 0.10 in | — | — |
| September | 87.26 °F | 61.99 °F | 42.62 °F | 72.32 °F | 55.97 °F | 38.12 °F | 64.94 °F | 50.10 °F | 28.94 °F | 2.00 in | 0.09 in | — | — |
| October | 73.40 °F | 52.12 °F | 28.40 °F | 64.40 °F | 46.99 °F | 23.00 °F | 60.62 °F | 42.23 °F | 18.86 °F | 1.62 in | 0.10 in | — | — |
| November | 59.72 °F | 42.56 °F | 14.90 °F | 54.50 °F | 38.64 °F | 10.40 °F | 52.34 °F | 34.83 °F | 0.50 °F | 1.20 in | 0.09 in | — | — |
| December | 51.80 °F | 36.18 °F | 1.04 °F | 50.36 °F | 32.37 °F | -8.32 °F | 48.74 °F | 28.17 °F | -14.44 °F | 0.93 in | 0.08 in | — | — |
Data Visualisations
Remove WatermarksCurrent Year Climate Trends vs Historical


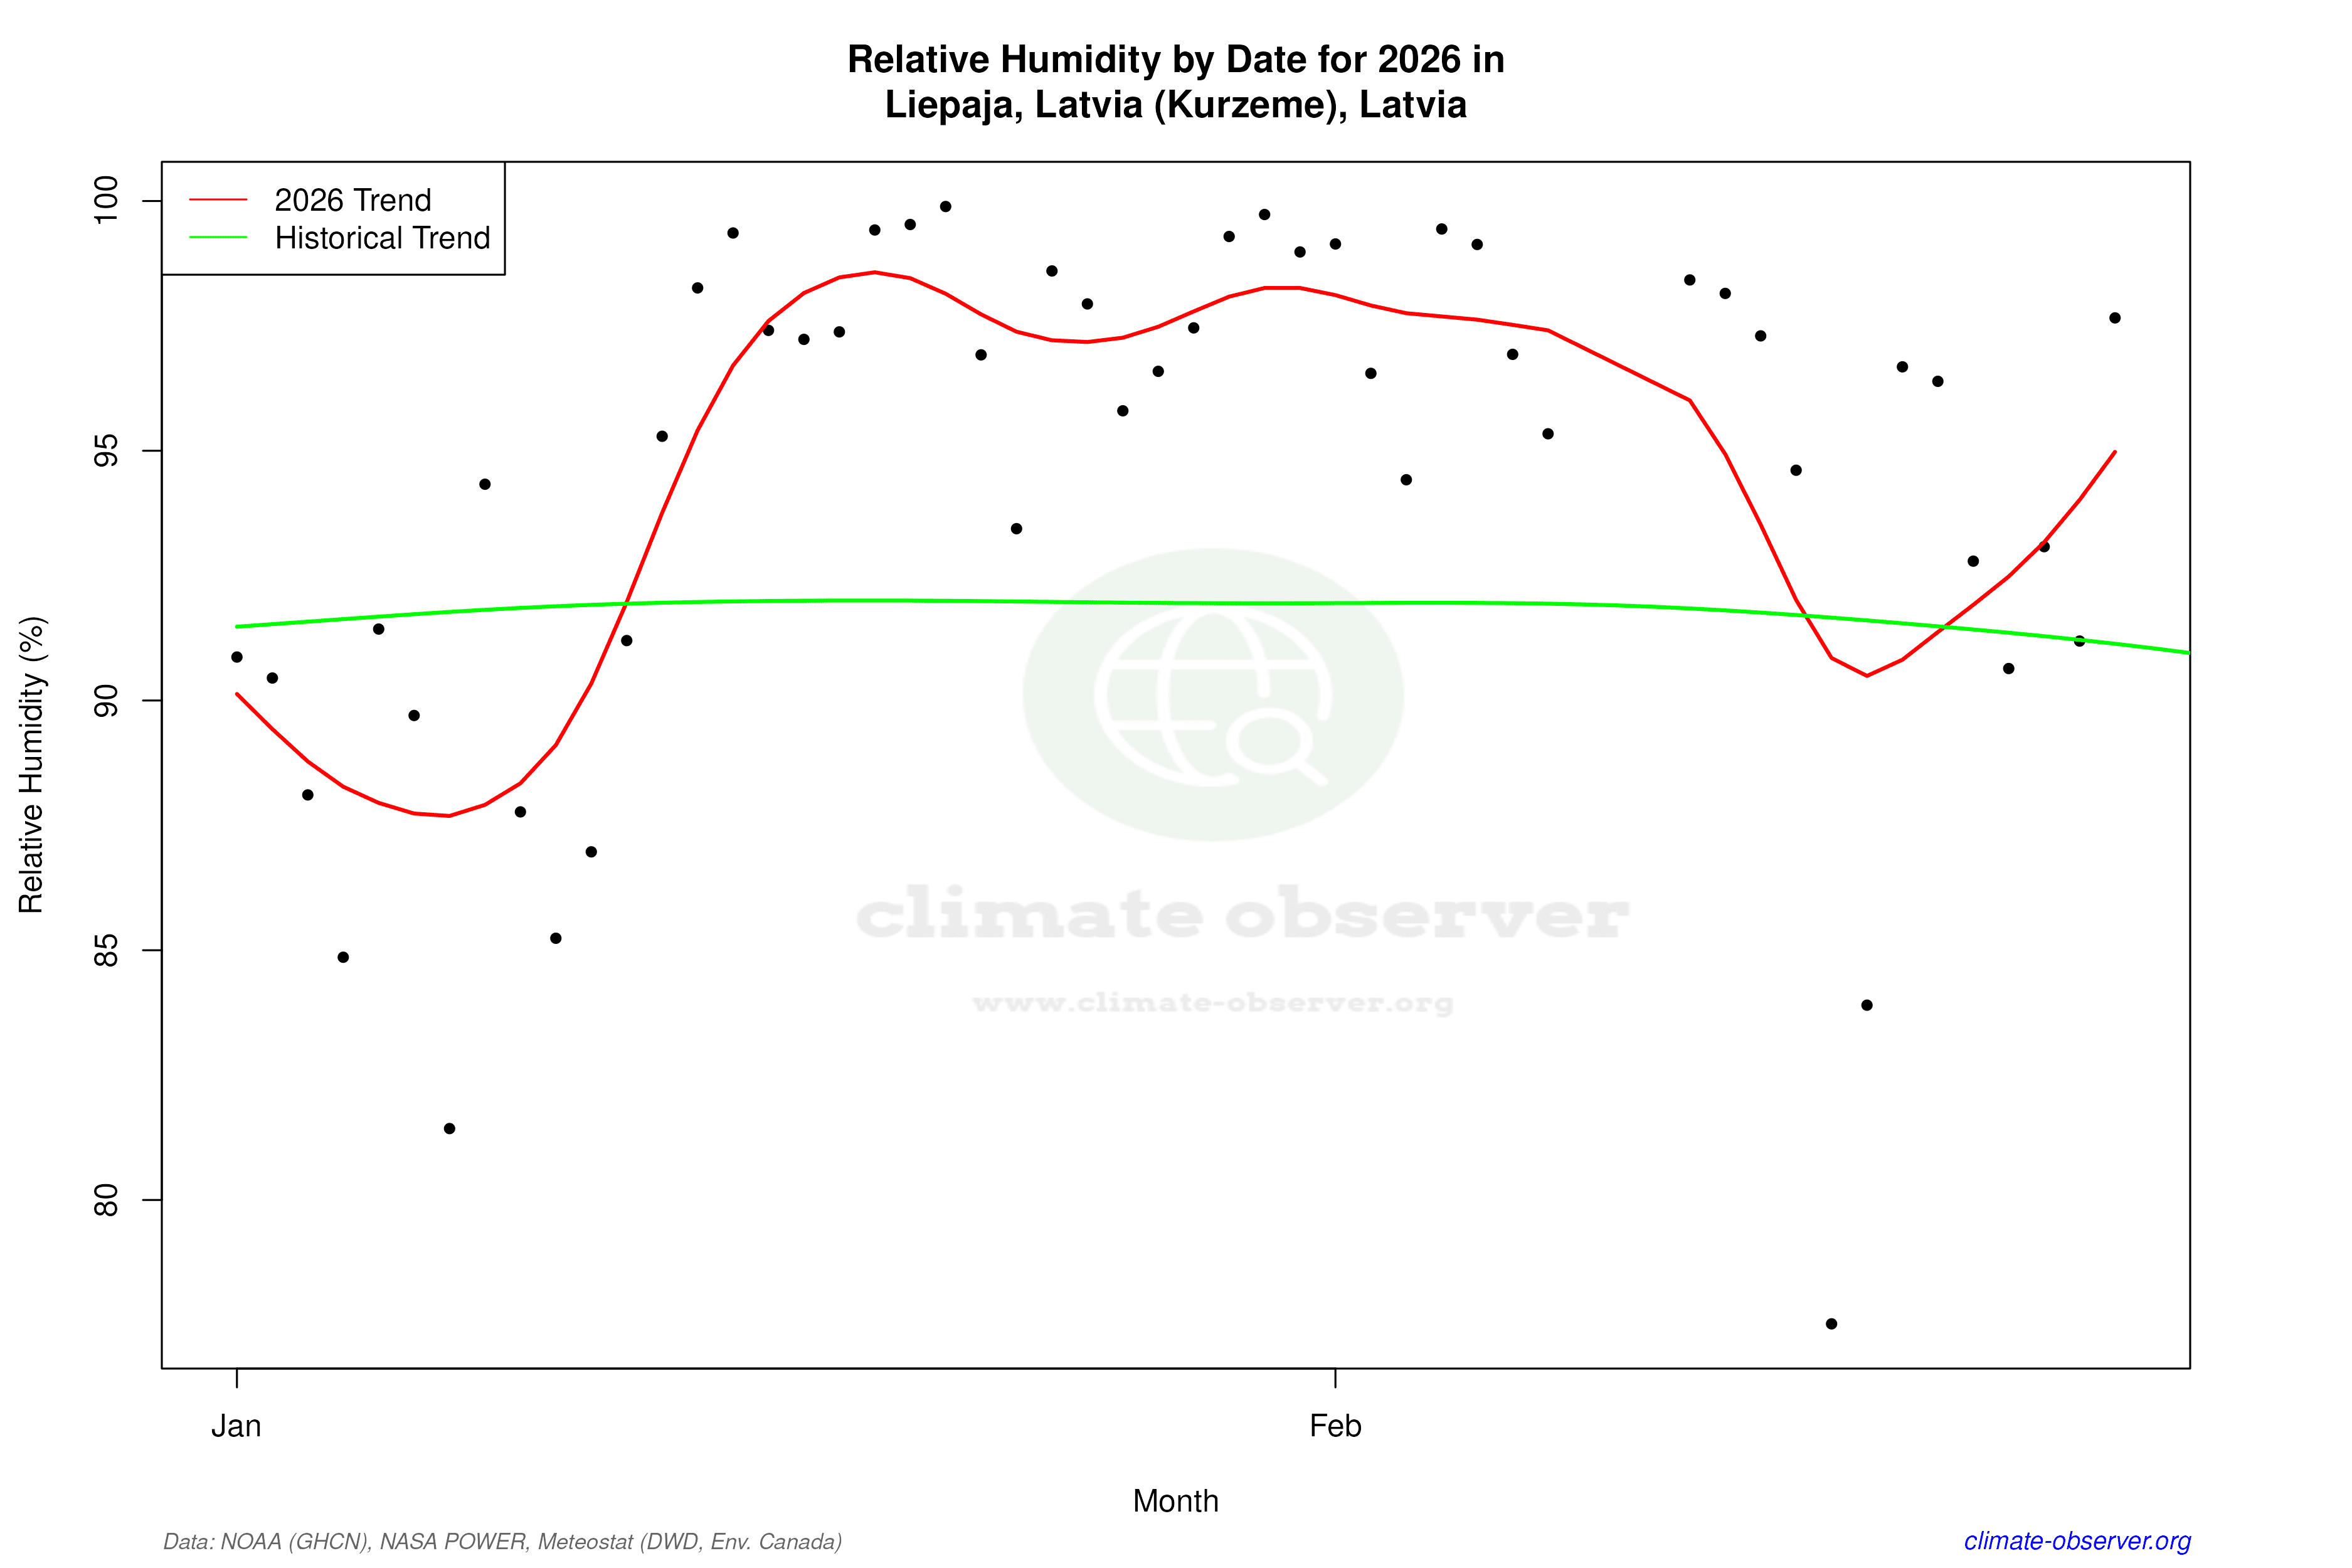

Max Temperature this Year | 1 of 6
Climate 12-Month Moving Averages


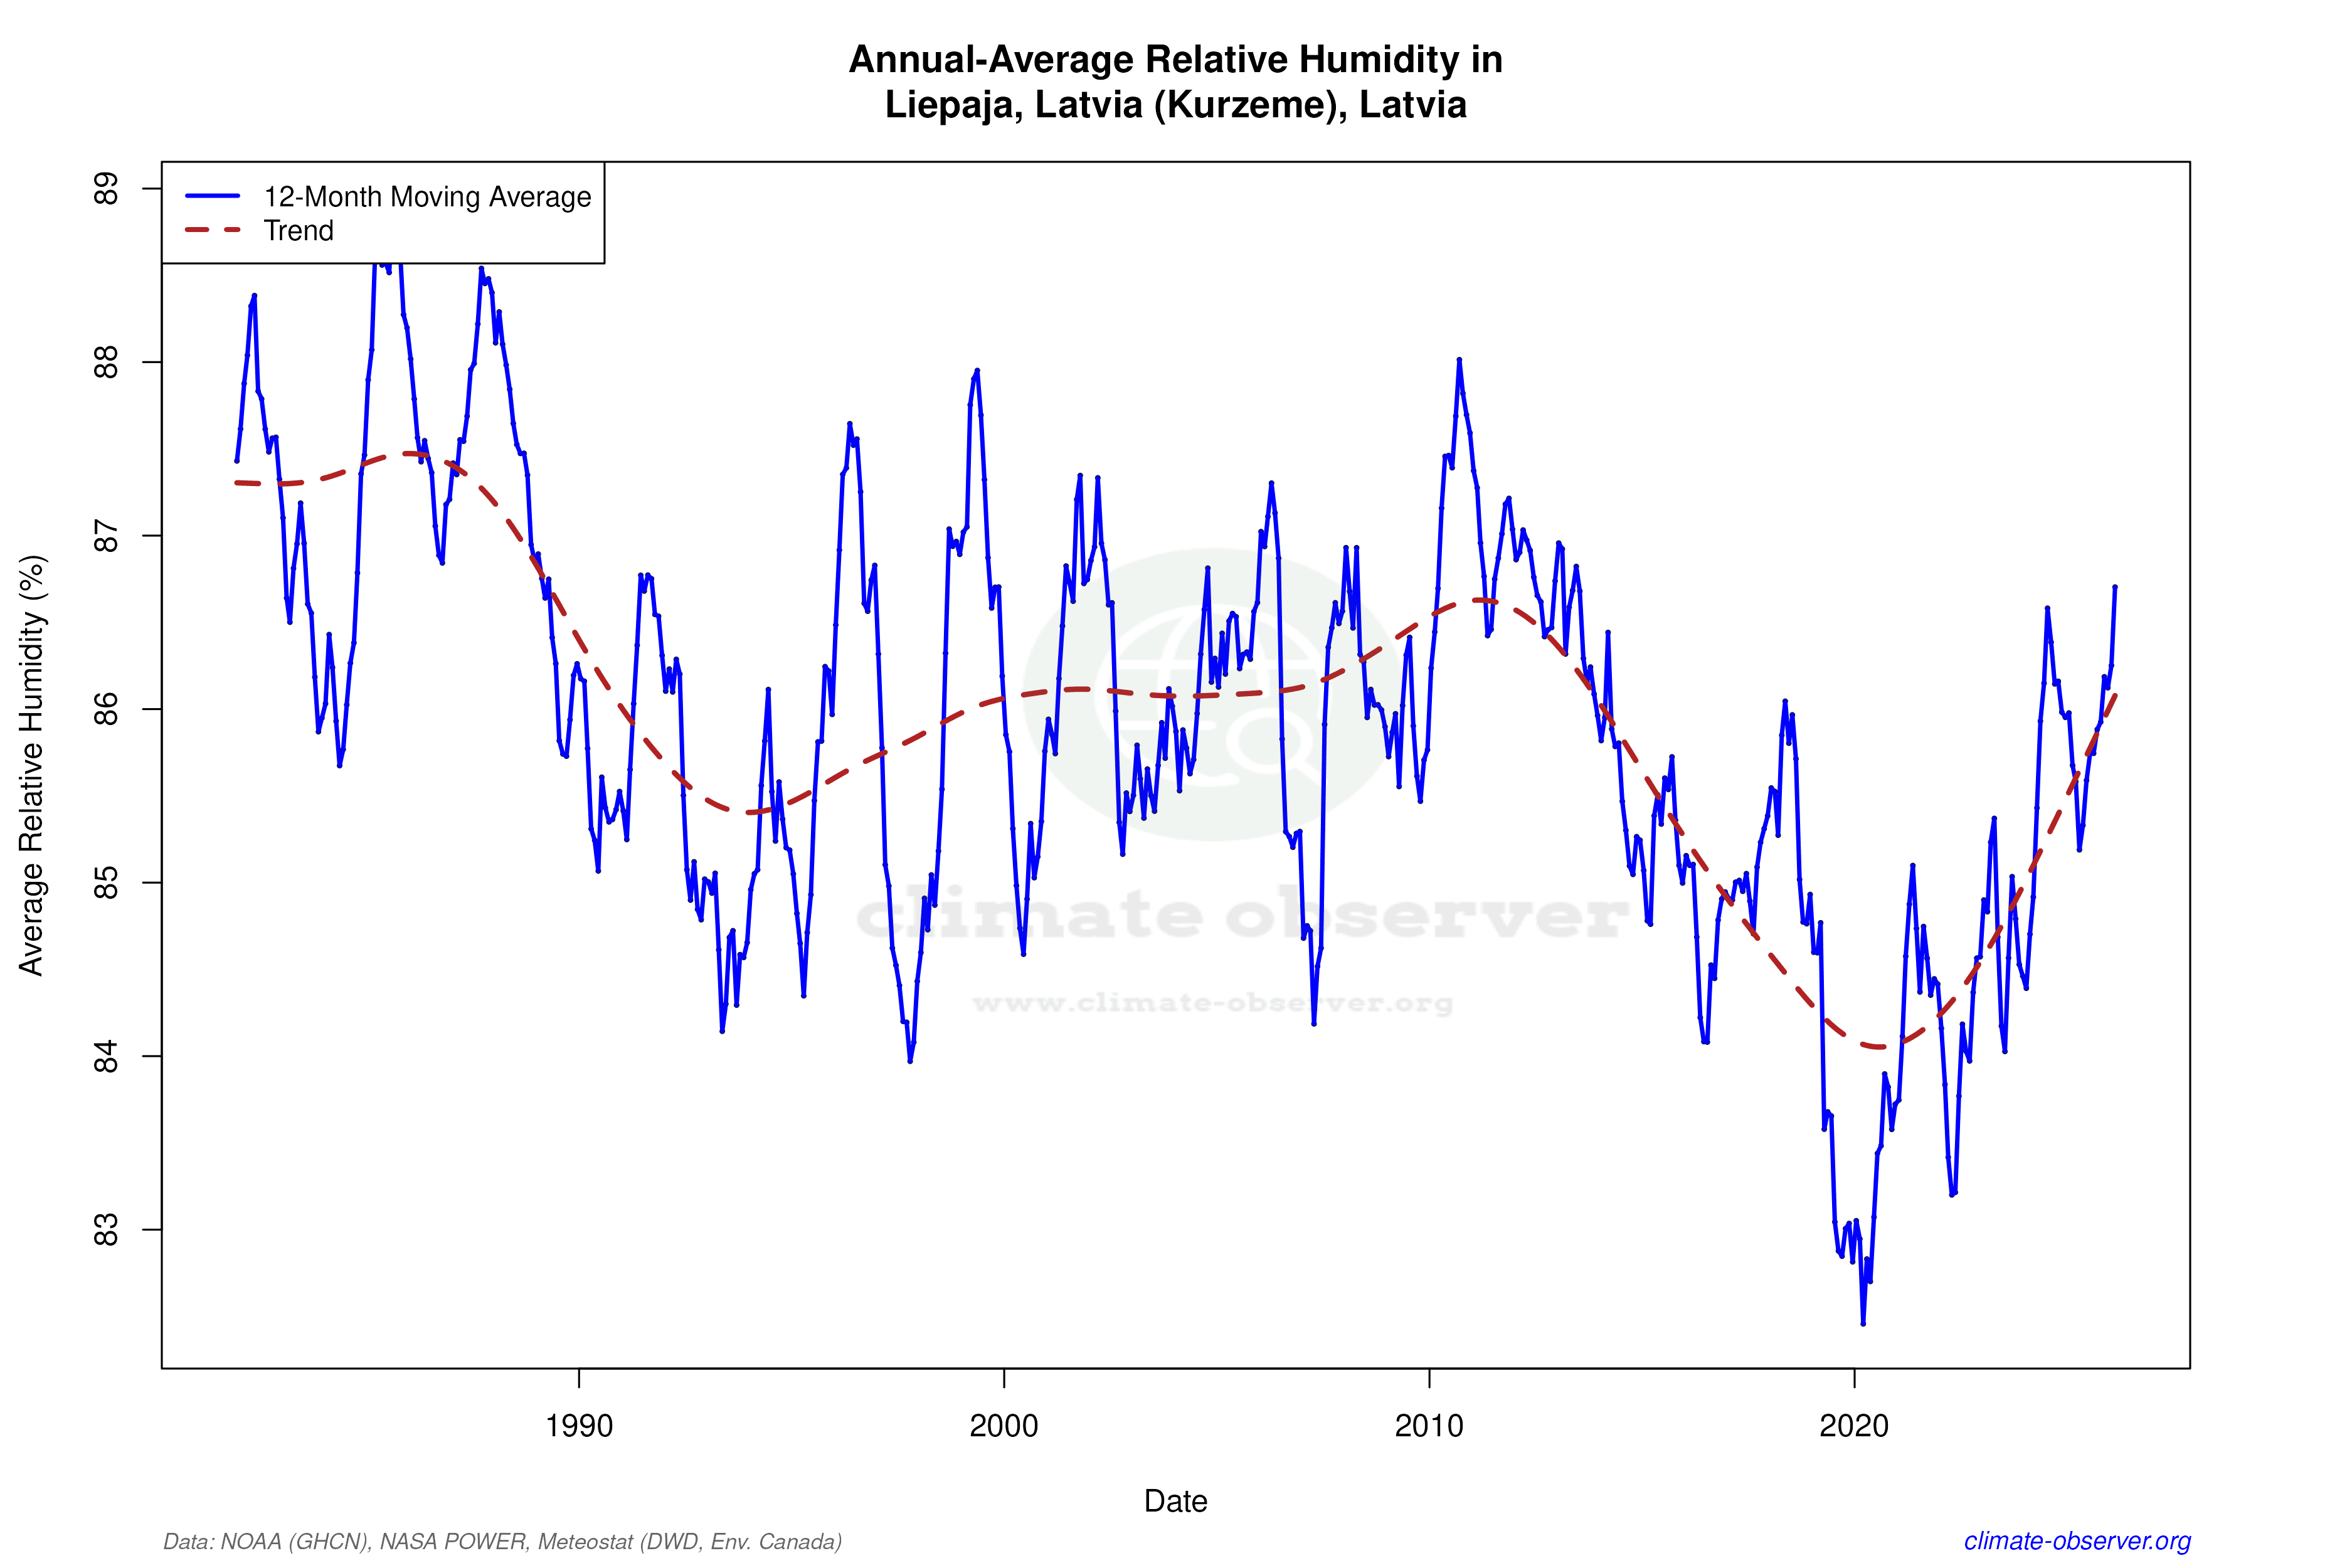

Max Temperature 12-Month MA | 1 of 6
Daily Data Points and Averages Throughout the Year


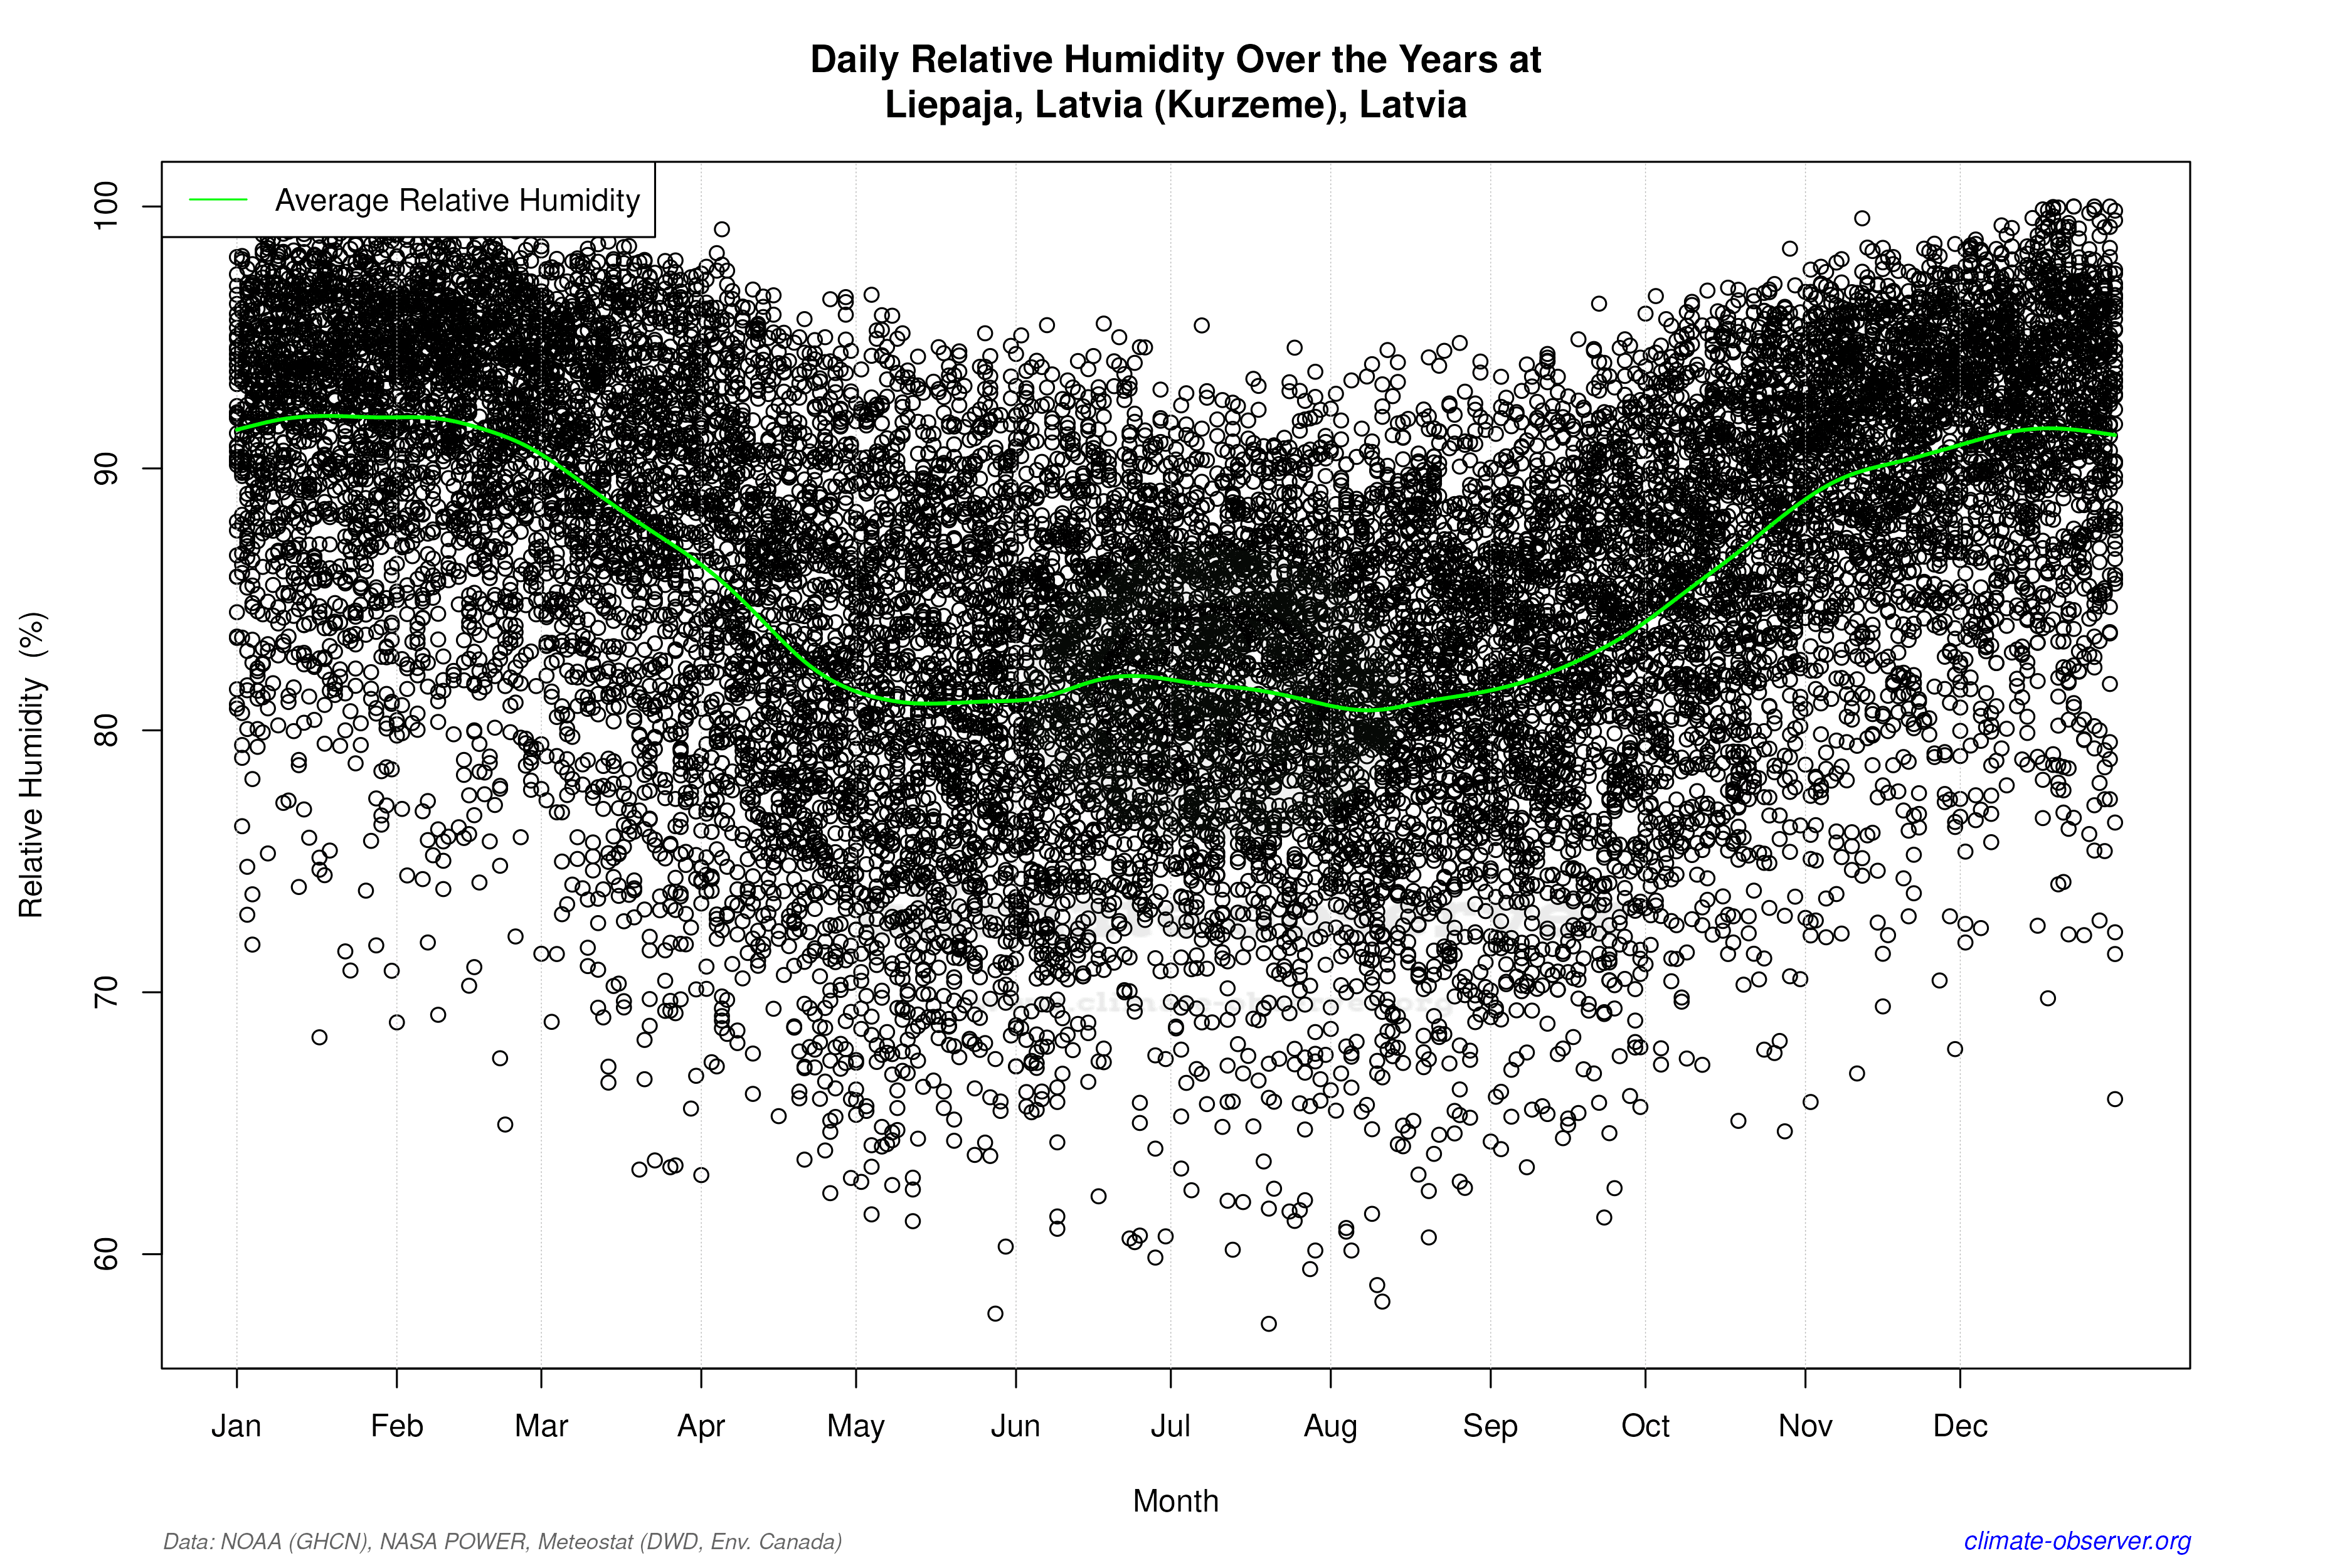

Average Max Temperature Throughout Year | 1 of 5
