Climate for Station: Poprad/Tatry, Presov Region, Slovakia
Loading live weather...
Climate Analysis & Overview
Poprad/Tatry experiences a complex climate narrative with a long-term warming trend juxtaposed against recent cooling, particularly in high temperatures. Precipitation has become more evenly distributed, reflecting subtle shifts in regional weather patterns.
Mountainous Climate Dynamics
Poprad/Tatry, located in the Prešovský kraj of Slovakia, is nestled within the High Tatras, a mountain range that significantly influences its climate. This region is classified under the Köppen climate classification as Dfb, indicating a humid continental climate with warm summers and cold, snowy winters. The local geography, dominated by the Tatras, contributes to significant temperature variations and precipitation patterns, with the mountains acting as a barrier that affects both wind and weather systems.
Temperature Trends: A Dual Narrative
Over the all-time record, Poprad/Tatry has experienced a slight warming trend, with highs increasing by 0.19°C (0.34°F) and lows by 0.20°C (0.36°F). However, the recent 10-year interval reveals a contrasting narrative, with a notable cooling trend in high temperatures, decreasing by 4.93°C (8.88°F), and lows by 1.15°C (2.07°F). This dichotomy suggests a complex interplay of regional and global climatic factors, possibly influenced by recent weather patterns and atmospheric changes.
Precipitation Patterns: A Shift Towards Evenness
The Precipitation Concentration Index (PCI) for Poprad/Tatry indicates a shift towards more evenly distributed precipitation. The baseline PCI of 11.35 has decreased to a current value of 9.81, reflecting a more uniform distribution of rainfall throughout the year. This change suggests that precipitation events are becoming less concentrated, with fewer instances of heavy rainfall, which could be beneficial for local agriculture and water management.
Extremes in Temperature Records
The station's historical temperature records highlight significant extremes, with a maximum recorded temperature of 34.8°C (94.6°F) and a minimum of -29.1°C (-20.4°F). These extremes underscore the region's susceptibility to both intense summer heat and severe winter cold, influenced by its elevation and latitude.
Regional Climate Context
Slovakia has been actively pursuing climate goals aimed at reducing greenhouse gas emissions and enhancing resilience to climate change. The trends observed in Poprad/Tatry align with these objectives, as the more even distribution of precipitation and the nuanced temperature changes reflect broader efforts to mitigate climate impacts. Recent weather events, such as unseasonably warm winters or late spring frosts, further illustrate the dynamic climate challenges faced by the region.
Station Statistics
10-Year Trend
High: -8.06 °F/decade
Low: -1.32 °F/decade
Rain: -0.009 in/decade
25-Year Trend
High: -1.06 °F/decade
Low: +0.38 °F/decade
Rain: +0.002 in/decade
50-Year Trend
High: +0.37 °F/decade
Low: +0.53 °F/decade
Rain: +0.008 in/decade
All-Time Trend
High: +0.38 °F/decade
Low: +0.39 °F/decade
Rain: +0.010 in/decade
Percentage Above-Average Days
Last 12 Months: 42.5%
This Year: 45.0%
Precipitation Concentration Index (PCI) ℹ️
Last 12 Months: 10.0
Historical Average: 10.4
Percentile Rank of Last 12 Months ℹ️
High: 17th percentile
Low: 57th percentile
Rain: 50th percentile
Change in Variance ℹ️
High: +7.8%
Low: -6.4%
Intraday: +3.3%
Data Coverage
92.7%
First Year of Data
1951
Station Location
Historical Weather Records
| Max High | Avg High | Min High | Max Avg | Avg Avg | Min Avg | Max Low | Avg Low | Min Low | Max Precipitation | Avg Precipitation | Max Snow | Avg Snow | |
|---|---|---|---|---|---|---|---|---|---|---|---|---|---|
| Record | 94.64 °F | — | 0.14 °F | 78.44 °F | — | -10.30 °F | 65.84 °F | — | -20.38 °F | 2.49 in | — | — | — |
| January | 53.42 °F | 31.33 °F | 0.14 °F | 46.58 °F | 25.00 °F | -10.30 °F | 42.98 °F | 16.36 °F | -20.38 °F | 1.05 in | 0.06 in | — | — |
| February | 63.32 °F | 35.03 °F | 0.14 °F | 48.56 °F | 27.72 °F | -7.42 °F | 44.78 °F | 18.99 °F | -20.20 °F | 1.15 in | 0.06 in | — | — |
| March | 72.14 °F | 43.11 °F | 13.10 °F | 54.68 °F | 35.04 °F | 2.12 °F | 46.22 °F | 25.43 °F | -13.00 °F | 0.91 in | 0.07 in | — | — |
| April | 80.78 °F | 53.69 °F | 25.50 °F | 65.48 °F | 43.83 °F | 21.92 °F | 52.34 °F | 33.55 °F | 8.96 °F | 1.27 in | 0.08 in | — | — |
| May | 88.16 °F | 62.74 °F | 35.60 °F | 71.96 °F | 52.76 °F | 32.18 °F | 58.64 °F | 41.59 °F | 19.94 °F | 1.66 in | 0.12 in | — | — |
| June | 90.32 °F | 69.11 °F | 43.52 °F | 76.46 °F | 58.93 °F | 41.18 °F | 64.22 °F | 47.76 °F | 26.78 °F | 2.49 in | 0.14 in | — | — |
| July | 94.64 °F | 72.31 °F | 50.00 °F | 78.44 °F | 61.85 °F | 46.04 °F | 64.40 °F | 50.61 °F | 32.72 °F | 1.89 in | 0.14 in | — | — |
| August | 93.20 °F | 72.32 °F | 49.62 °F | 77.36 °F | 61.18 °F | 43.52 °F | 65.84 °F | 49.59 °F | 32.18 °F | 2.31 in | 0.11 in | — | — |
| September | 90.50 °F | 64.42 °F | 41.36 °F | 75.02 °F | 53.61 °F | 33.62 °F | 63.86 °F | 43.14 °F | 20.30 °F | 1.38 in | 0.09 in | — | — |
| October | 79.16 °F | 54.99 °F | 28.22 °F | 64.76 °F | 44.71 °F | 21.56 °F | 56.12 °F | 35.39 °F | 9.68 °F | 1.81 in | 0.08 in | — | — |
| November | 67.28 °F | 42.41 °F | 18.68 °F | 57.92 °F | 34.99 °F | 9.50 °F | 52.16 °F | 28.32 °F | -3.10 °F | 1.13 in | 0.08 in | — | — |
| December | 61.34 °F | 33.59 °F | 6.62 °F | 51.44 °F | 27.34 °F | -5.08 °F | 48.02 °F | 20.28 °F | -19.30 °F | 1.37 in | 0.07 in | — | — |
Data Visualisations
Remove WatermarksCurrent Year Climate Trends vs Historical


Max Temperature this Year | 1 of 6
Climate 12-Month Moving Averages


Max Temperature 12-Month MA | 1 of 6
Daily Data Points and Averages Throughout the Year


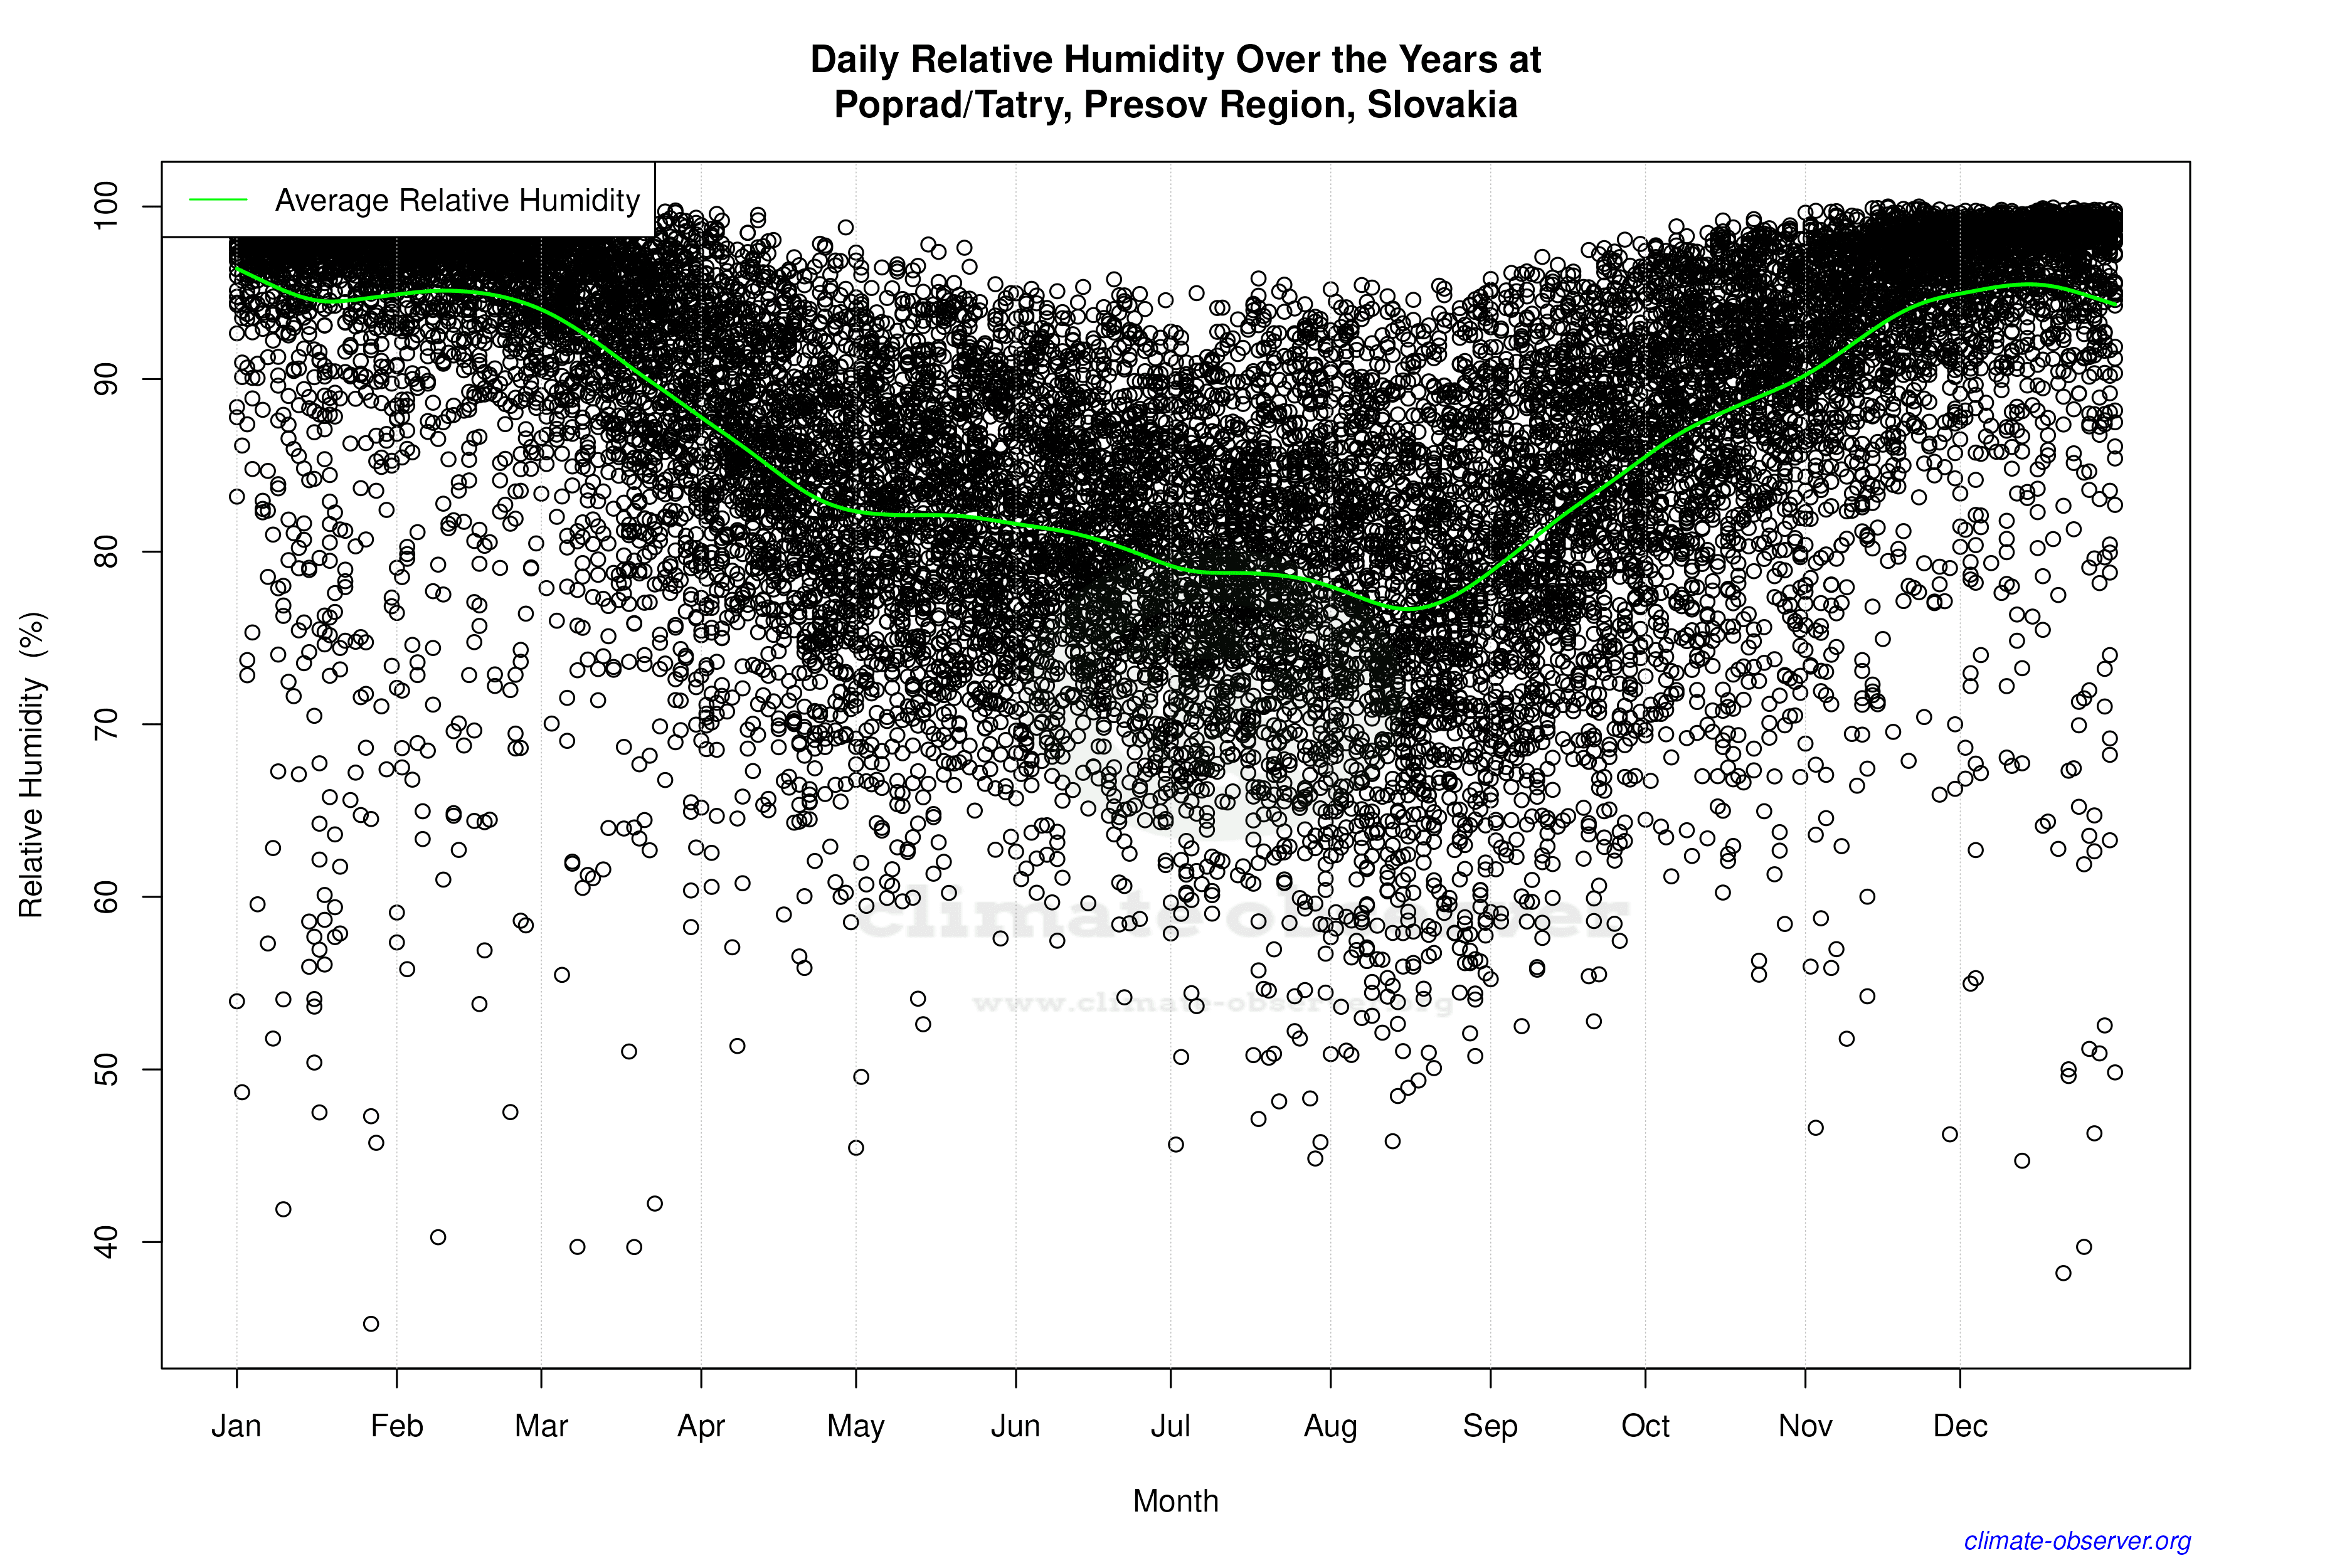

Average Max Temperature Throughout Year | 1 of 5
