Climate for Station: Kosice, Kosice Region, Slovakia
Loading live weather...
Climate Analysis & Overview
Kosice's climate exhibits a nuanced thermal pattern with a long-term warming trend, juxtaposed against a recent cooling in high temperatures. The Precipitation Concentration Index (PCI) indicates a shift towards more evenly distributed rainfall, aligning with Slovakia's regional climate goals for sustainable water management.
Warming Trends and Cooling Anomalies
Kosice, located in Eastern Slovakia, experiences a humid continental climate (Dfb) characterised by cold winters and warm summers. The all-time temperature data reveals a warming trend with highs increasing by 0.34°C (0.61°F) and lows by 0.36°C (0.64°F). This long-term warming is consistent with global climate patterns. However, over the past decade, the highs have shown a cooling trend, decreasing by 0.18°C (0.32°F), while the lows continue to rise by 0.40°C (0.72°F). This divergence suggests recent localised cooling during the warmest part of the year, possibly influenced by regional weather phenomena or changes in atmospheric circulation.
Extreme Temperature Records
Kosice's temperature extremes highlight the region's climatic variability. The record high stands at 38.5°C (101.3°F), while the record low is -26.9°C (-16.4°F). These records underscore the significant thermal oscillations typical of continental climates, where temperature swings can be dramatic due to the absence of moderating oceanic influences.
Precipitation Patterns and PCI Insights
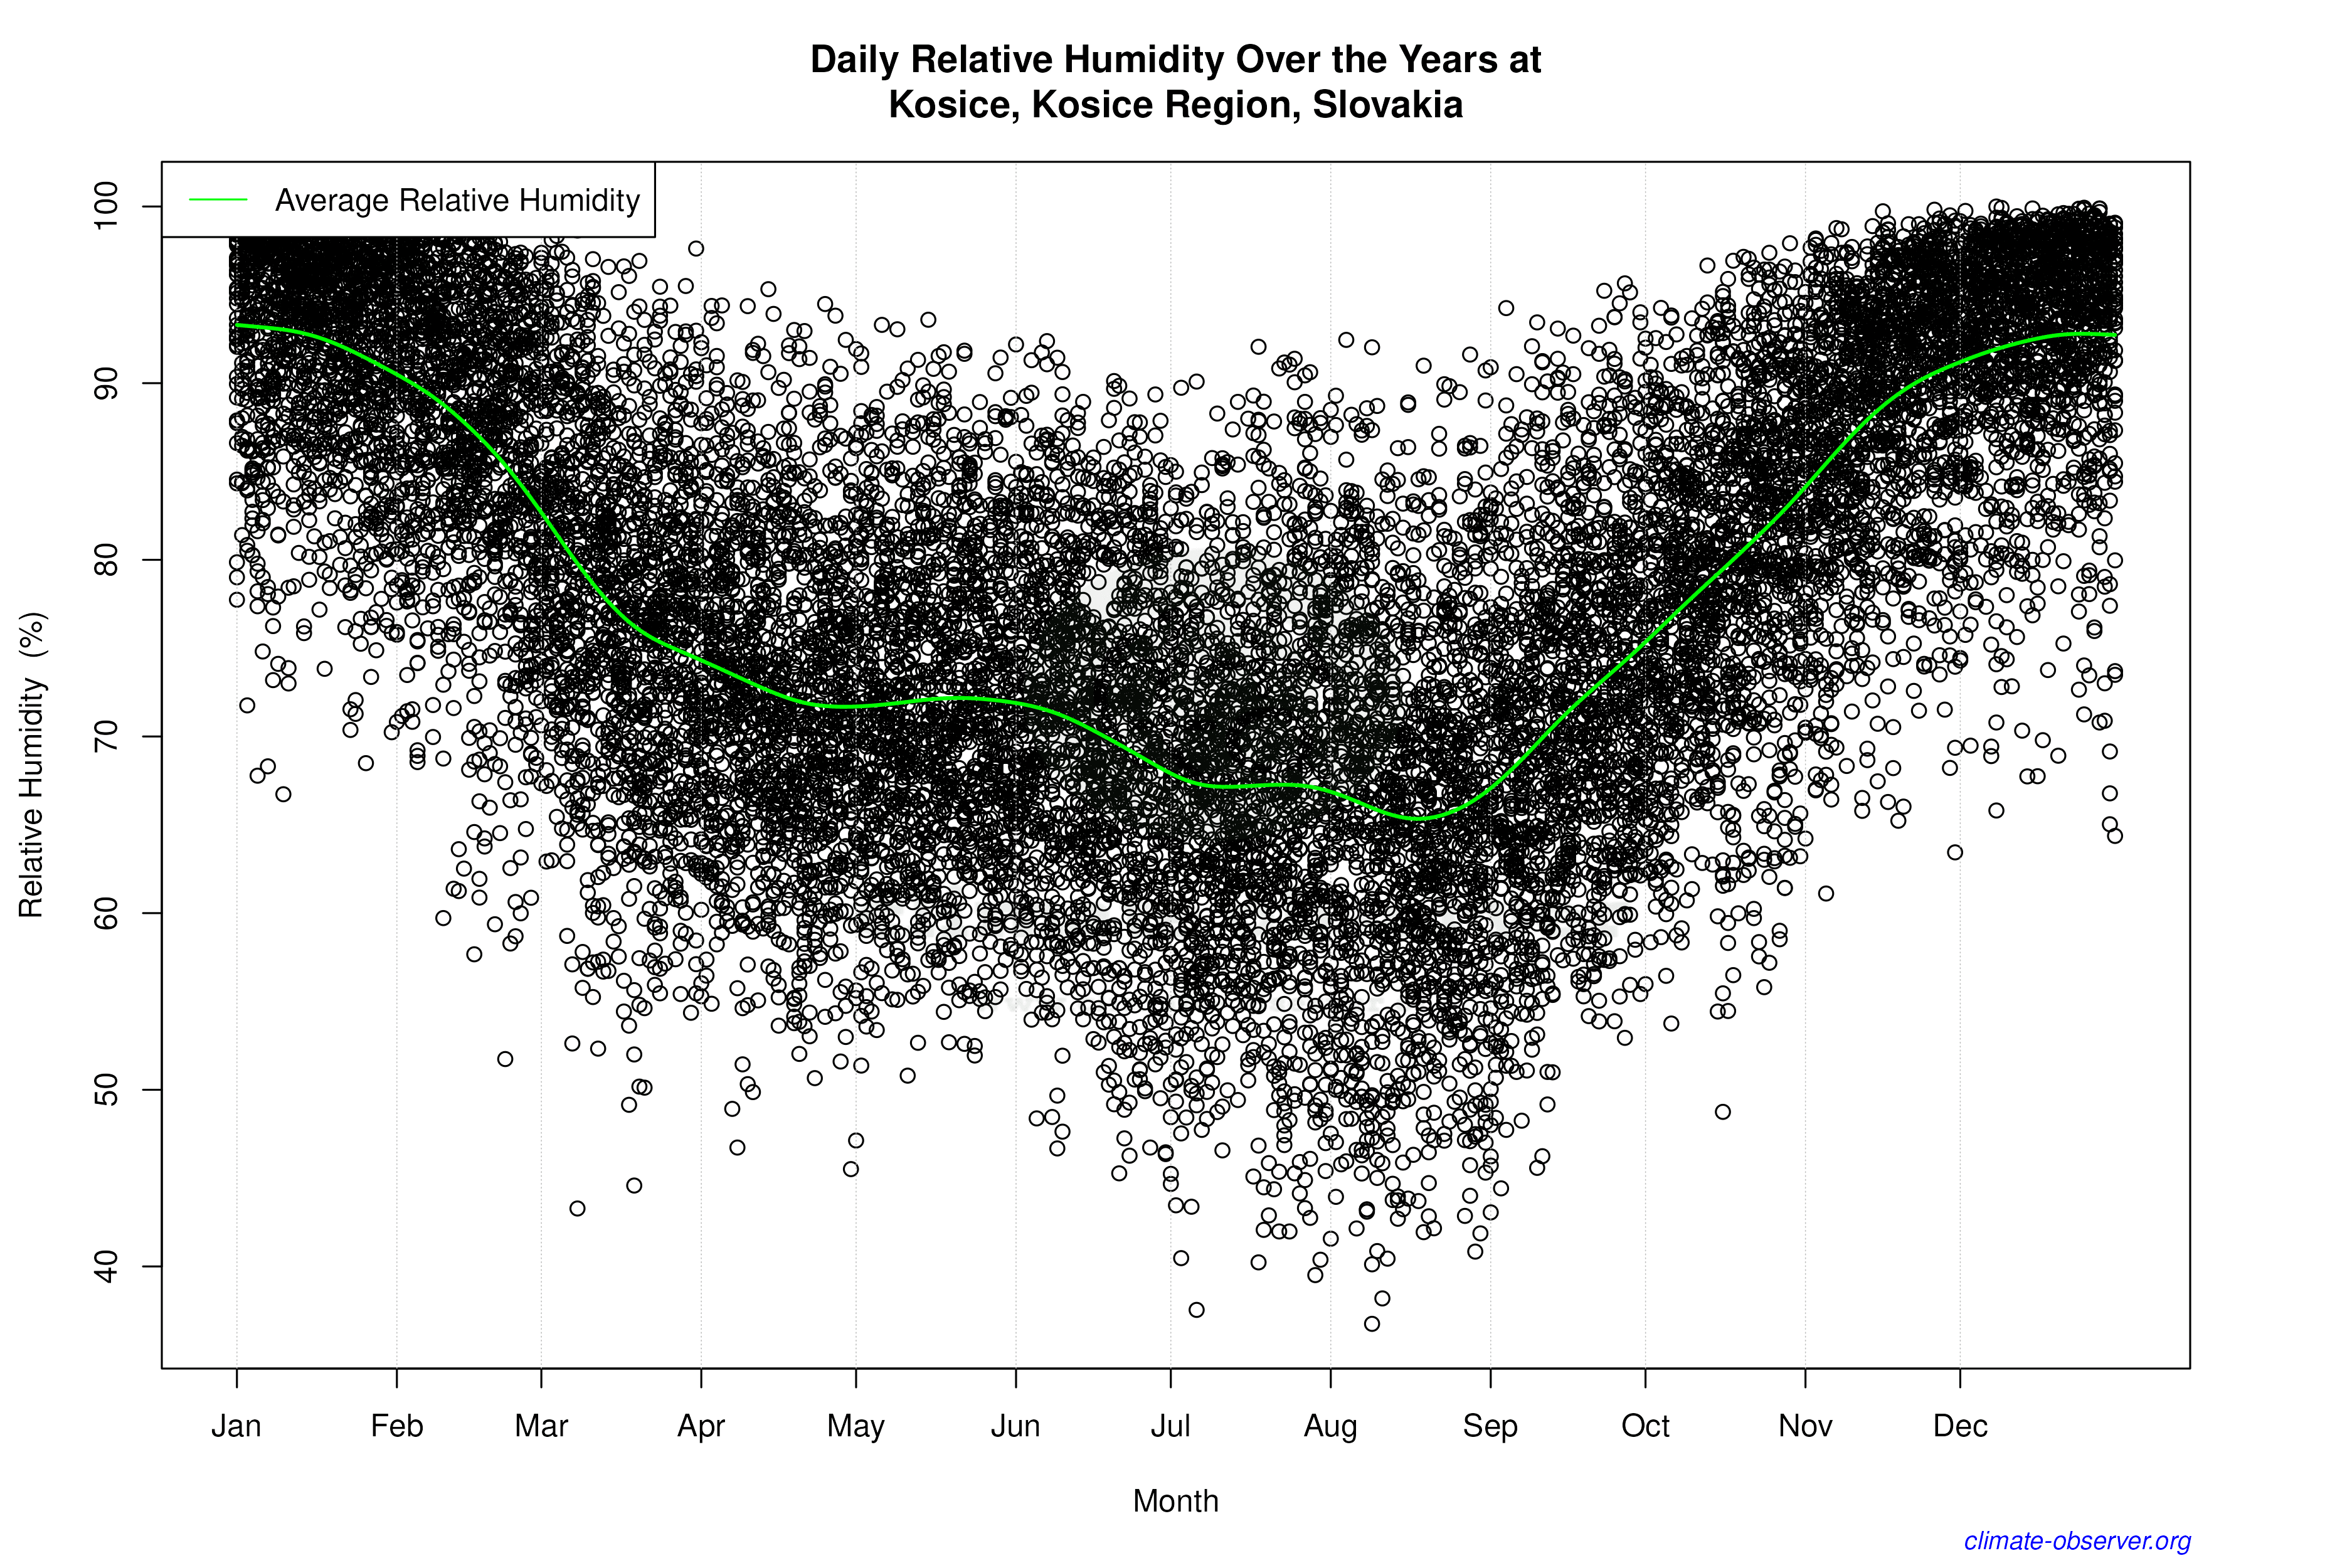
The Precipitation Concentration Index (PCI) offers insights into rainfall distribution. Kosice's PCI has decreased from a baseline of 11.8 to a current value of 9.5, indicating a more even distribution of precipitation events. This shift towards less concentrated rainfall aligns with broader regional goals to manage water resources more sustainably, reducing the risk of droughts and floods. A PCI under 10 suggests that precipitation is evenly spread throughout the year, which can benefit agriculture and water supply systems.
Geographical Influences on Climate
Kosice's geography, nestled in the valley of the Hornád River and surrounded by the Carpathian Mountains, plays a crucial role in its climate. The mountains act as a barrier, influencing wind patterns and precipitation. This geographical setting contributes to the city's distinct seasonal variations and the observed thermal trends. The local topography may also amplify the recent cooling trend in high temperatures by altering wind flow and cloud cover, affecting solar radiation reaching the surface.
Regional Climate Goals and Recent Developments
Slovakia's commitment to reducing greenhouse gas emissions and enhancing climate resilience is evident in its national policies. Recent weather events, such as unseasonal cold spells or heatwaves, have highlighted the need for adaptive strategies. Kosice's recent cooling trend in high temperatures could provide valuable insights into the effectiveness of these strategies and inform future climate action plans. The more evenly distributed precipitation aligns with efforts to mitigate the impacts of climate change on water resources, supporting both ecological and economic stability in the region.
Station Statistics
10-Year Trend
High: +0.08 °F/decade
Low: +1.16 °F/decade
Rain: +0.005 in/decade
25-Year Trend
High: +1.04 °F/decade
Low: +0.93 °F/decade
Rain: +0.001 in/decade
50-Year Trend
High: +1.03 °F/decade
Low: +0.95 °F/decade
Rain: +0.001 in/decade
All-Time Trend
High: +0.60 °F/decade
Low: +0.64 °F/decade
Rain: +0.000 in/decade
Percentage Above-Average Days
Last 12 Months: 51.8%
This Year: 70.1%
Precipitation Concentration Index (PCI) ℹ️
Last 12 Months: 10.7
Historical Average: 12.3
Percentile Rank of Last 12 Months ℹ️
High: 81st percentile
Low: 88th percentile
Rain: 33rd percentile
Change in Variance ℹ️
High: -1.7%
Low: +0.2%
Intraday: +0.4%
Data Coverage
95.8%
First Year of Data
1951
Station Location
Historical Weather Records
| Max High | Avg High | Min High | Max Avg | Avg Avg | Min Avg | Max Low | Avg Low | Min Low | Max Precipitation | Avg Precipitation | Max Snow | Avg Snow | |
|---|---|---|---|---|---|---|---|---|---|---|---|---|---|
| Record | 101.30 °F | — | 3.20 °F | 88.81 °F | — | -4.72 °F | 78.33 °F | — | -16.42 °F | 4.35 in | — | — | — |
| January | 55.76 °F | 32.69 °F | 3.20 °F | 46.58 °F | 27.76 °F | -4.72 °F | 45.32 °F | 21.88 °F | -16.42 °F | 0.95 in | 0.04 in | — | — |
| February | 64.04 °F | 37.73 °F | 10.40 °F | 53.42 °F | 31.20 °F | 2.84 °F | 46.94 °F | 24.95 °F | -8.14 °F | 1.02 in | 0.04 in | — | — |
| March | 77.72 °F | 48.53 °F | 17.24 °F | 60.98 °F | 39.79 °F | 10.04 °F | 51.26 °F | 31.22 °F | 1.22 °F | 0.97 in | 0.04 in | — | — |
| April | 83.48 °F | 59.98 °F | 36.50 °F | 69.98 °F | 49.82 °F | 31.46 °F | 58.82 °F | 39.85 °F | 18.86 °F | 1.42 in | 0.05 in | — | — |
| May | 89.60 °F | 68.79 °F | 41.54 °F | 76.10 °F | 58.58 °F | 37.22 °F | 66.56 °F | 48.10 °F | 27.32 °F | 1.97 in | 0.09 in | — | — |
| June | 98.74 °F | 75.24 °F | 49.28 °F | 88.81 °F | 65.00 °F | 43.34 °F | 78.33 °F | 54.57 °F | 31.28 °F | 2.43 in | 0.11 in | — | — |
| July | 101.30 °F | 78.54 °F | 57.02 °F | 84.56 °F | 67.92 °F | 52.52 °F | 75.02 °F | 57.24 °F | 39.56 °F | 3.09 in | 0.11 in | — | — |
| August | 99.32 °F | 78.18 °F | 55.76 °F | 83.12 °F | 67.42 °F | 51.44 °F | 72.86 °F | 56.59 °F | 36.86 °F | 4.35 in | 0.09 in | — | — |
| September | 94.10 °F | 69.58 °F | 47.48 °F | 77.90 °F | 59.15 °F | 41.36 °F | 67.82 °F | 49.39 °F | 25.88 °F | 1.72 in | 0.07 in | — | — |
| October | 80.24 °F | 58.51 °F | 33.80 °F | 66.92 °F | 48.99 °F | 27.86 °F | 59.54 °F | 40.59 °F | 16.52 °F | 1.54 in | 0.06 in | — | — |
| November | 73.22 °F | 45.16 °F | 19.58 °F | 61.34 °F | 38.80 °F | 15.62 °F | 53.24 °F | 33.17 °F | 6.80 °F | 1.29 in | 0.06 in | — | — |
| December | 57.38 °F | 35.19 °F | 12.92 °F | 48.74 °F | 30.64 °F | 3.92 °F | 45.68 °F | 25.94 °F | -6.34 °F | 1.43 in | 0.05 in | — | — |
Data Visualisations
Remove WatermarksCurrent Year Climate Trends vs Historical


Max Temperature this Year | 1 of 6
Climate 12-Month Moving Averages


Max Temperature 12-Month MA | 1 of 6
Daily Data Points and Averages Throughout the Year


Average Max Temperature Throughout Year | 1 of 5
