Climate for Station: Hon, Al Jufra District, Libya
Loading live weather...
Climate Analysis & Overview
Hon, located in the heart of Libya's desert, is experiencing a warming trend, particularly in nighttime temperatures, with significant changes in precipitation patterns. These shifts reflect broader regional climate challenges as Libya seeks to adapt to increasing variability and extremes.
Desert Climate Dynamics
Hon, situated at 29.12°N, 15.95°E, falls under the BWh classification of the Köppen climate system, indicative of a hot desert climate. The vast expanses of the Sahara Desert profoundly influence its weather patterns, with minimal vegetation and water bodies to moderate temperatures or precipitation. This geographical context sets the stage for extreme temperature records, with an all-time high of 47.6°C (117.7°F) and a chilling low of -8.0°C (17.6°F).
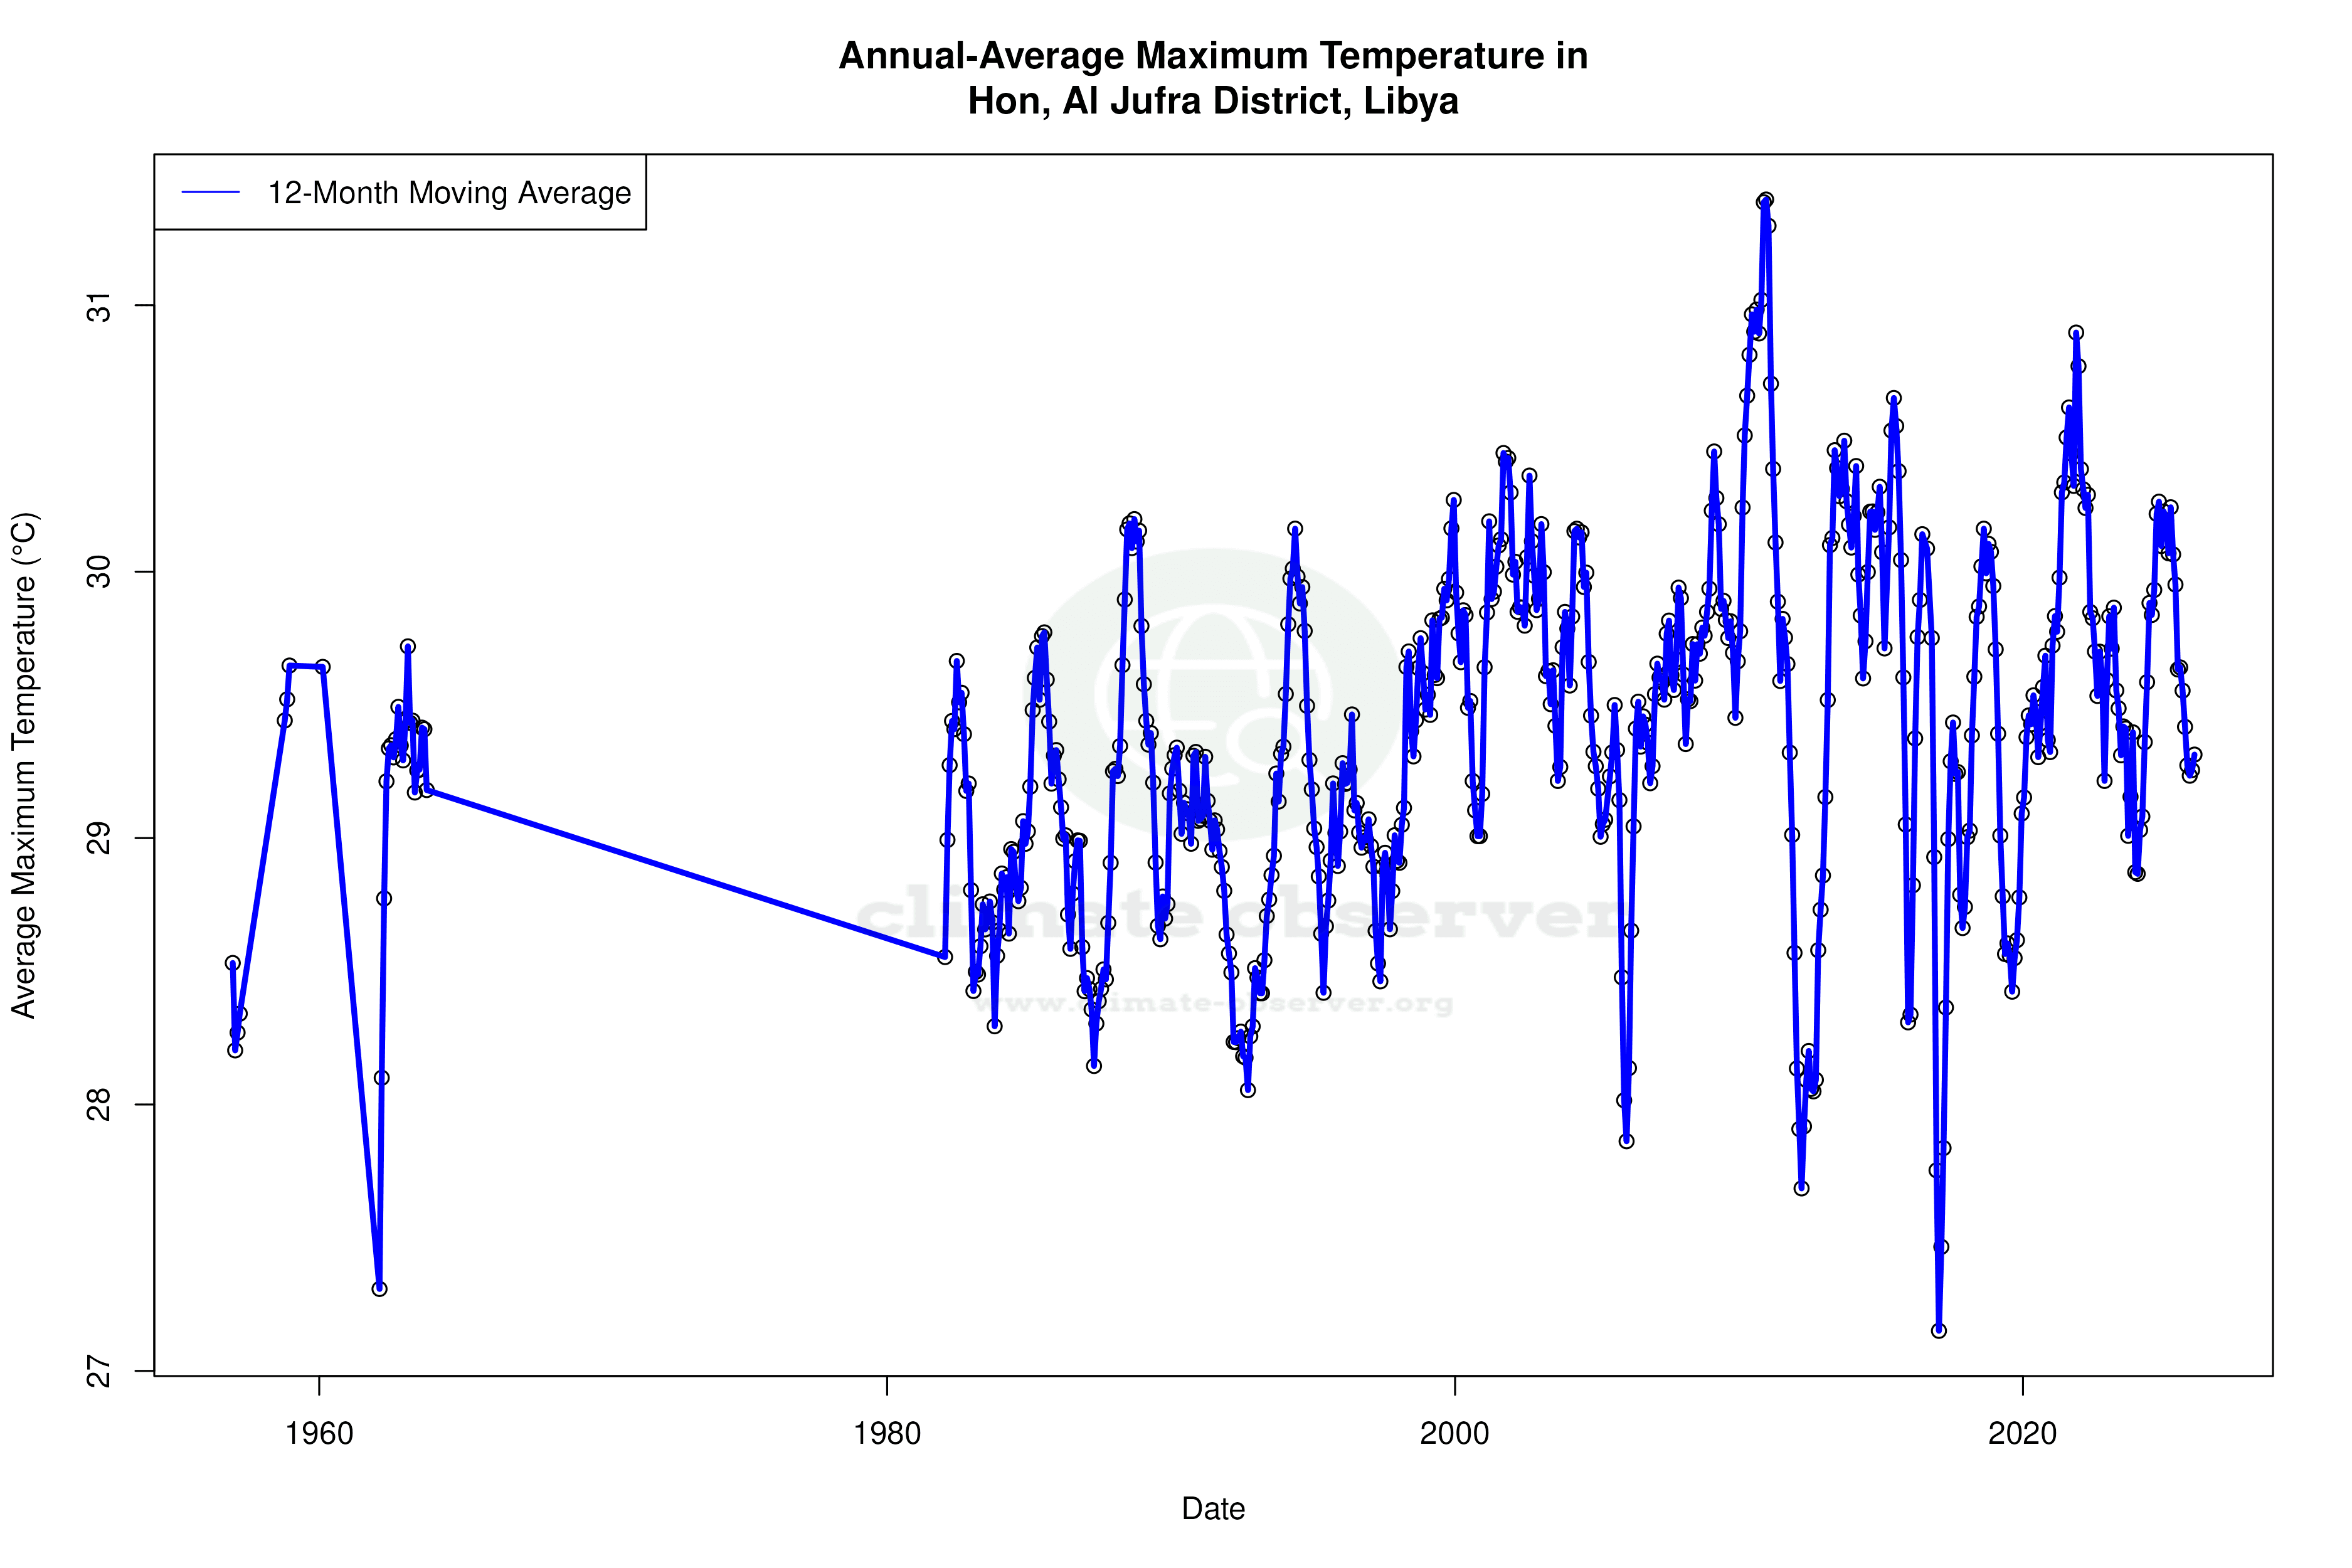
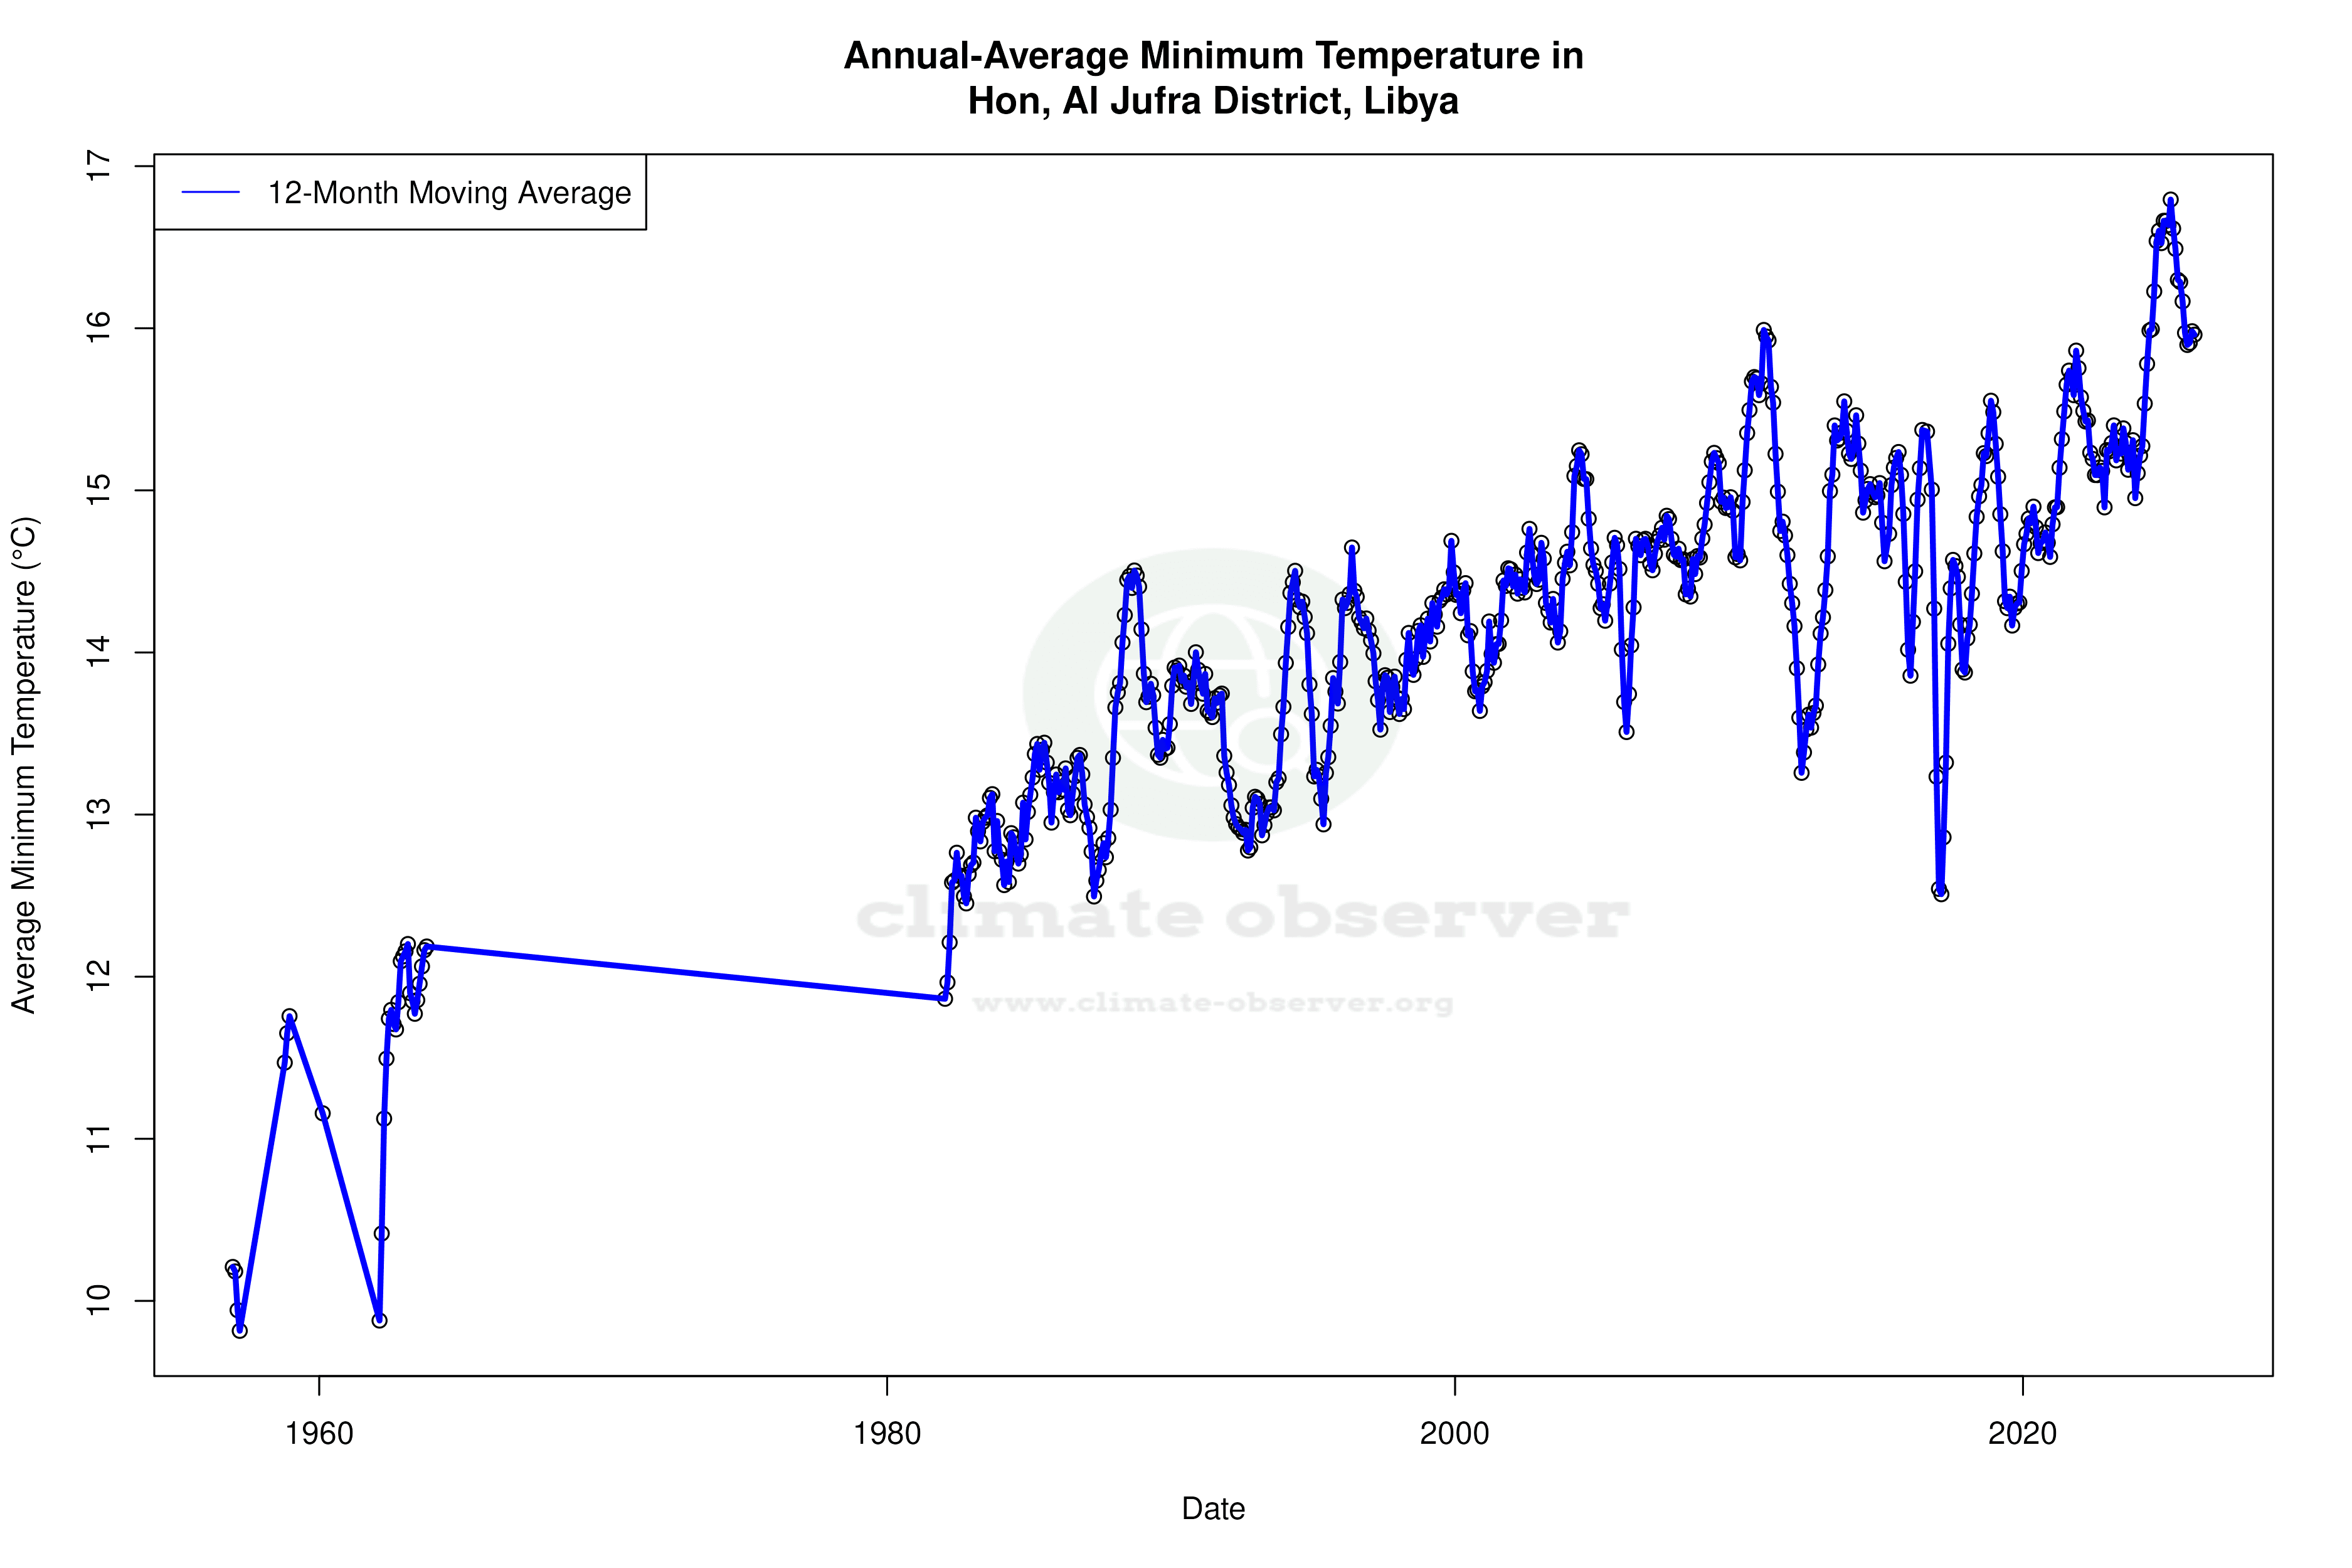
Warming Trends in Temperature Extremes
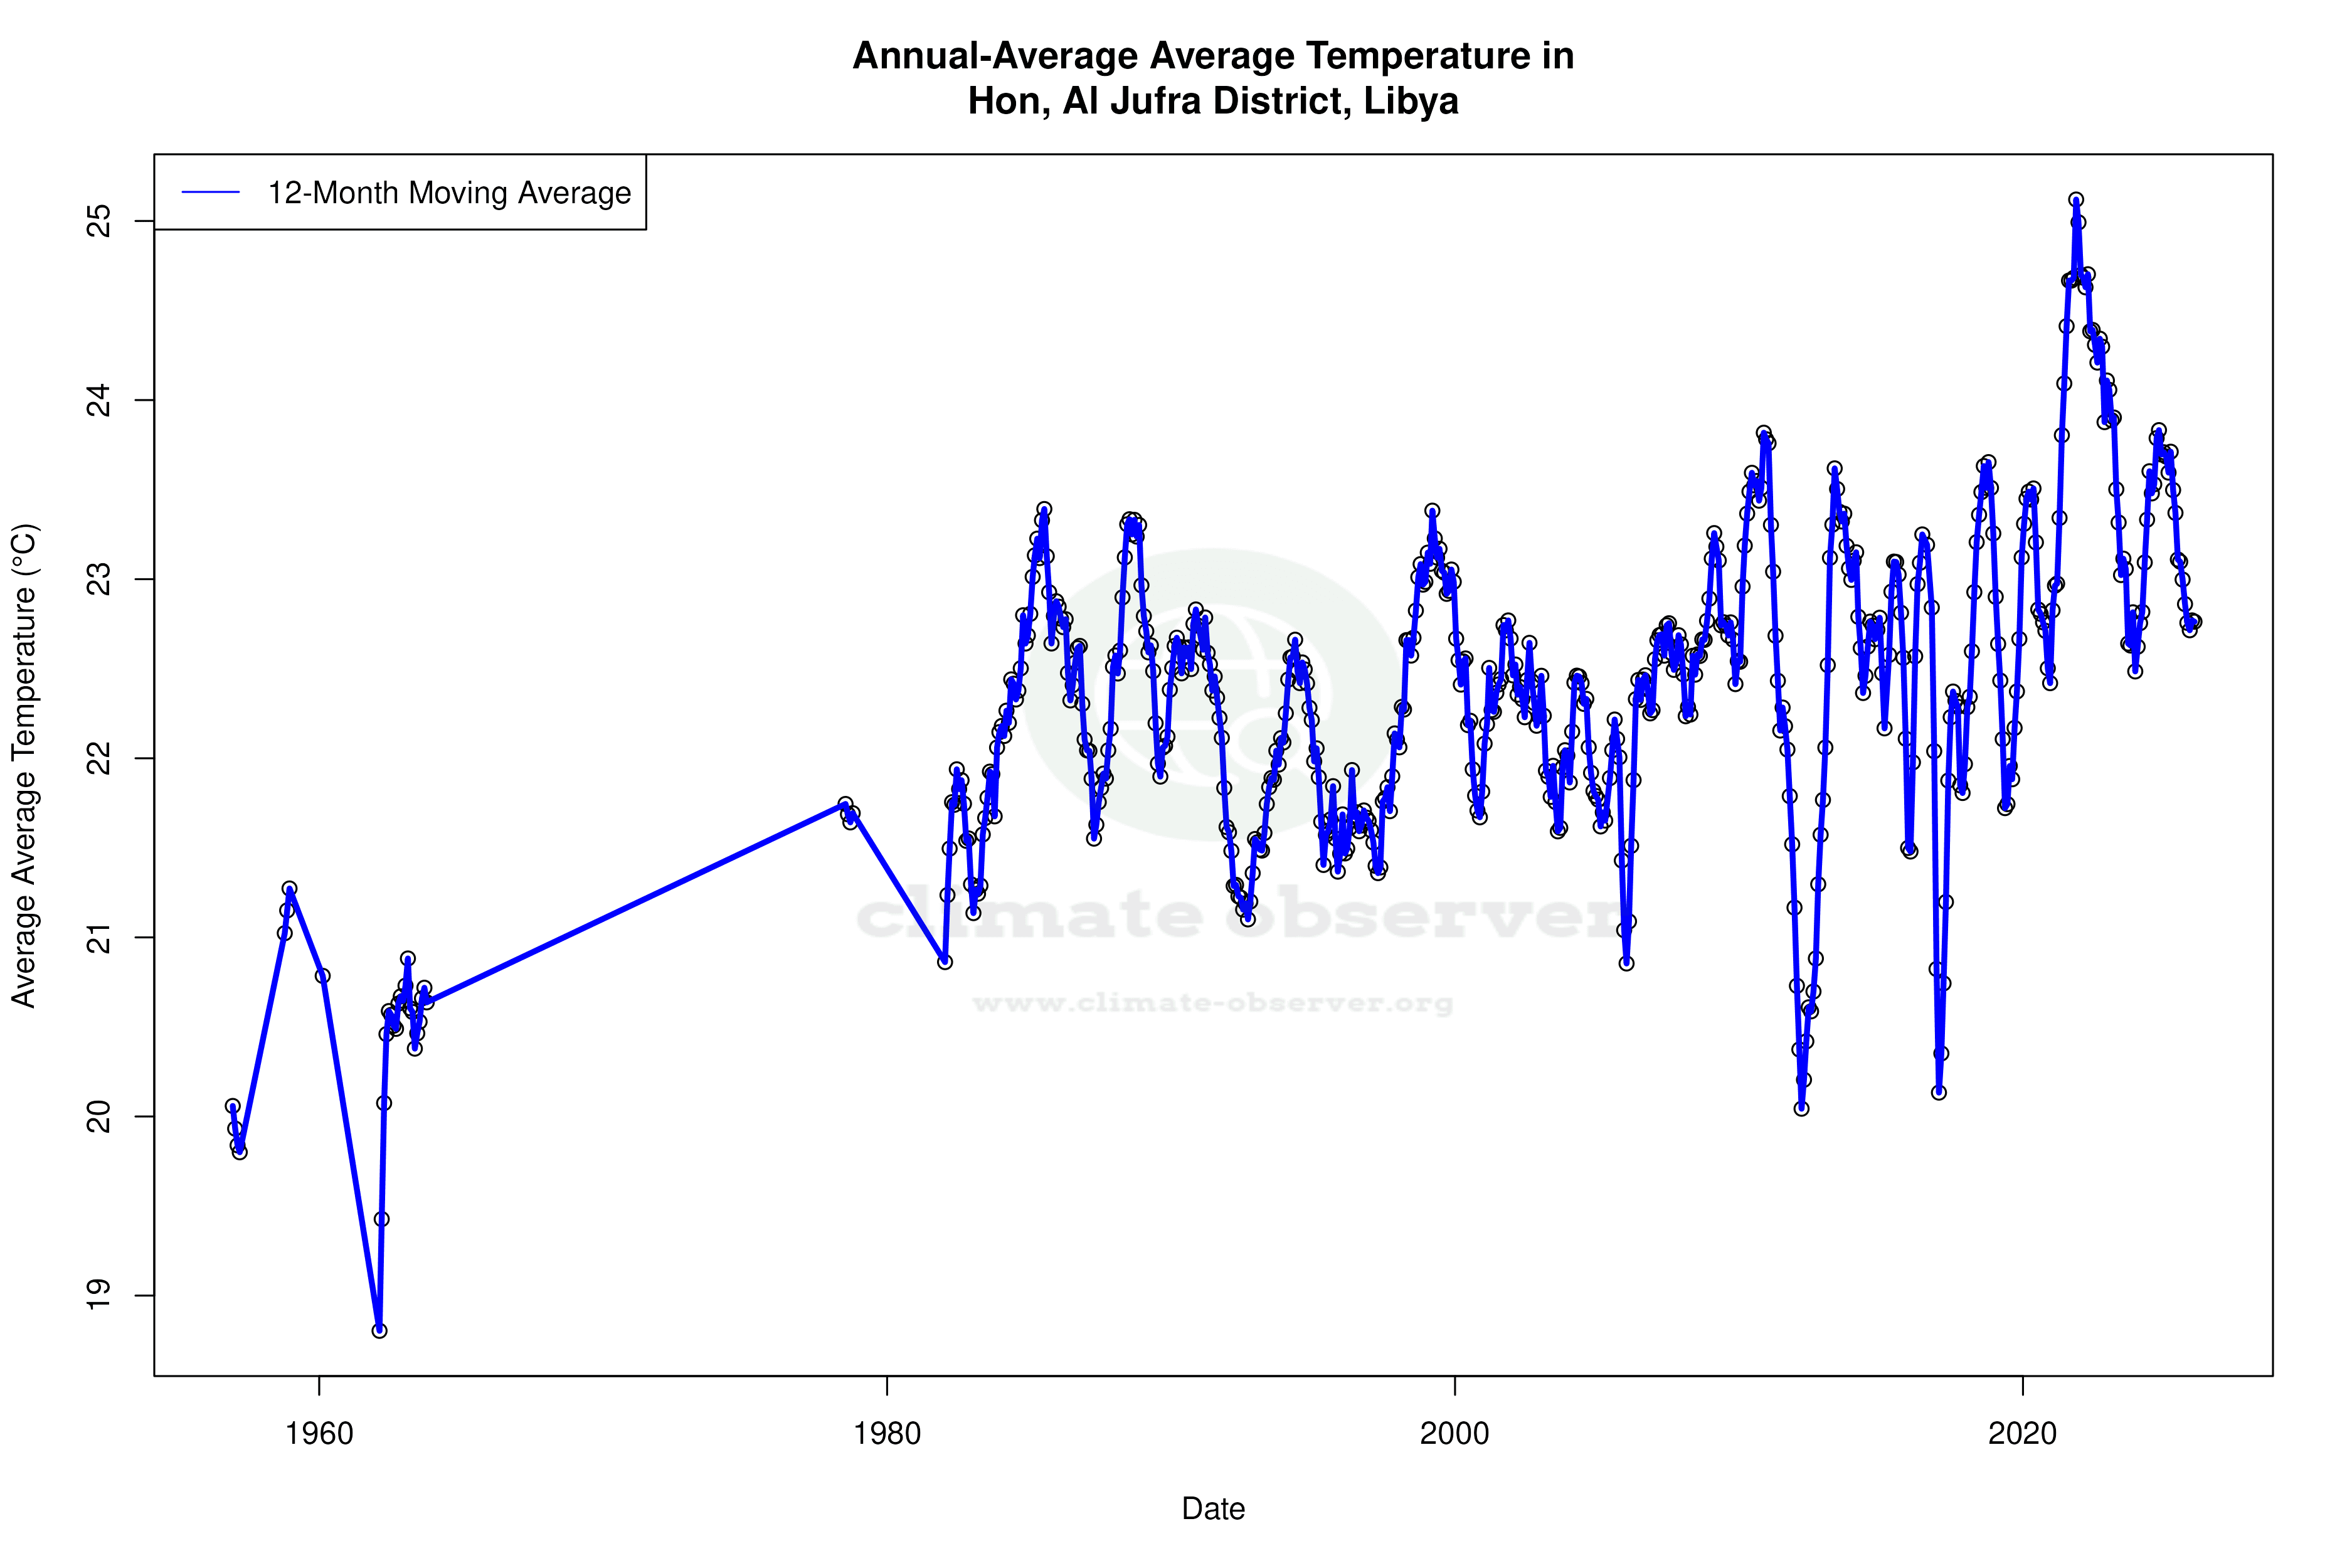
The temperature trends in Hon reveal a nuanced narrative of warming. Over the last decade, the region has experienced a rise in high temperatures by 0.16°C (0.29°F), while low temperatures have surged by a more pronounced 1.60°C (2.88°F). These figures suggest that while daytime temperatures are climbing steadily, nighttime temperatures are increasing at a much faster rate, which could exacerbate heat stress and impact local ecosystems. When considering the all-time trends, highs have risen by 0.15°C (0.27°F) and lows by 0.62°C (1.12°F), underscoring a persistent warming trend over a longer period.
Precipitation Patterns: A Shift Towards Even Distribution
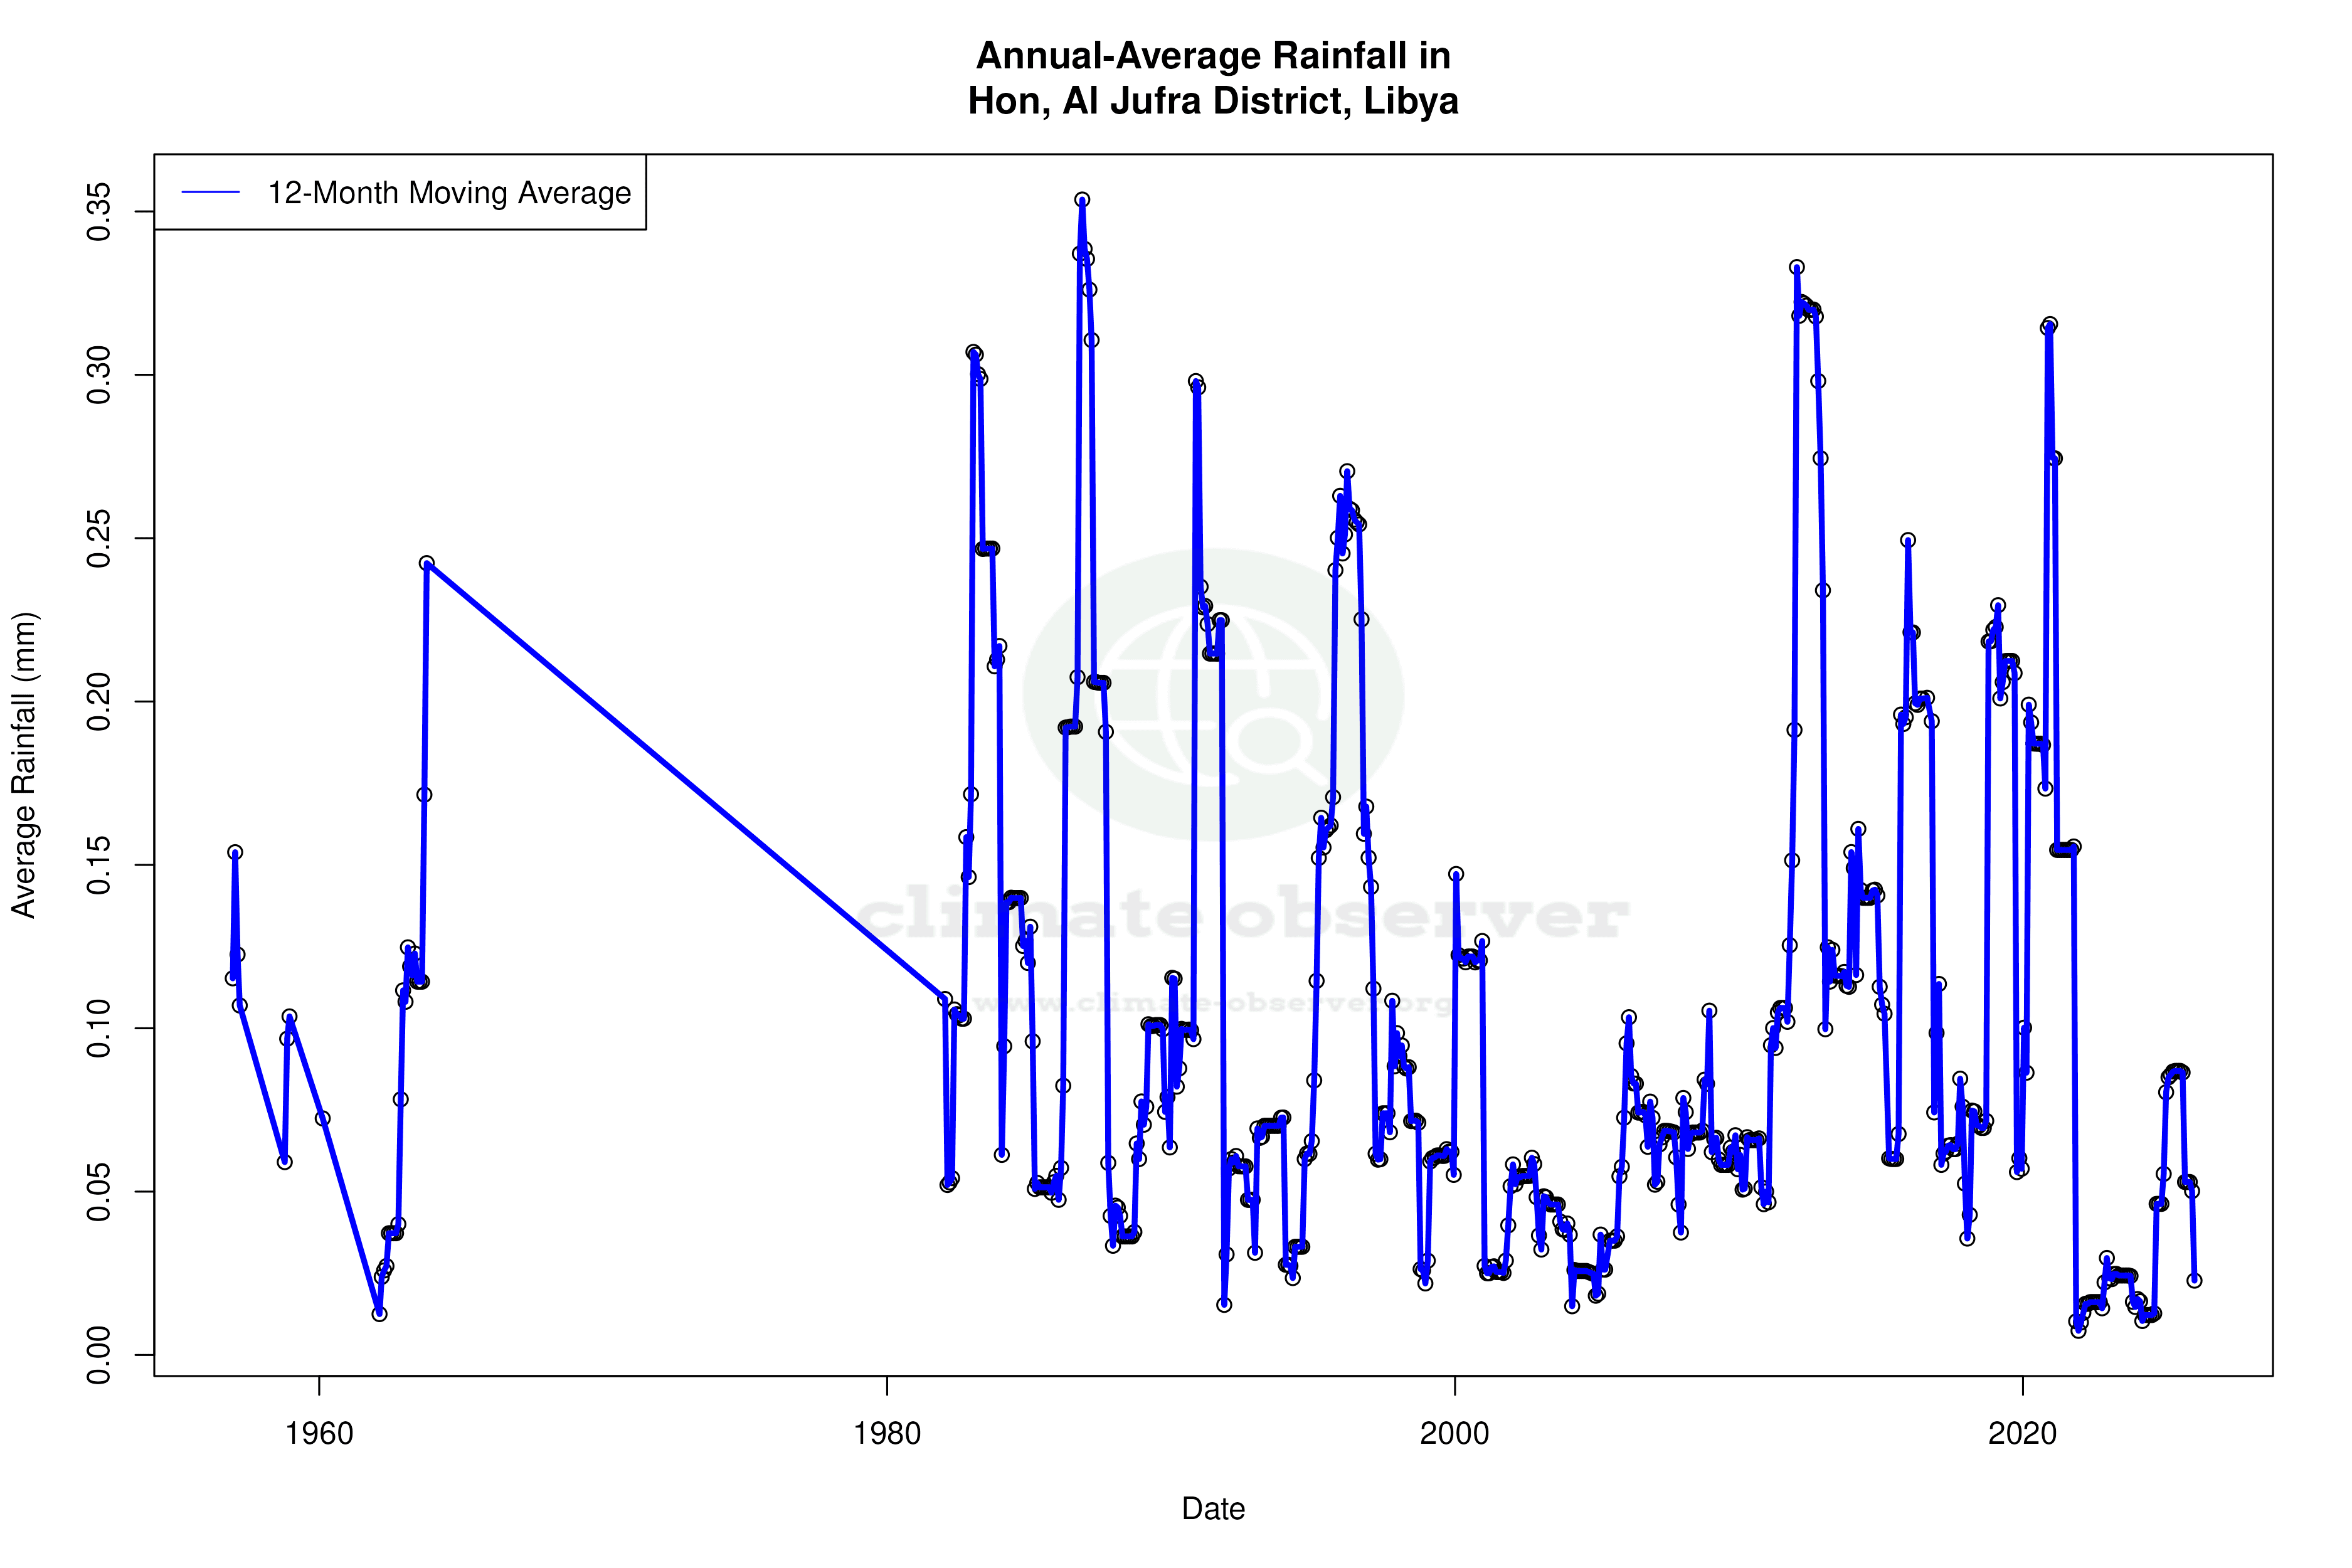
The Precipitation Concentration Index (PCI) offers insight into how rainfall is distributed throughout the year. Hon's PCI has decreased from a baseline of 33.9 to a current value of 27.4, indicating a more even distribution of rainfall events over time. This shift could suggest a reduction in the frequency of intense, isolated downpours, which are characteristic of desert climates, potentially leading to less severe flooding events.
Regional Climate Implications
These climatic shifts in Hon are emblematic of broader regional trends as Libya grapples with the impacts of climate change. The increased warming, particularly in nighttime temperatures, aligns with global observations of more rapid warming during the night compared to the day. This pattern can have significant implications for water resources, agriculture, and human health in the region. As Libya aims to address these challenges, understanding and adapting to these climatic changes will be crucial in ensuring sustainable development and resilience against future climate variability.
Adapting to Changing Extremes
In the context of Libya's regional climate goals, the data from Hon highlights the importance of developing strategies to mitigate the impacts of rising temperatures and shifting precipitation patterns. With an eye on sustainability, efforts to enhance water management, improve agricultural practices, and bolster infrastructure resilience will be key to navigating the evolving climate landscape of this desert region.
Station Statistics
10-Year Trend
High: +0.15 °F/decade
Low: +2.98 °F/decade
Rain: -0.004 in/decade
25-Year Trend
High: -0.14 °F/decade
Low: +0.88 °F/decade
Rain: +0.001 in/decade
50-Year Trend
High: +0.32 °F/decade
Low: +1.08 °F/decade
Rain: -0.000 in/decade
All-Time Trend
High: +0.26 °F/decade
Low: +1.12 °F/decade
Rain: -0.000 in/decade
Percentage Above-Average Days
Last 12 Months: 49.4%
This Year: 51.7%
Precipitation Concentration Index (PCI) ℹ️
Last 12 Months: 42.9
Historical Average: 35.7
Percentile Rank of Last 12 Months ℹ️
High: 50th percentile
Low: 97th percentile
Rain: 36th percentile
Change in Variance ℹ️
High: -0.9%
Low: +1.8%
Intraday: -27.4%
Data Coverage
80.1%
First Year of Data
1956
Station Location
Historical Weather Records
| Max High | Avg High | Min High | Max Avg | Avg Avg | Min Avg | Max Low | Avg Low | Min Low | Max Precipitation | Avg Precipitation | Max Snow | Avg Snow | |
|---|---|---|---|---|---|---|---|---|---|---|---|---|---|
| Record | 117.68 °F | — | 46.04 °F | 108.14 °F | — | 33.80 °F | 91.40 °F | — | 17.60 °F | 1.87 in | — | — | — |
| January | 88.70 °F | 65.39 °F | 47.79 °F | 77.90 °F | 53.32 °F | 33.80 °F | 64.40 °F | 40.34 °F | 17.60 °F | 0.97 in | 0.01 in | — | — |
| February | 97.88 °F | 69.36 °F | 49.98 °F | 90.68 °F | 56.89 °F | 40.64 °F | 69.80 °F | 42.50 °F | 19.40 °F | 0.66 in | 0.01 in | — | — |
| March | 104.00 °F | 76.91 °F | 51.49 °F | 91.22 °F | 63.70 °F | 44.78 °F | 76.64 °F | 48.10 °F | 26.06 °F | 1.68 in | 0.01 in | — | — |
| April | 110.30 °F | 86.10 °F | 61.70 °F | 94.82 °F | 72.09 °F | 51.39 °F | 84.20 °F | 55.83 °F | 35.06 °F | 1.49 in | 0.00 in | — | — |
| May | 116.96 °F | 93.46 °F | 67.15 °F | 104.54 °F | 79.80 °F | 56.84 °F | 88.70 °F | 63.09 °F | 34.34 °F | 0.76 in | 0.00 in | — | — |
| June | 117.68 °F | 99.75 °F | 78.30 °F | 108.14 °F | 85.91 °F | 63.68 °F | 91.40 °F | 68.64 °F | 48.20 °F | 0.20 in | 0.00 in | — | — |
| July | 116.96 °F | 99.71 °F | 86.00 °F | 105.08 °F | 86.18 °F | 72.32 °F | 86.63 °F | 69.52 °F | 53.60 °F | 0.01 in | 0.00 in | — | — |
| August | 115.23 °F | 99.44 °F | 87.80 °F | 105.08 °F | 86.27 °F | 72.68 °F | 86.04 °F | 70.11 °F | 50.00 °F | 0.05 in | 0.00 in | — | — |
| September | 114.80 °F | 96.33 °F | 73.04 °F | 104.54 °F | 83.27 °F | 66.02 °F | 85.10 °F | 68.13 °F | 50.00 °F | 0.79 in | 0.00 in | — | — |
| October | 109.40 °F | 87.65 °F | 67.33 °F | 93.92 °F | 75.12 °F | 58.46 °F | 81.50 °F | 61.15 °F | 39.56 °F | 1.87 in | 0.01 in | — | — |
| November | 98.44 °F | 77.13 °F | 55.04 °F | 87.62 °F | 64.70 °F | 48.92 °F | 74.30 °F | 50.91 °F | 30.20 °F | 1.52 in | 0.01 in | — | — |
| December | 92.12 °F | 67.37 °F | 46.04 °F | 79.16 °F | 55.46 °F | 38.12 °F | 69.98 °F | 42.78 °F | 21.02 °F | 0.72 in | 0.01 in | — | — |
Data Visualisations
Remove WatermarksCurrent Year Climate Trends vs Historical


Max Temperature this Year | 1 of 6
Climate 12-Month Moving Averages


Max Temperature 12-Month MA | 1 of 6
Daily Data Points and Averages Throughout the Year
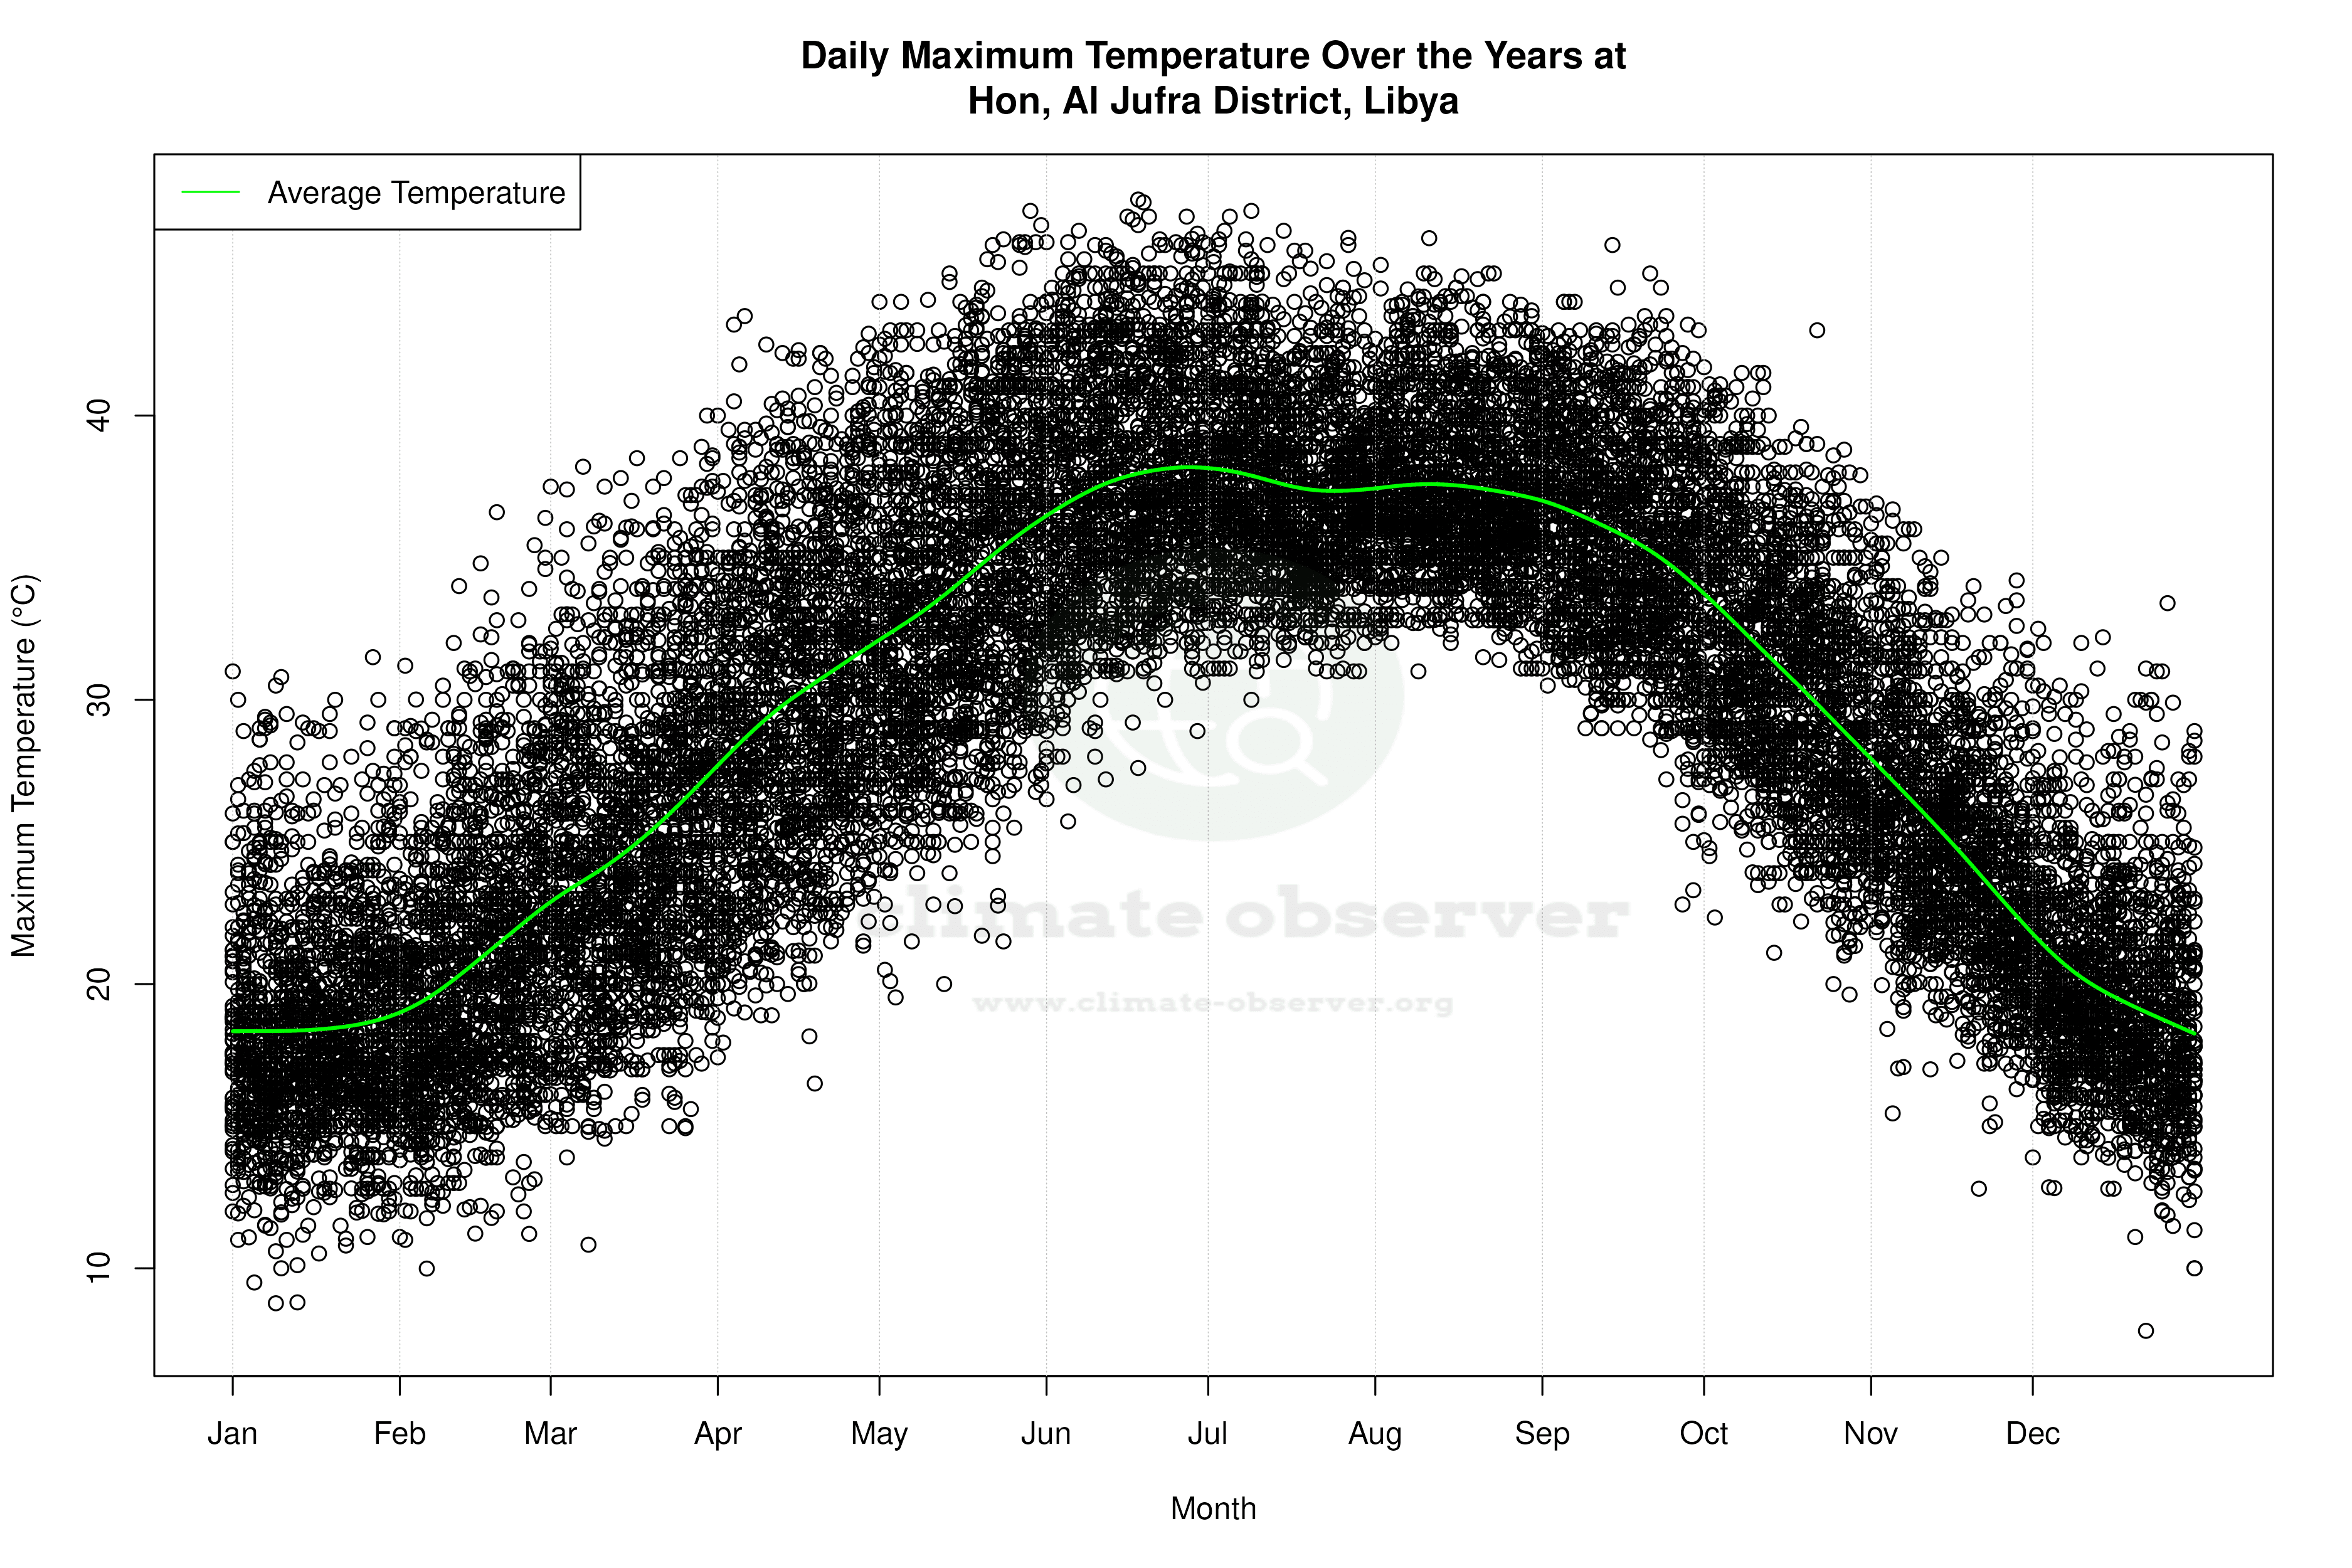
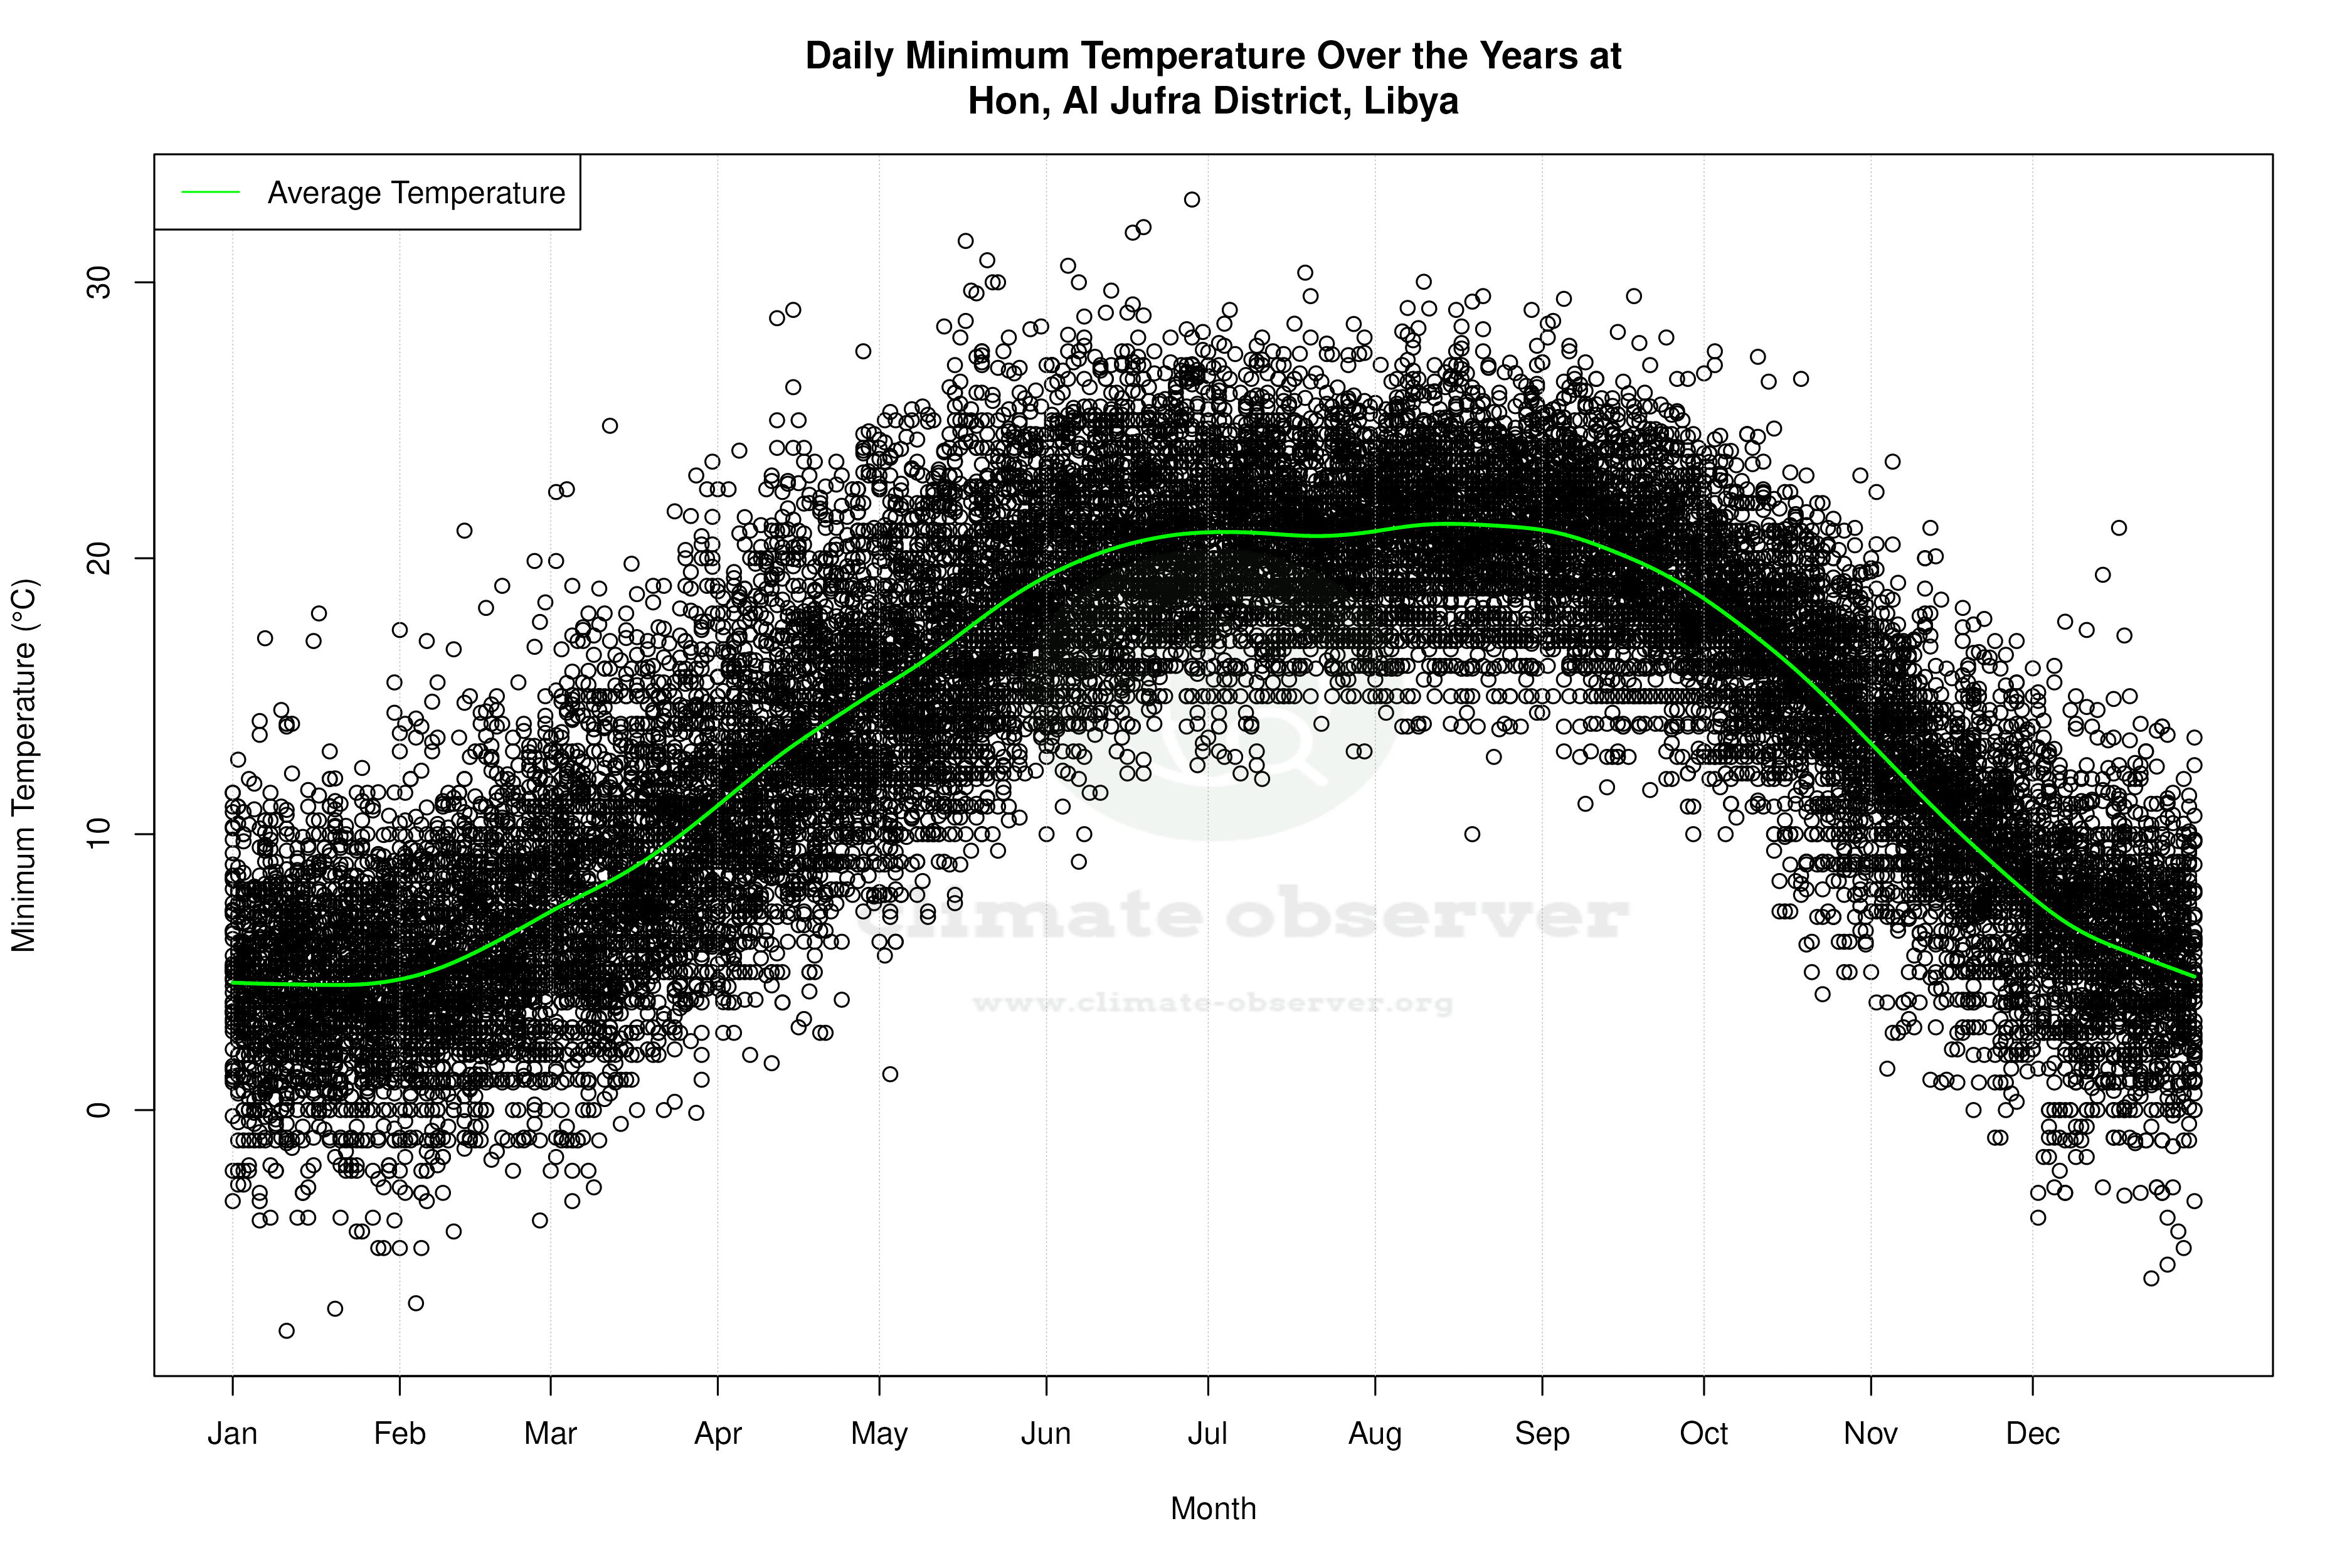
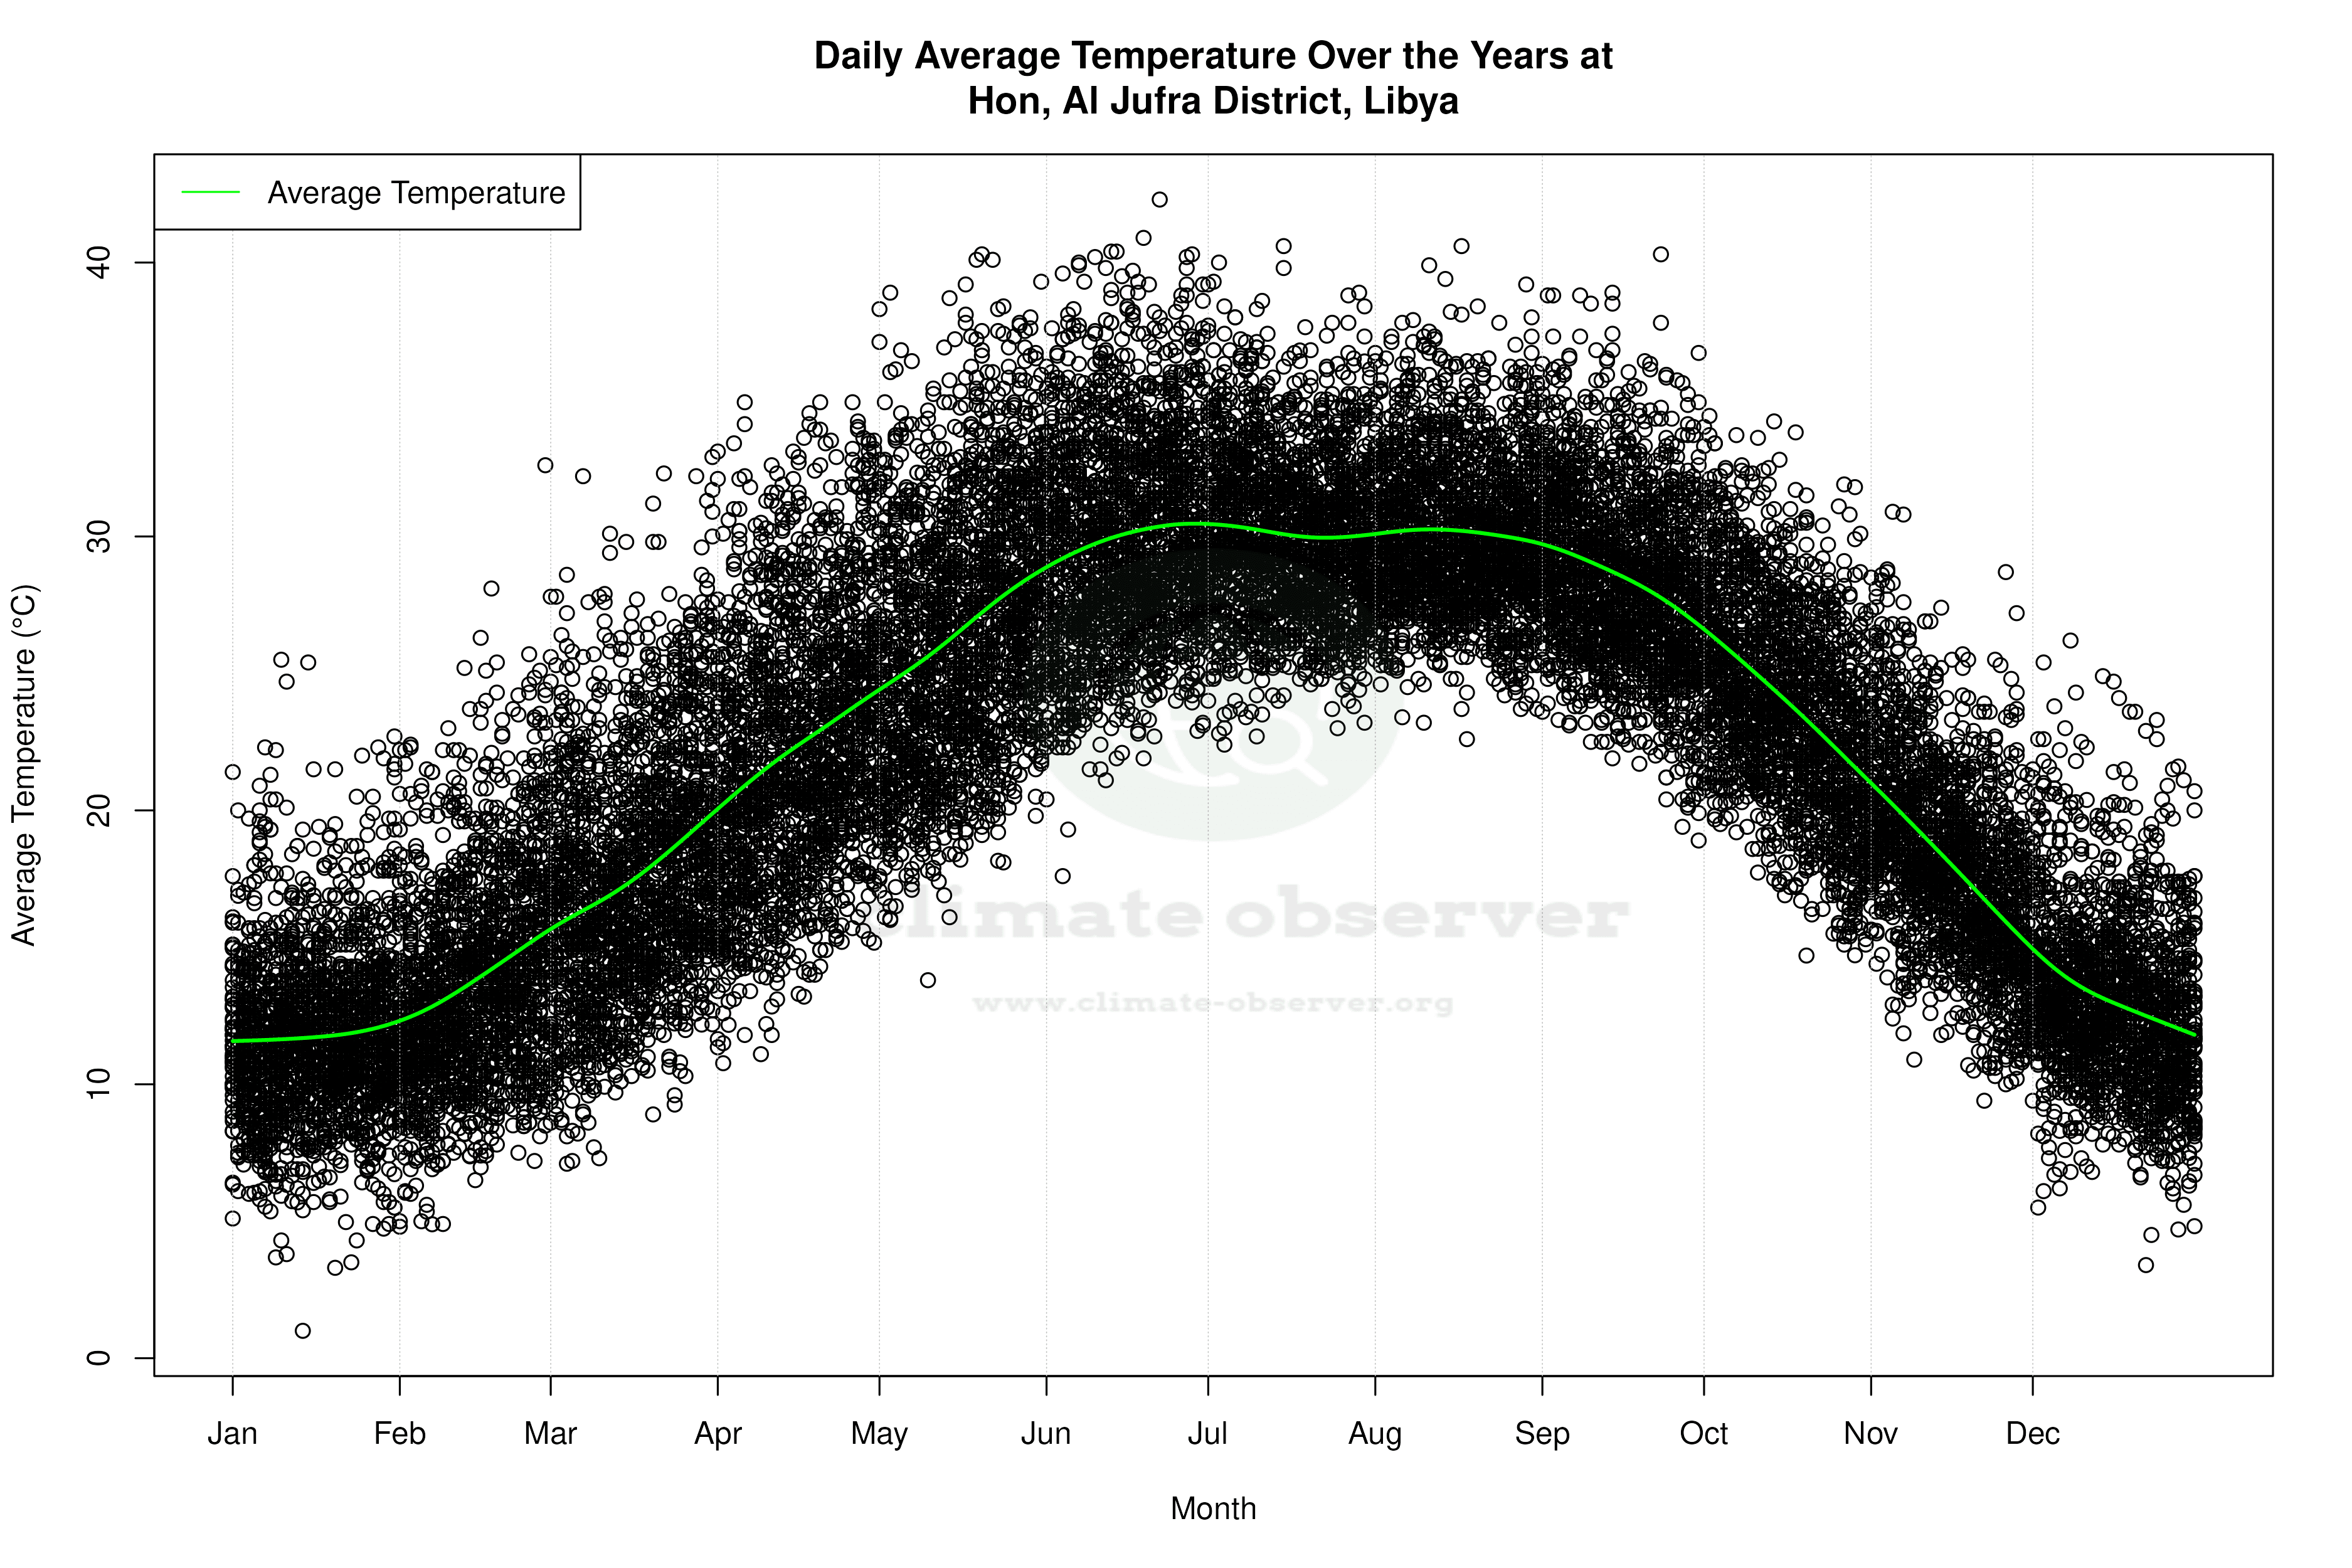


Average Max Temperature Throughout Year | 1 of 5
