Climate for Station: Kufra, Al Kufra District, Libya
Loading live weather...
Climate Analysis & Overview
Kufra, Libya, is experiencing notable climatic shifts characterized by a significant warming of its lows by 2.82°C (5.07°F) over the past decade, alongside a more even distribution of precipitation. These changes reflect broader regional climate trends and pose challenges to local adaptation strategies.
Desert Climate Dynamics
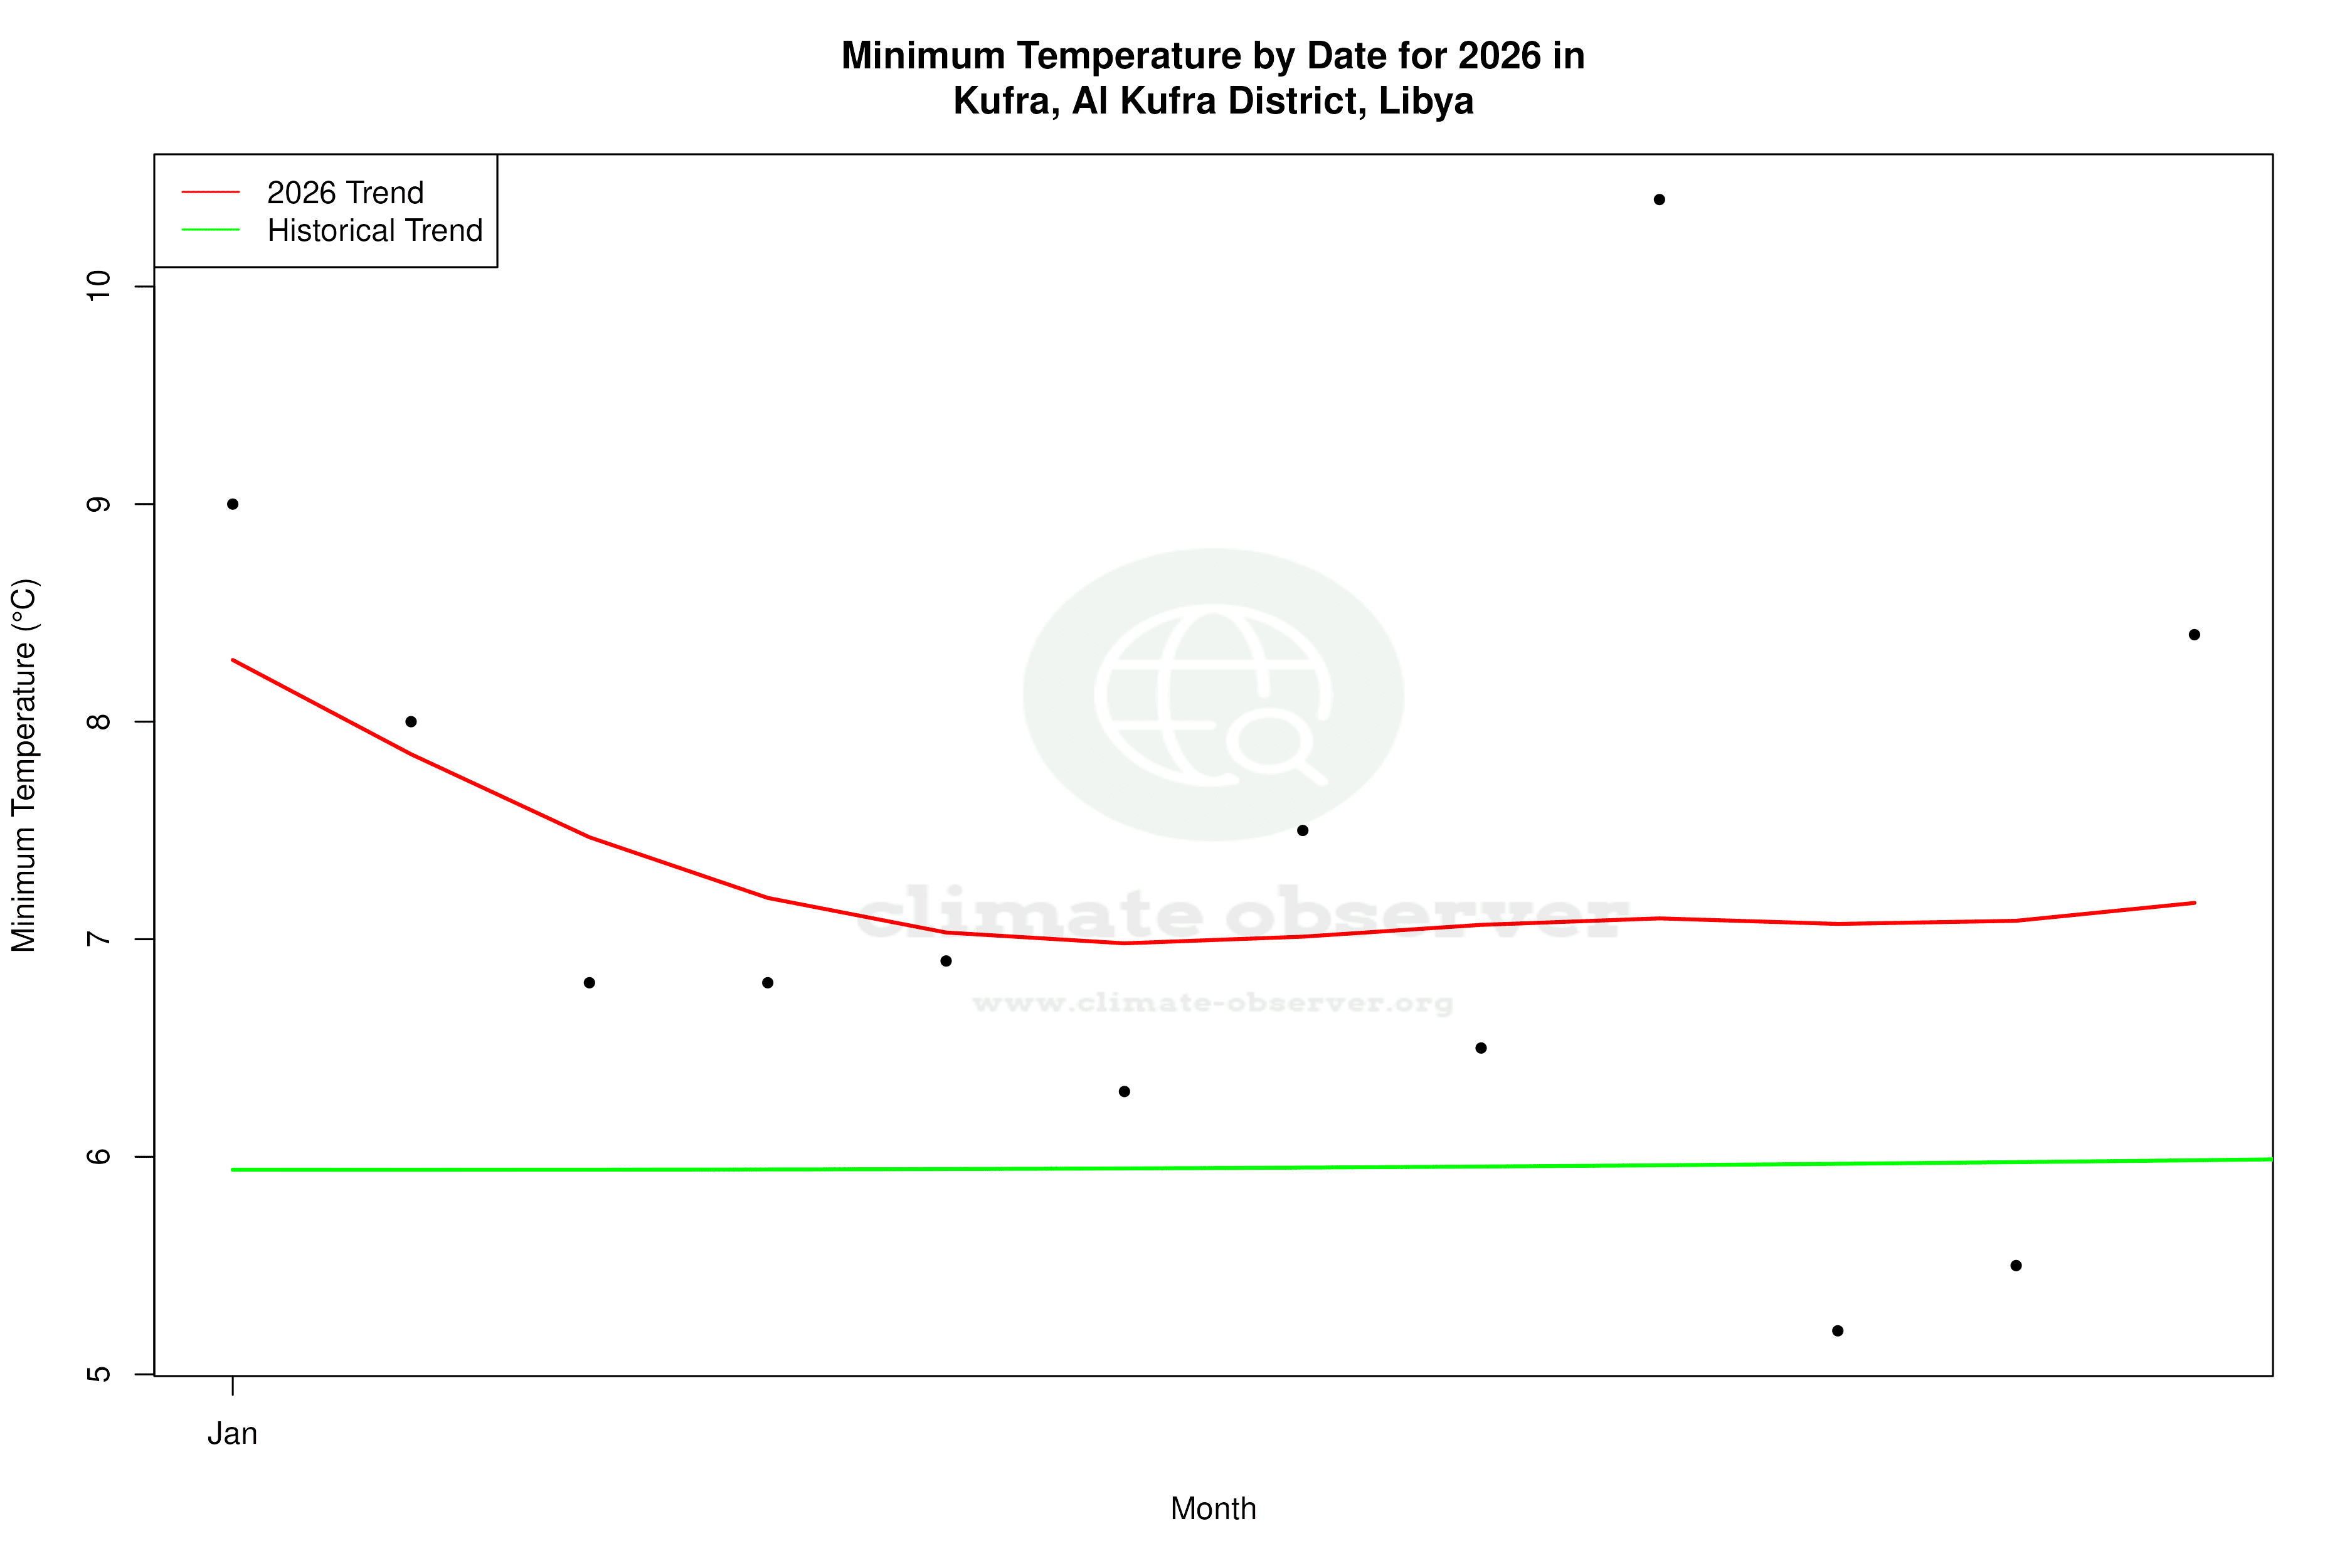
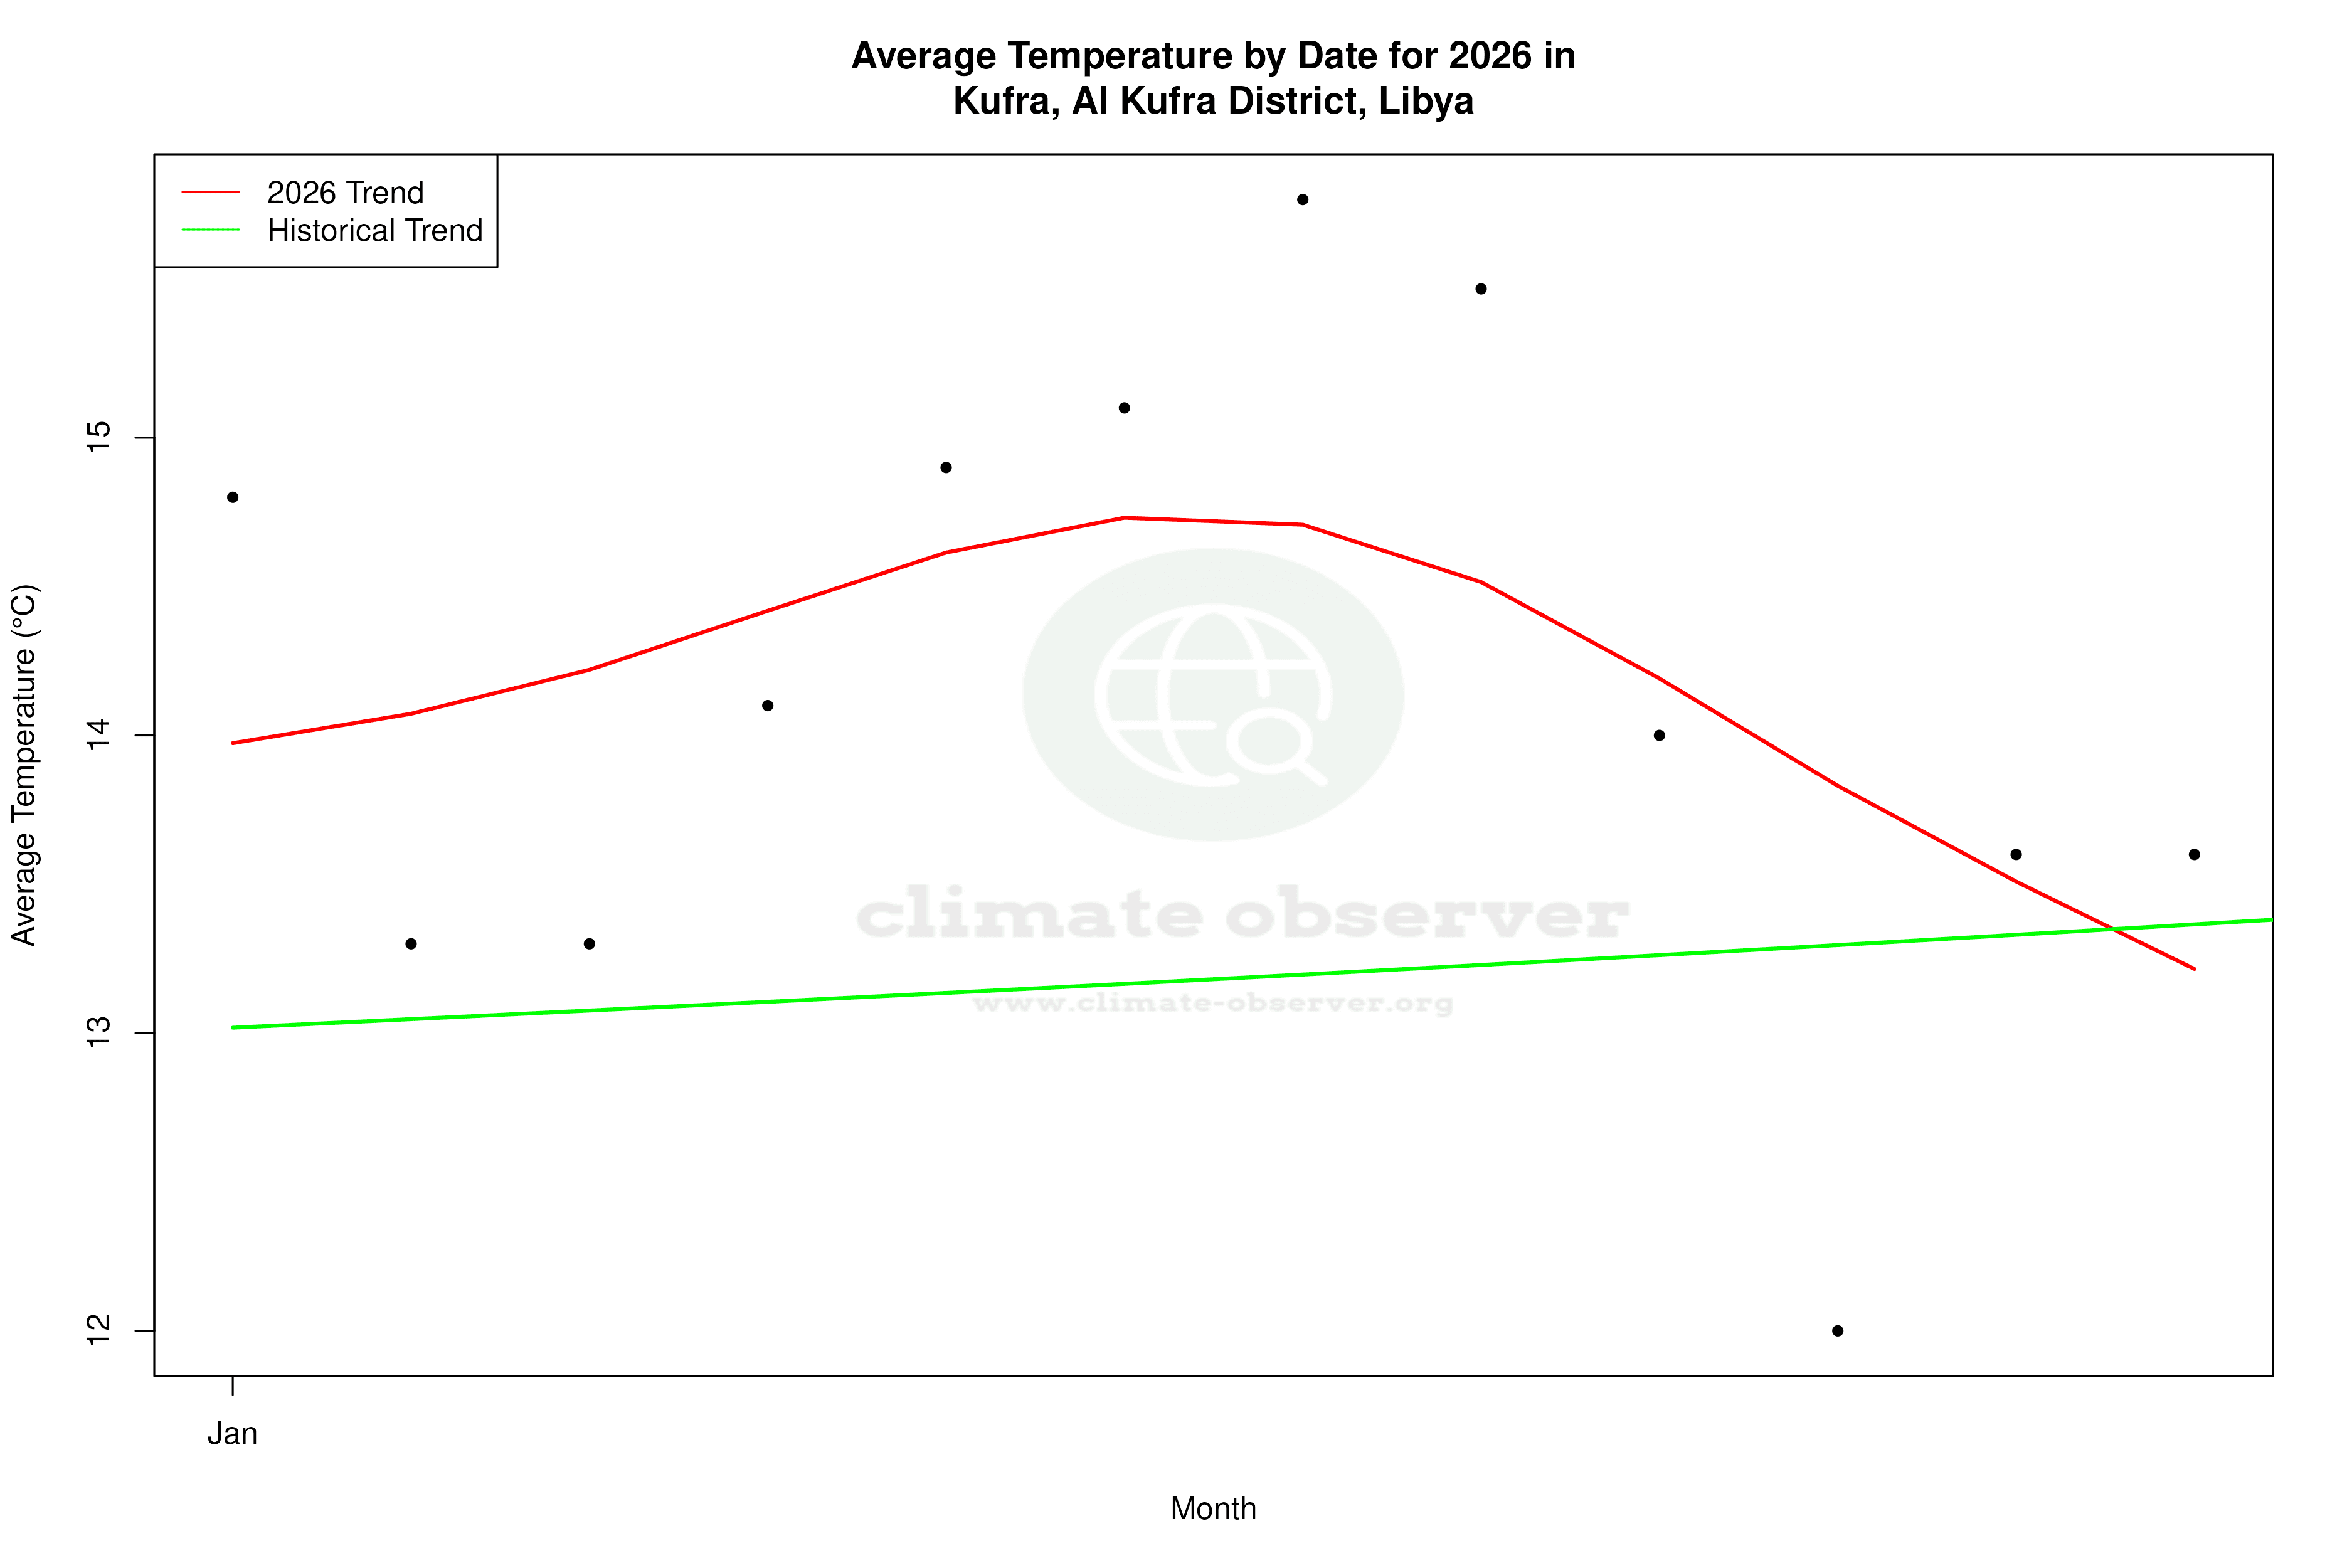
Kufra, located in the heart of Libya's desert, is classified under the Köppen climate system as a hot desert climate (BWh). This classification is marked by extreme temperatures and scarce rainfall. The station's geographical positioning in the Libyan Desert means it is largely influenced by arid conditions, with minimal moderating effects from bodies of water or significant topographical features. The all-time temperature trends reveal a 0.21°C (0.38°F) rise in highs and a 0.46°C (0.83°F) increase in lows, indicating a gradual warming over the long term. However, the past decade has seen a more pronounced increase in lows by 2.82°C (5.07°F), suggesting a shift towards warmer nights.
Thermal Extremes and Records
Kufra's climate is characterized by extreme temperatures, with recorded highs reaching up to 49.1°C (120.4°F) and lows dropping to -2.2°C (28.0°F). These records underscore the harsh thermal conditions typical of desert environments. The recent decade's warming trend in lows suggests an intensification of nighttime temperatures, which can exacerbate heat stress and impact local ecosystems and human activities.
Precipitation Patterns and PCI
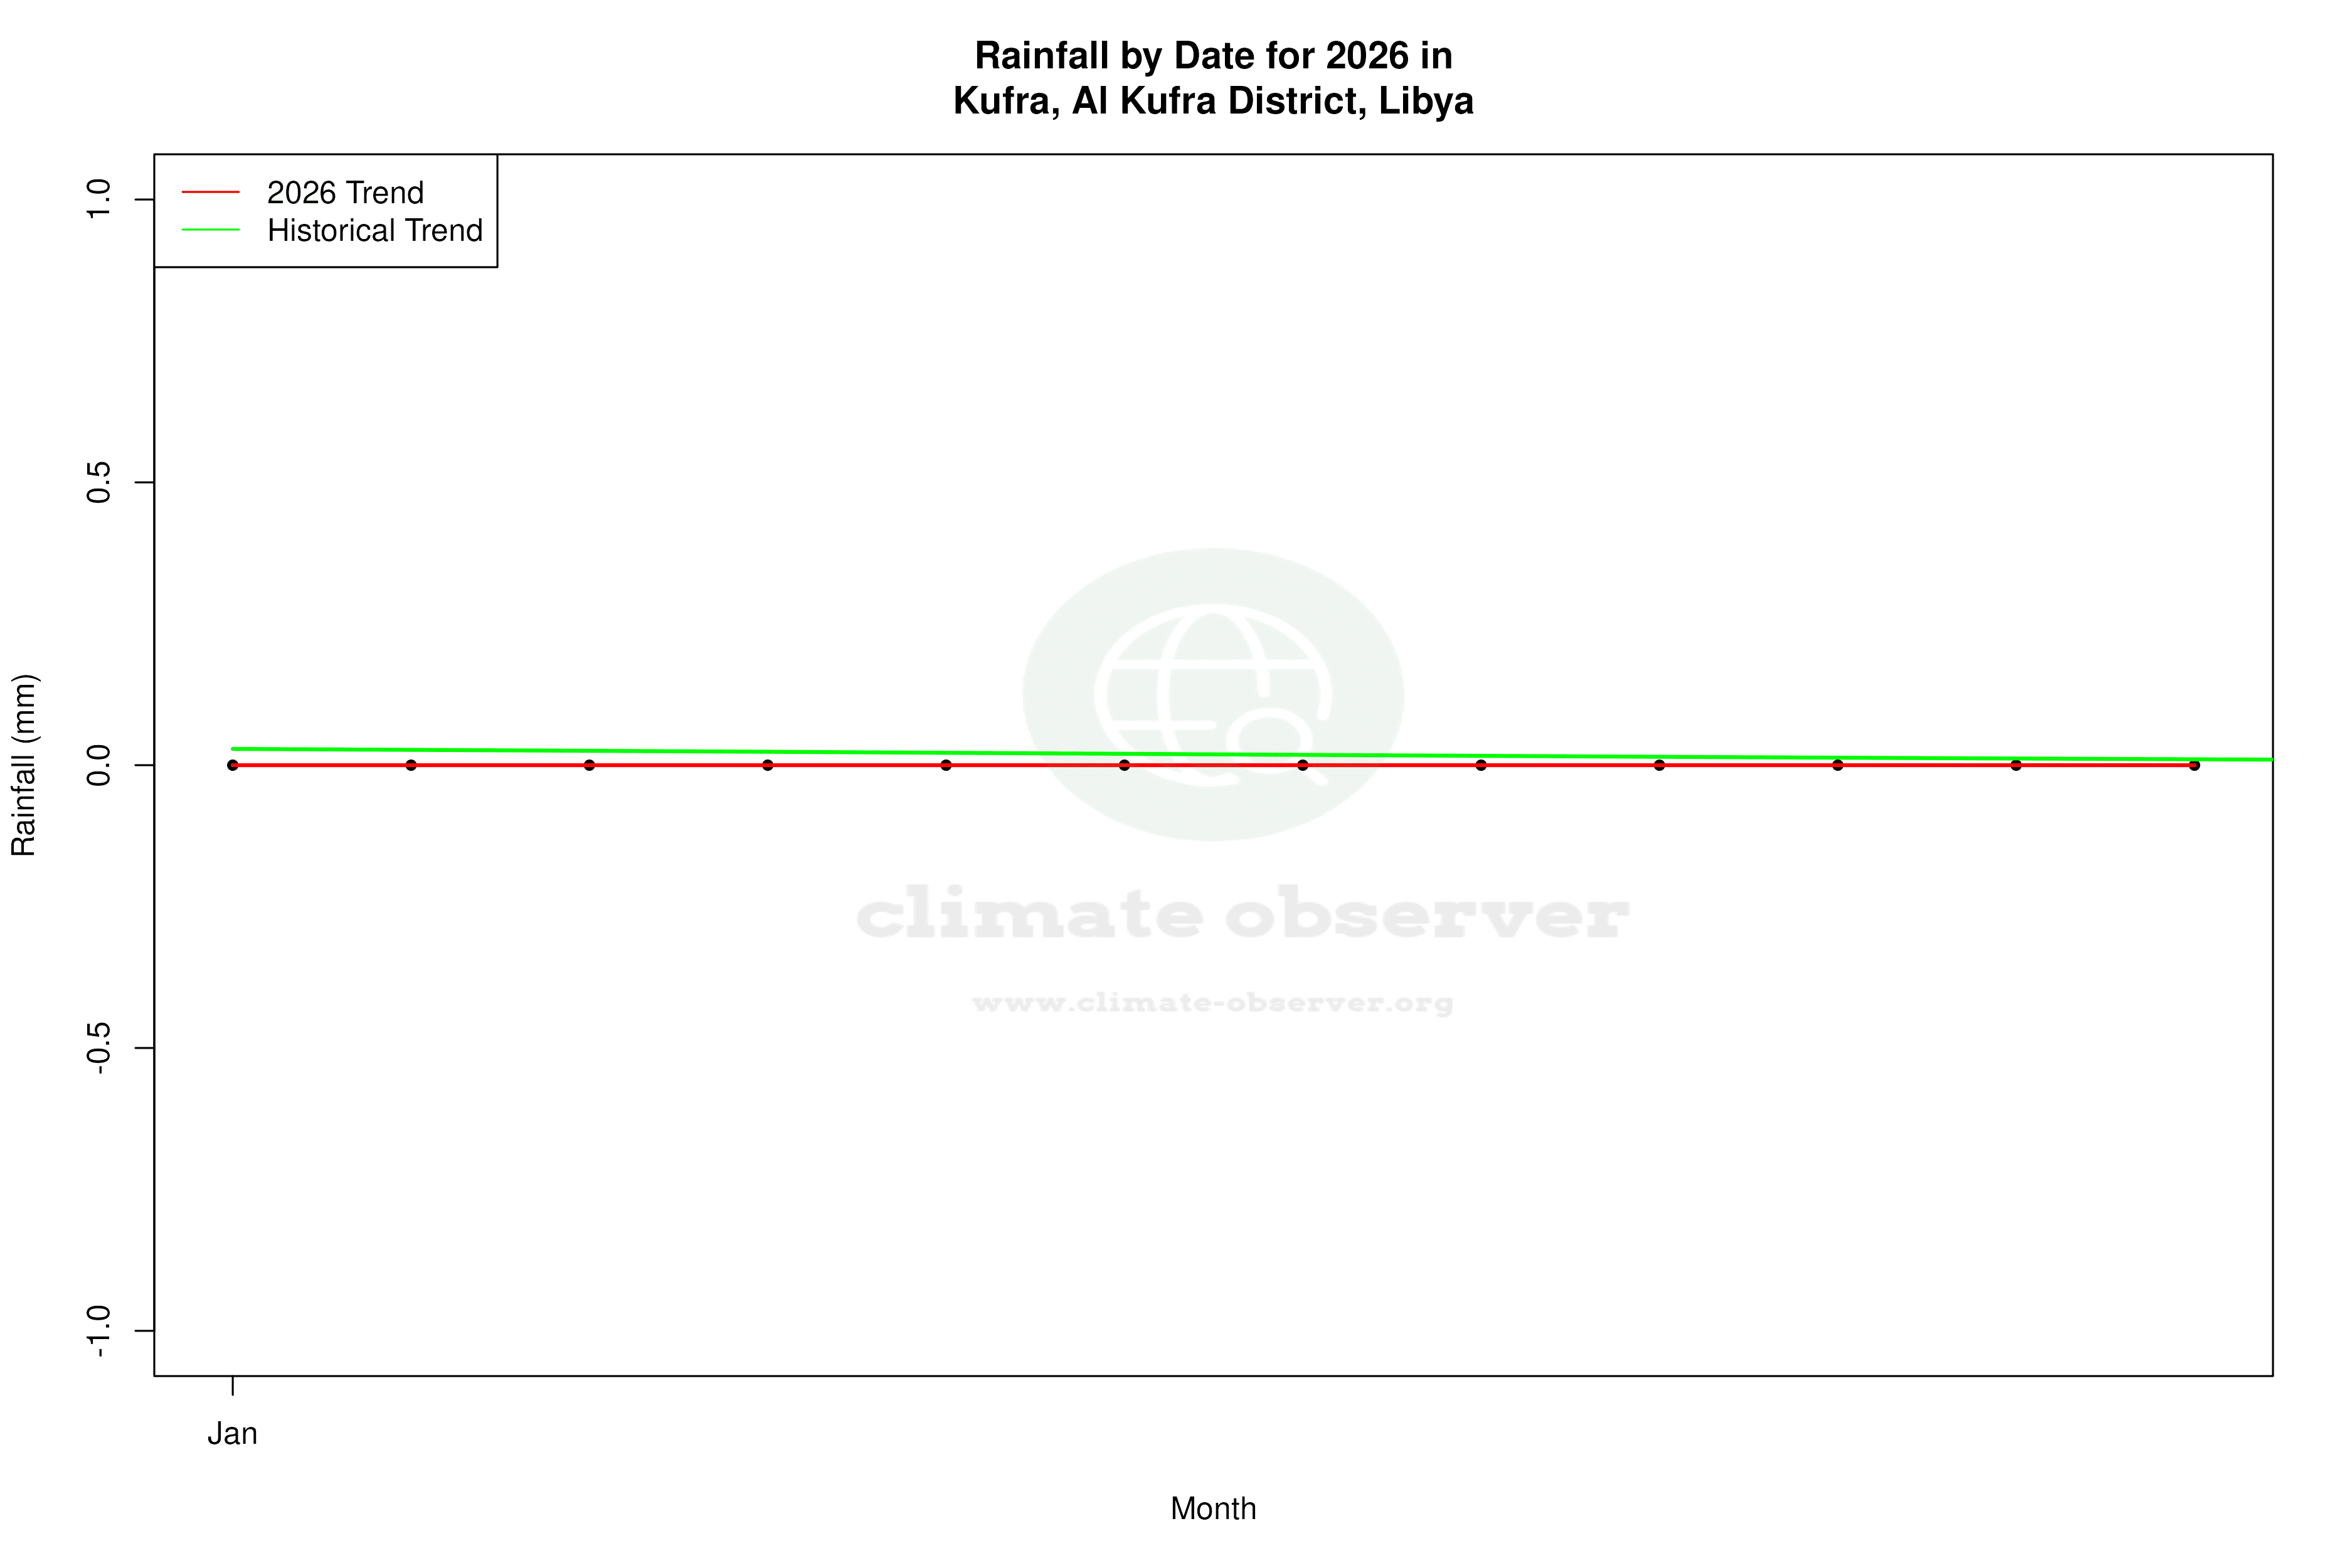
The Precipitation Concentration Index (PCI) for Kufra has decreased from a baseline of 60.9 to a current value of 44.9. This indicates a significant shift towards a more even distribution of rainfall events, although the overall volume remains low. In desert climates, such changes can influence water resource management and agricultural practices, as more evenly distributed precipitation can enhance soil moisture retention and reduce the risk of flash flooding.
Regional Climate Implications
The climatic changes observed in Kufra align with broader regional trends in North Africa, where warming temperatures and altered precipitation patterns are becoming more prevalent. Libya's climate goals, which focus on adaptation and resilience, must consider these shifts to effectively manage water resources and agricultural productivity. The warming lows and more evenly distributed rainfall present both challenges and opportunities for local communities to adapt to a changing climate.
Interpreting the 10-Year Trends
While the all-time trends show a modest warming, the past decade reveals a stark contrast with a 1.03°C (1.85°F) rise in highs and a 2.82°C (5.07°F) increase in lows. This divergence highlights the importance of short-term data in understanding rapid climatic shifts, which may not yet be fully captured in long-term averages. Such insights are crucial for developing timely adaptation strategies in response to evolving climate conditions.
Station Statistics
10-Year Trend
High: +1.42 °F/decade
Low: +3.99 °F/decade
Rain: +0.003 in/decade
25-Year Trend
High: +1.15 °F/decade
Low: +1.46 °F/decade
Rain: +0.001 in/decade
50-Year Trend
High: +0.87 °F/decade
Low: +0.90 °F/decade
Rain: +0.000 in/decade
All-Time Trend
High: +0.43 °F/decade
Low: +0.78 °F/decade
Rain: +0.000 in/decade
Percentage Above-Average Days
Last 12 Months: 50.4%
This Year: 48.8%
Precipitation Concentration Index (PCI) ℹ️
Last 12 Months: 73.0
Historical Average: 70.4
Percentile Rank of Last 12 Months ℹ️
High: 74th percentile
Low: 84th percentile
Rain: 99th percentile
Change in Variance ℹ️
High: +4.3%
Low: +6.6%
Intraday: -13.9%
Data Coverage
79.5%
First Year of Data
1959
Station Location
Historical Weather Records
| Max High | Avg High | Min High | Max Avg | Avg Avg | Min Avg | Max Low | Avg Low | Min Low | Max Precipitation | Avg Precipitation | Max Snow | Avg Snow | |
|---|---|---|---|---|---|---|---|---|---|---|---|---|---|
| Record | 120.38 °F | — | 50.00 °F | 108.50 °F | — | 40.26 °F | 89.60 °F | — | 28.04 °F | 5.68 in | — | — | — |
| January | 91.76 °F | 68.15 °F | 50.00 °F | 80.96 °F | 56.40 °F | 40.26 °F | 65.30 °F | 42.96 °F | 28.04 °F | 0.39 in | 0.00 in | — | — |
| February | 99.86 °F | 72.85 °F | 54.68 °F | 85.64 °F | 60.62 °F | 44.96 °F | 72.50 °F | 46.07 °F | 28.94 °F | 0.03 in | 0.00 in | — | — |
| March | 105.26 °F | 81.37 °F | 57.49 °F | 94.64 °F | 68.68 °F | 49.28 °F | 75.56 °F | 53.33 °F | 35.44 °F | 5.68 in | 0.00 in | — | — |
| April | 112.28 °F | 91.43 °F | 64.40 °F | 95.00 °F | 78.17 °F | 58.82 °F | 85.10 °F | 62.32 °F | 42.24 °F | 0.07 in | 0.00 in | — | — |
| May | 120.38 °F | 97.89 °F | 76.10 °F | 107.96 °F | 85.51 °F | 64.13 °F | 86.36 °F | 69.68 °F | 48.02 °F | 0.12 in | 0.00 in | — | — |
| June | 118.22 °F | 101.52 °F | 83.84 °F | 108.50 °F | 89.87 °F | 71.24 °F | 88.70 °F | 74.30 °F | 53.96 °F | 0.02 in | 0.00 in | — | — |
| July | 114.80 °F | 101.05 °F | 89.60 °F | 104.54 °F | 90.35 °F | 78.80 °F | 88.52 °F | 75.79 °F | 58.64 °F | 0.00 in | 0.00 in | — | — |
| August | 112.82 °F | 100.97 °F | 90.68 °F | 104.90 °F | 90.16 °F | 77.72 °F | 89.60 °F | 75.91 °F | 59.00 °F | 0.40 in | 0.00 in | — | — |
| September | 110.12 °F | 97.33 °F | 81.86 °F | 103.10 °F | 85.94 °F | 72.14 °F | 85.82 °F | 71.56 °F | 55.94 °F | 0.02 in | 0.00 in | — | — |
| October | 107.24 °F | 89.34 °F | 70.70 °F | 94.64 °F | 77.83 °F | 59.72 °F | 82.40 °F | 63.77 °F | 39.02 °F | 0.02 in | 0.00 in | — | — |
| November | 99.50 °F | 79.07 °F | 59.94 °F | 86.90 °F | 67.21 °F | 49.28 °F | 71.06 °F | 53.72 °F | 37.04 °F | 0.09 in | 0.00 in | — | — |
| December | 92.66 °F | 70.38 °F | 55.20 °F | 82.76 °F | 58.72 °F | 43.86 °F | 66.02 °F | 45.80 °F | 30.02 °F | 0.12 in | 0.00 in | — | — |
Data Visualisations
Remove WatermarksCurrent Year Climate Trends vs Historical


Max Temperature this Year | 1 of 6
Climate 12-Month Moving Averages
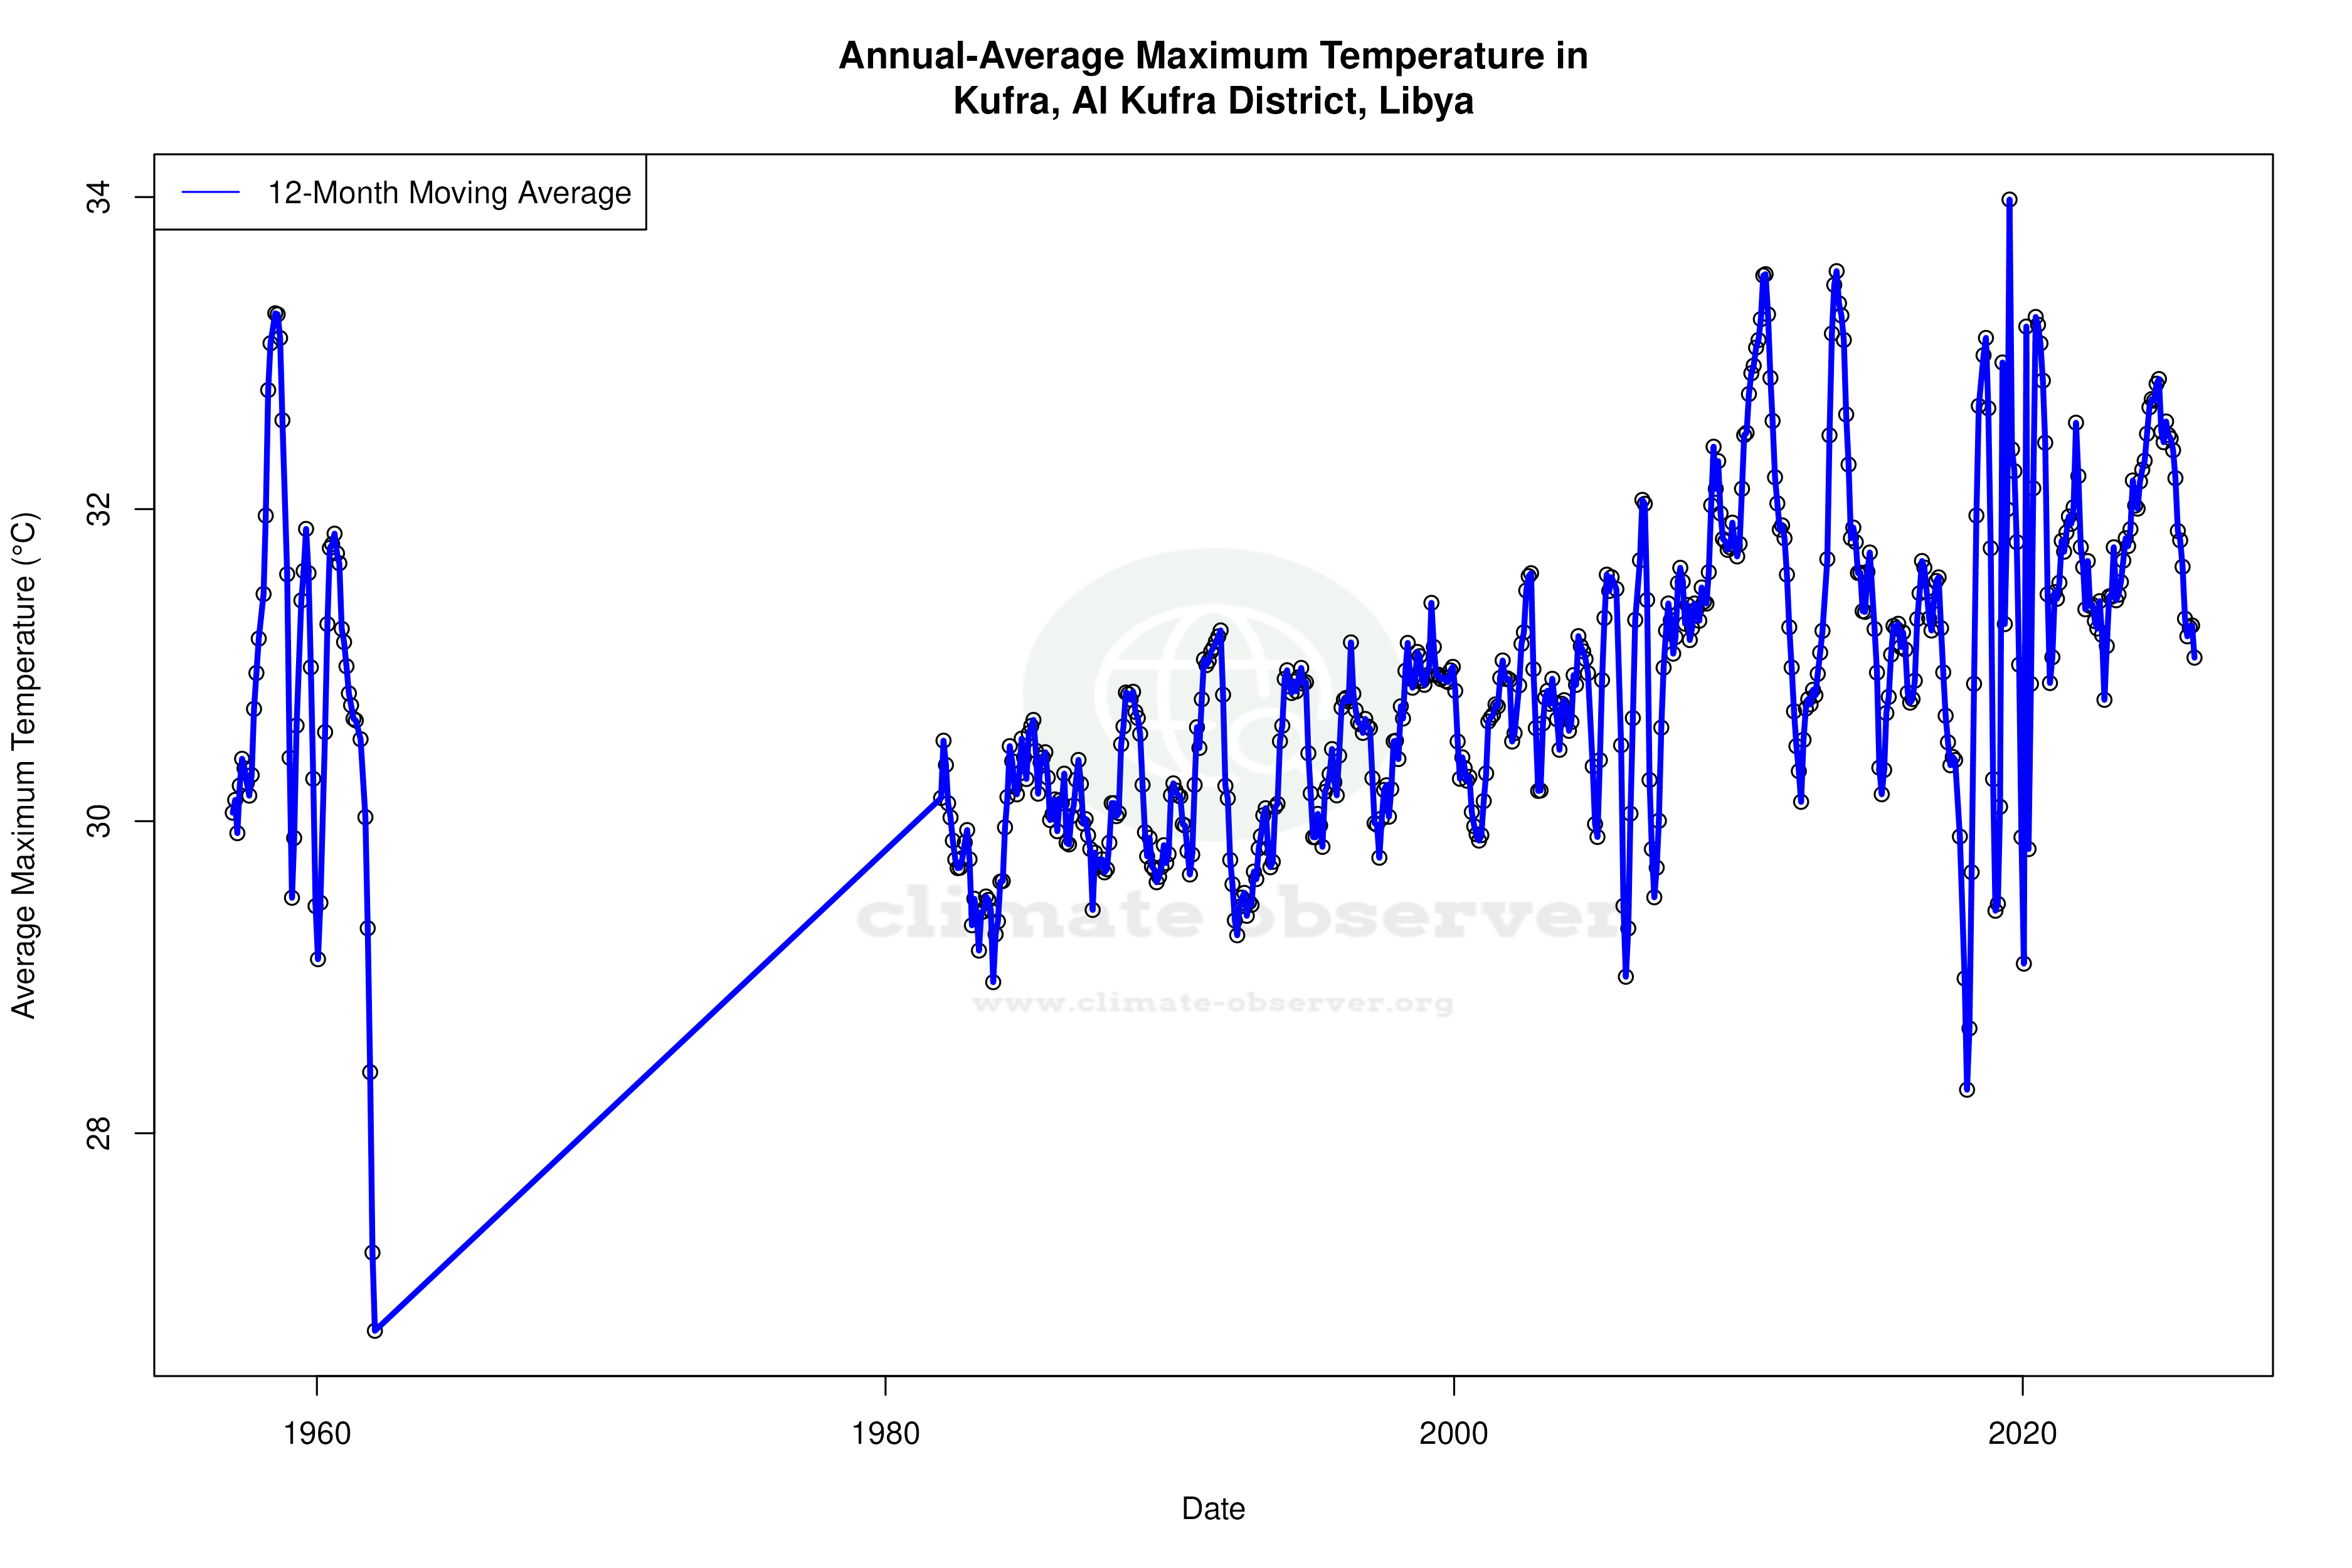


Max Temperature 12-Month MA | 1 of 6
Daily Data Points and Averages Throughout the Year
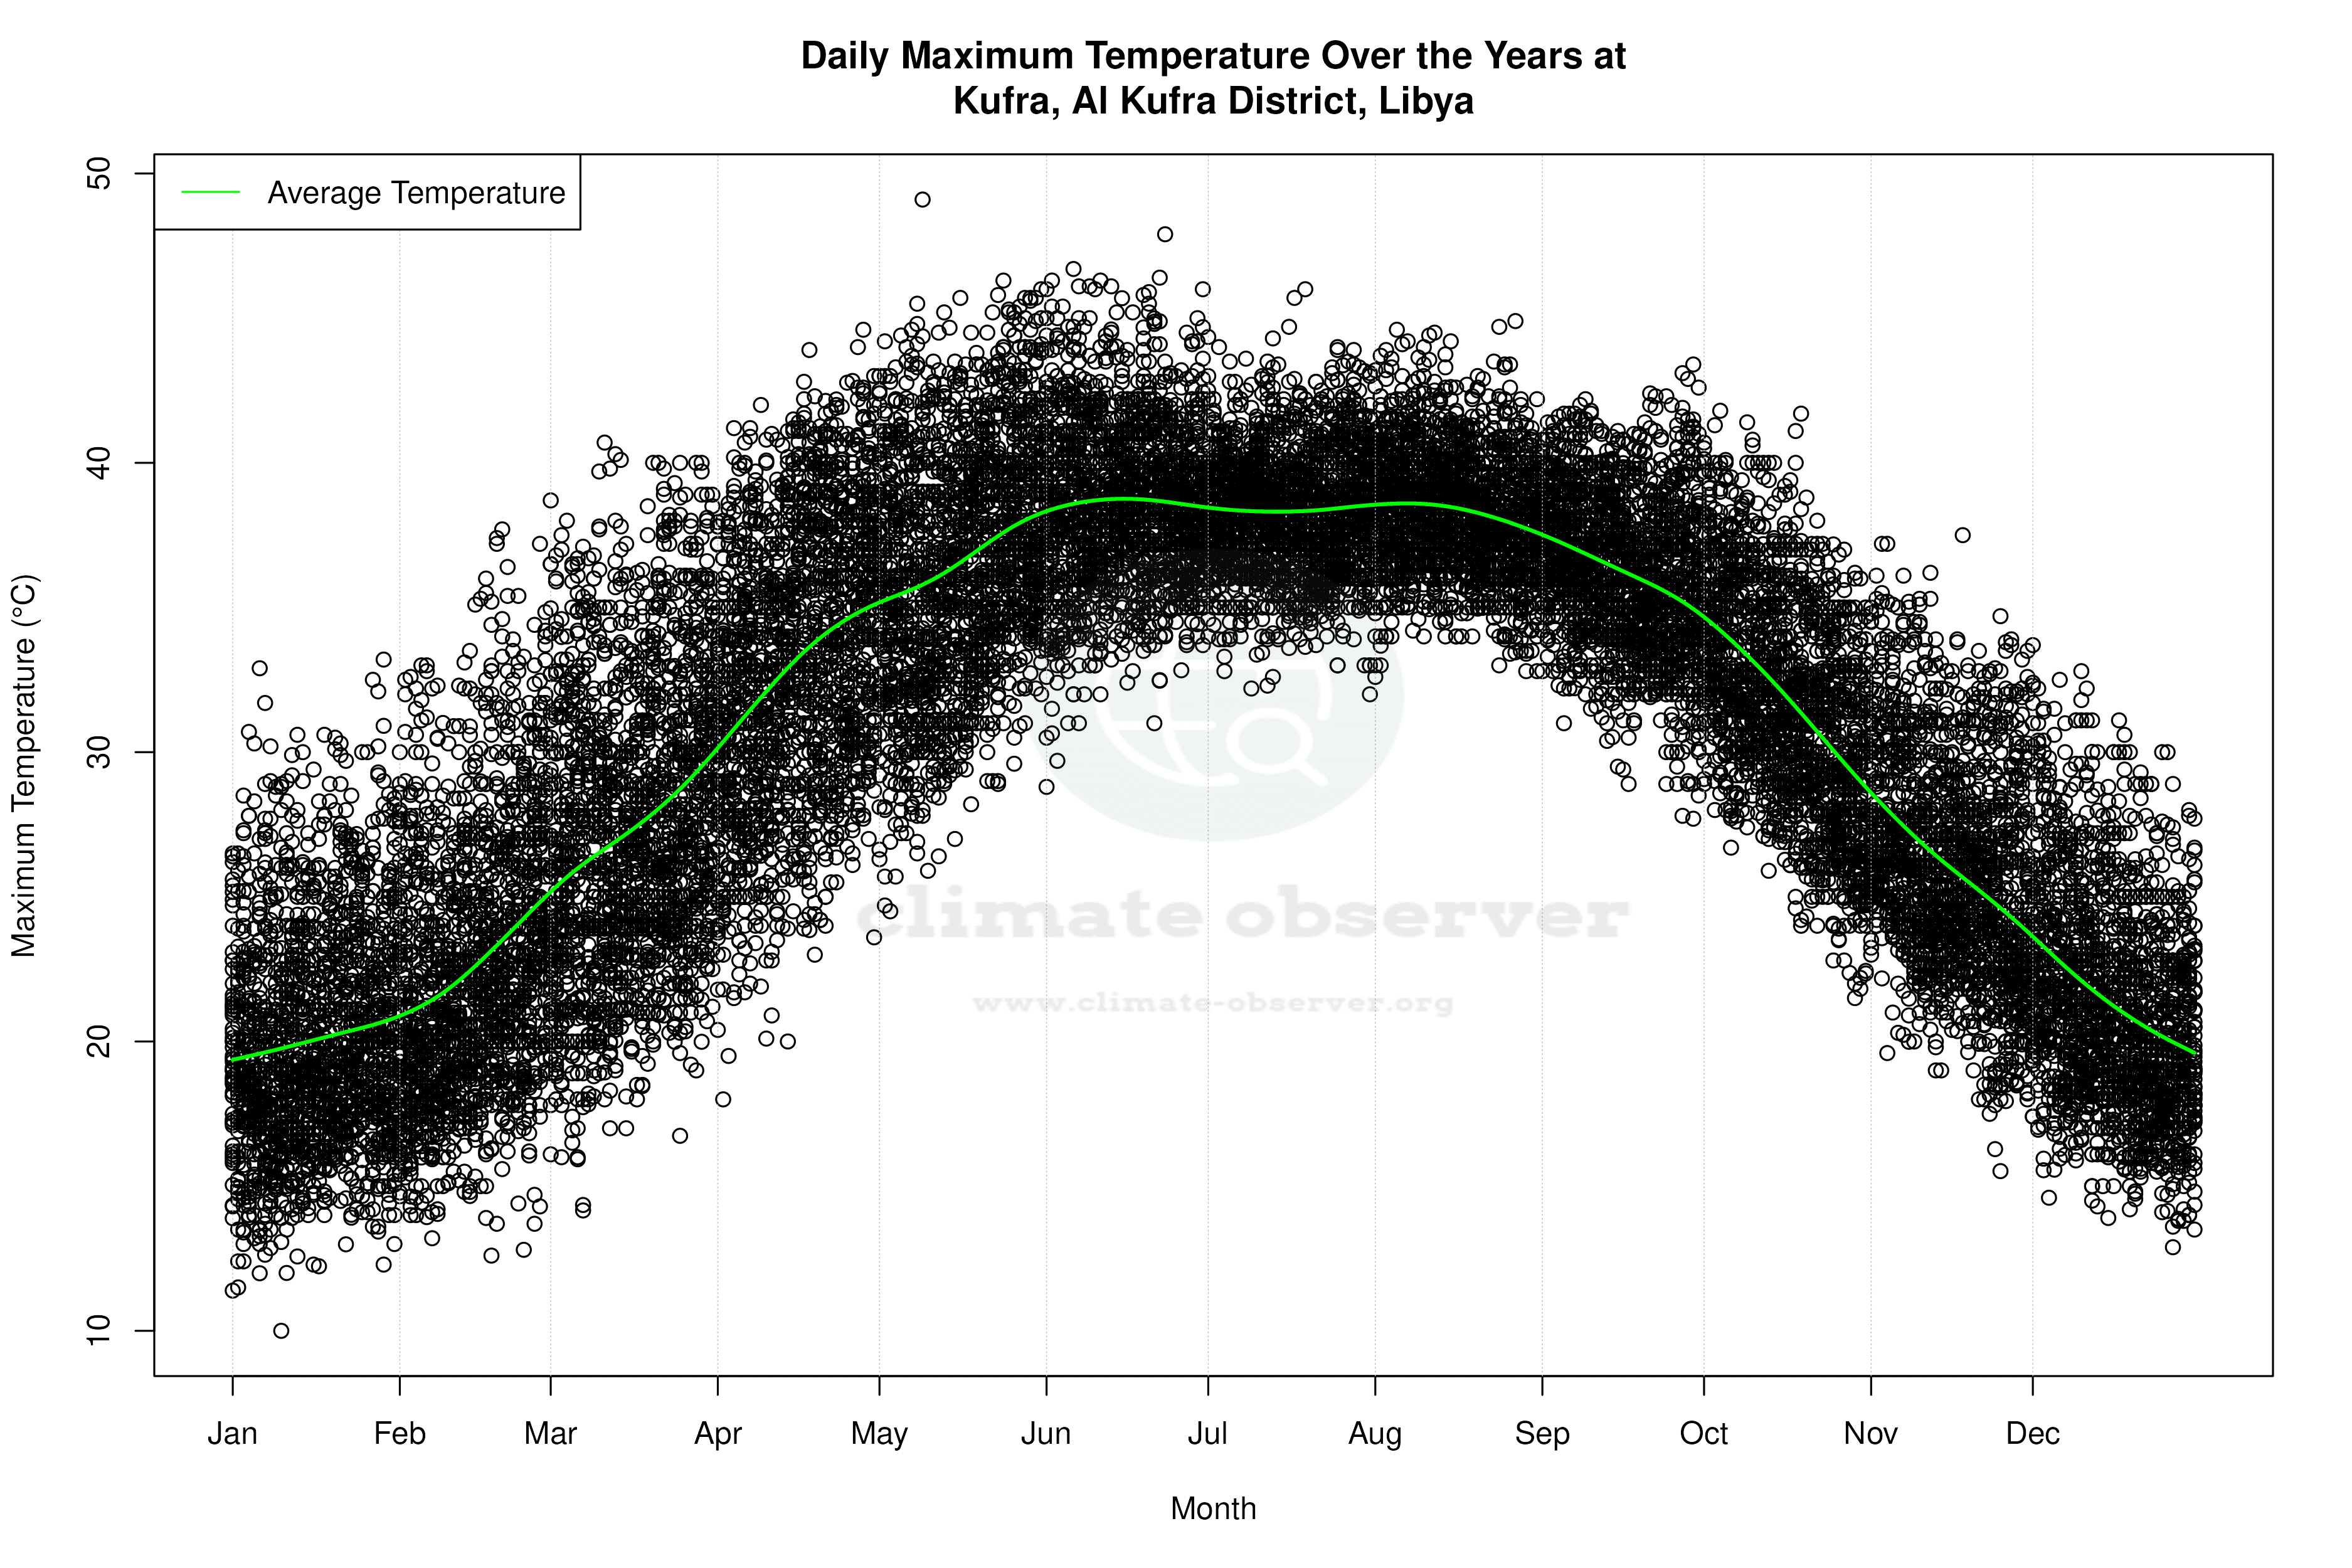


Average Max Temperature Throughout Year | 1 of 5
