Climate for Station: Nalut, Nalut District, Libya
Loading live weather...
Climate Analysis & Overview
Nalut's climate profile reveals a complex interplay between warming trends and shifting precipitation patterns. While the region experiences a slight warming overall, recent cooling in high temperatures suggests nuanced climatic dynamics. Precipitation is becoming marginally more evenly distributed, indicating subtle changes in local hydrology.
Warming and Cooling Dynamics
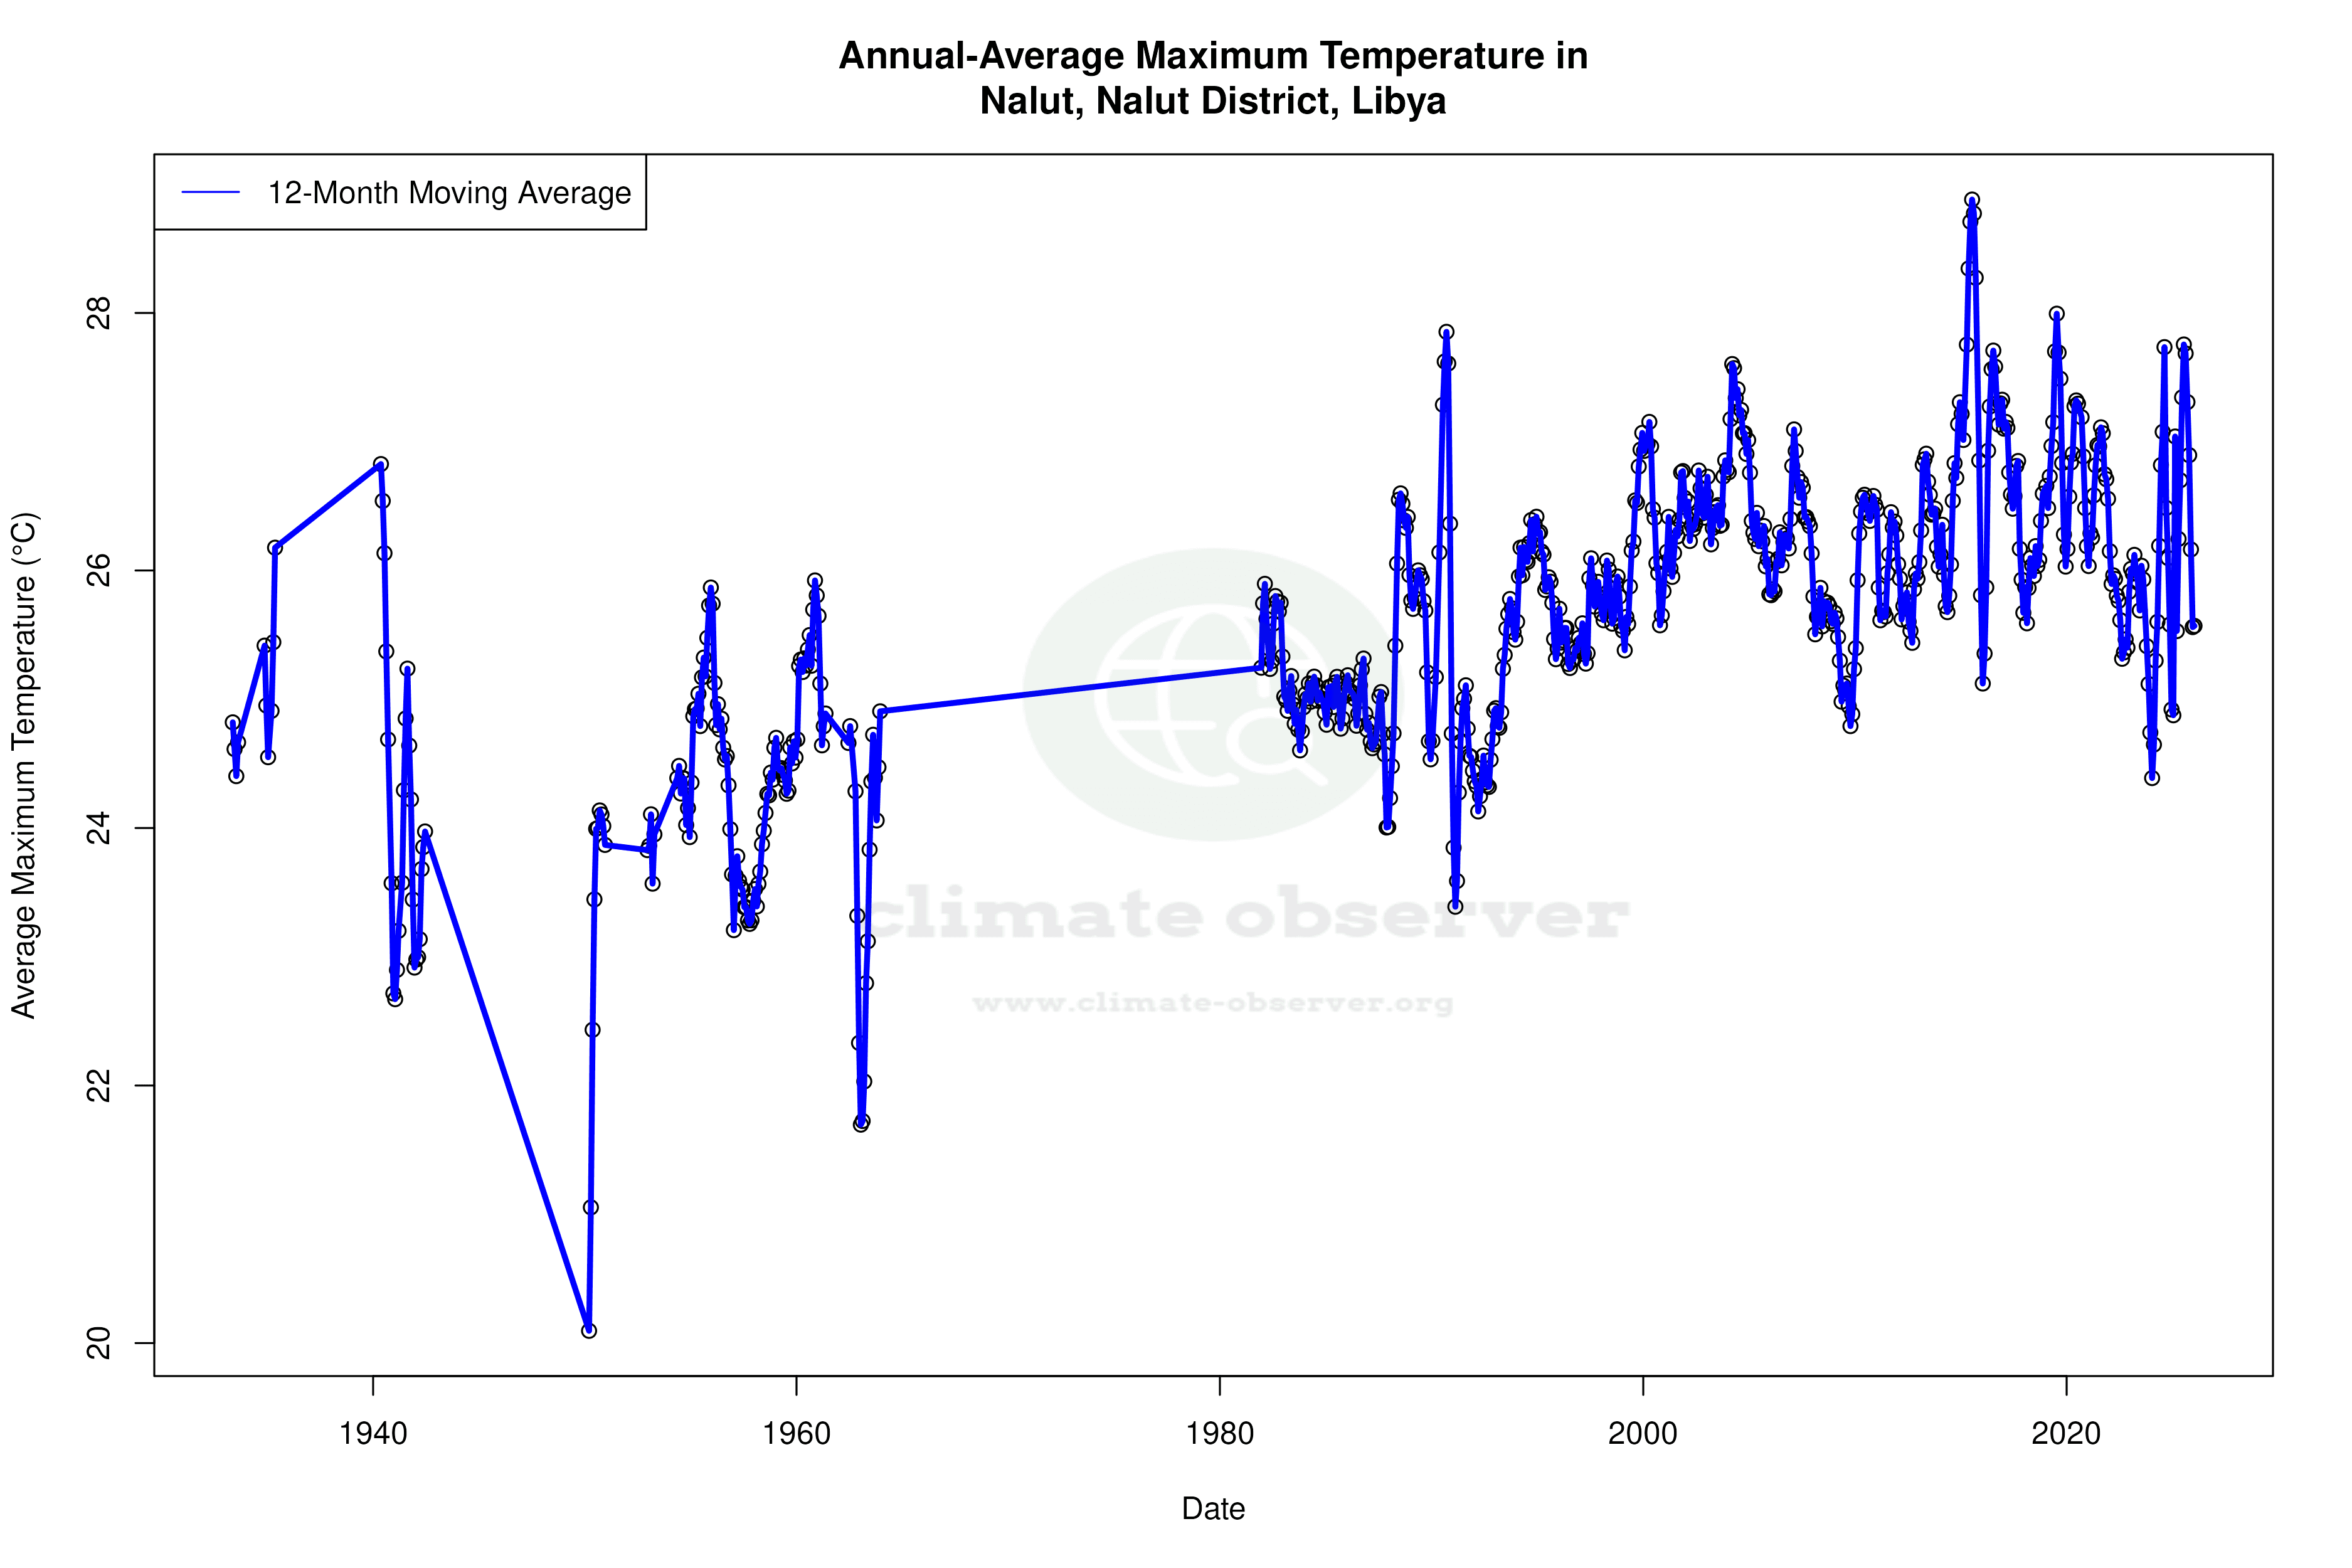
Nalut, situated in Libya's northwestern region, experiences a hot desert climate (BWh) according to the Köppen classification. The local geography, characterised by its proximity to the Nafusa Mountains, influences temperature and precipitation patterns. Over the long term, Nalut has seen a slight overall warming with all-time high temperatures increasing by 0.30°C (0.54°F). However, in the past decade, there has been a cooling trend in high temperatures, falling by 0.80°C (1.44°F). This recent cooling could be attributed to localised atmospheric changes or broader climatic shifts affecting the region.
Rising Night-time Temperatures
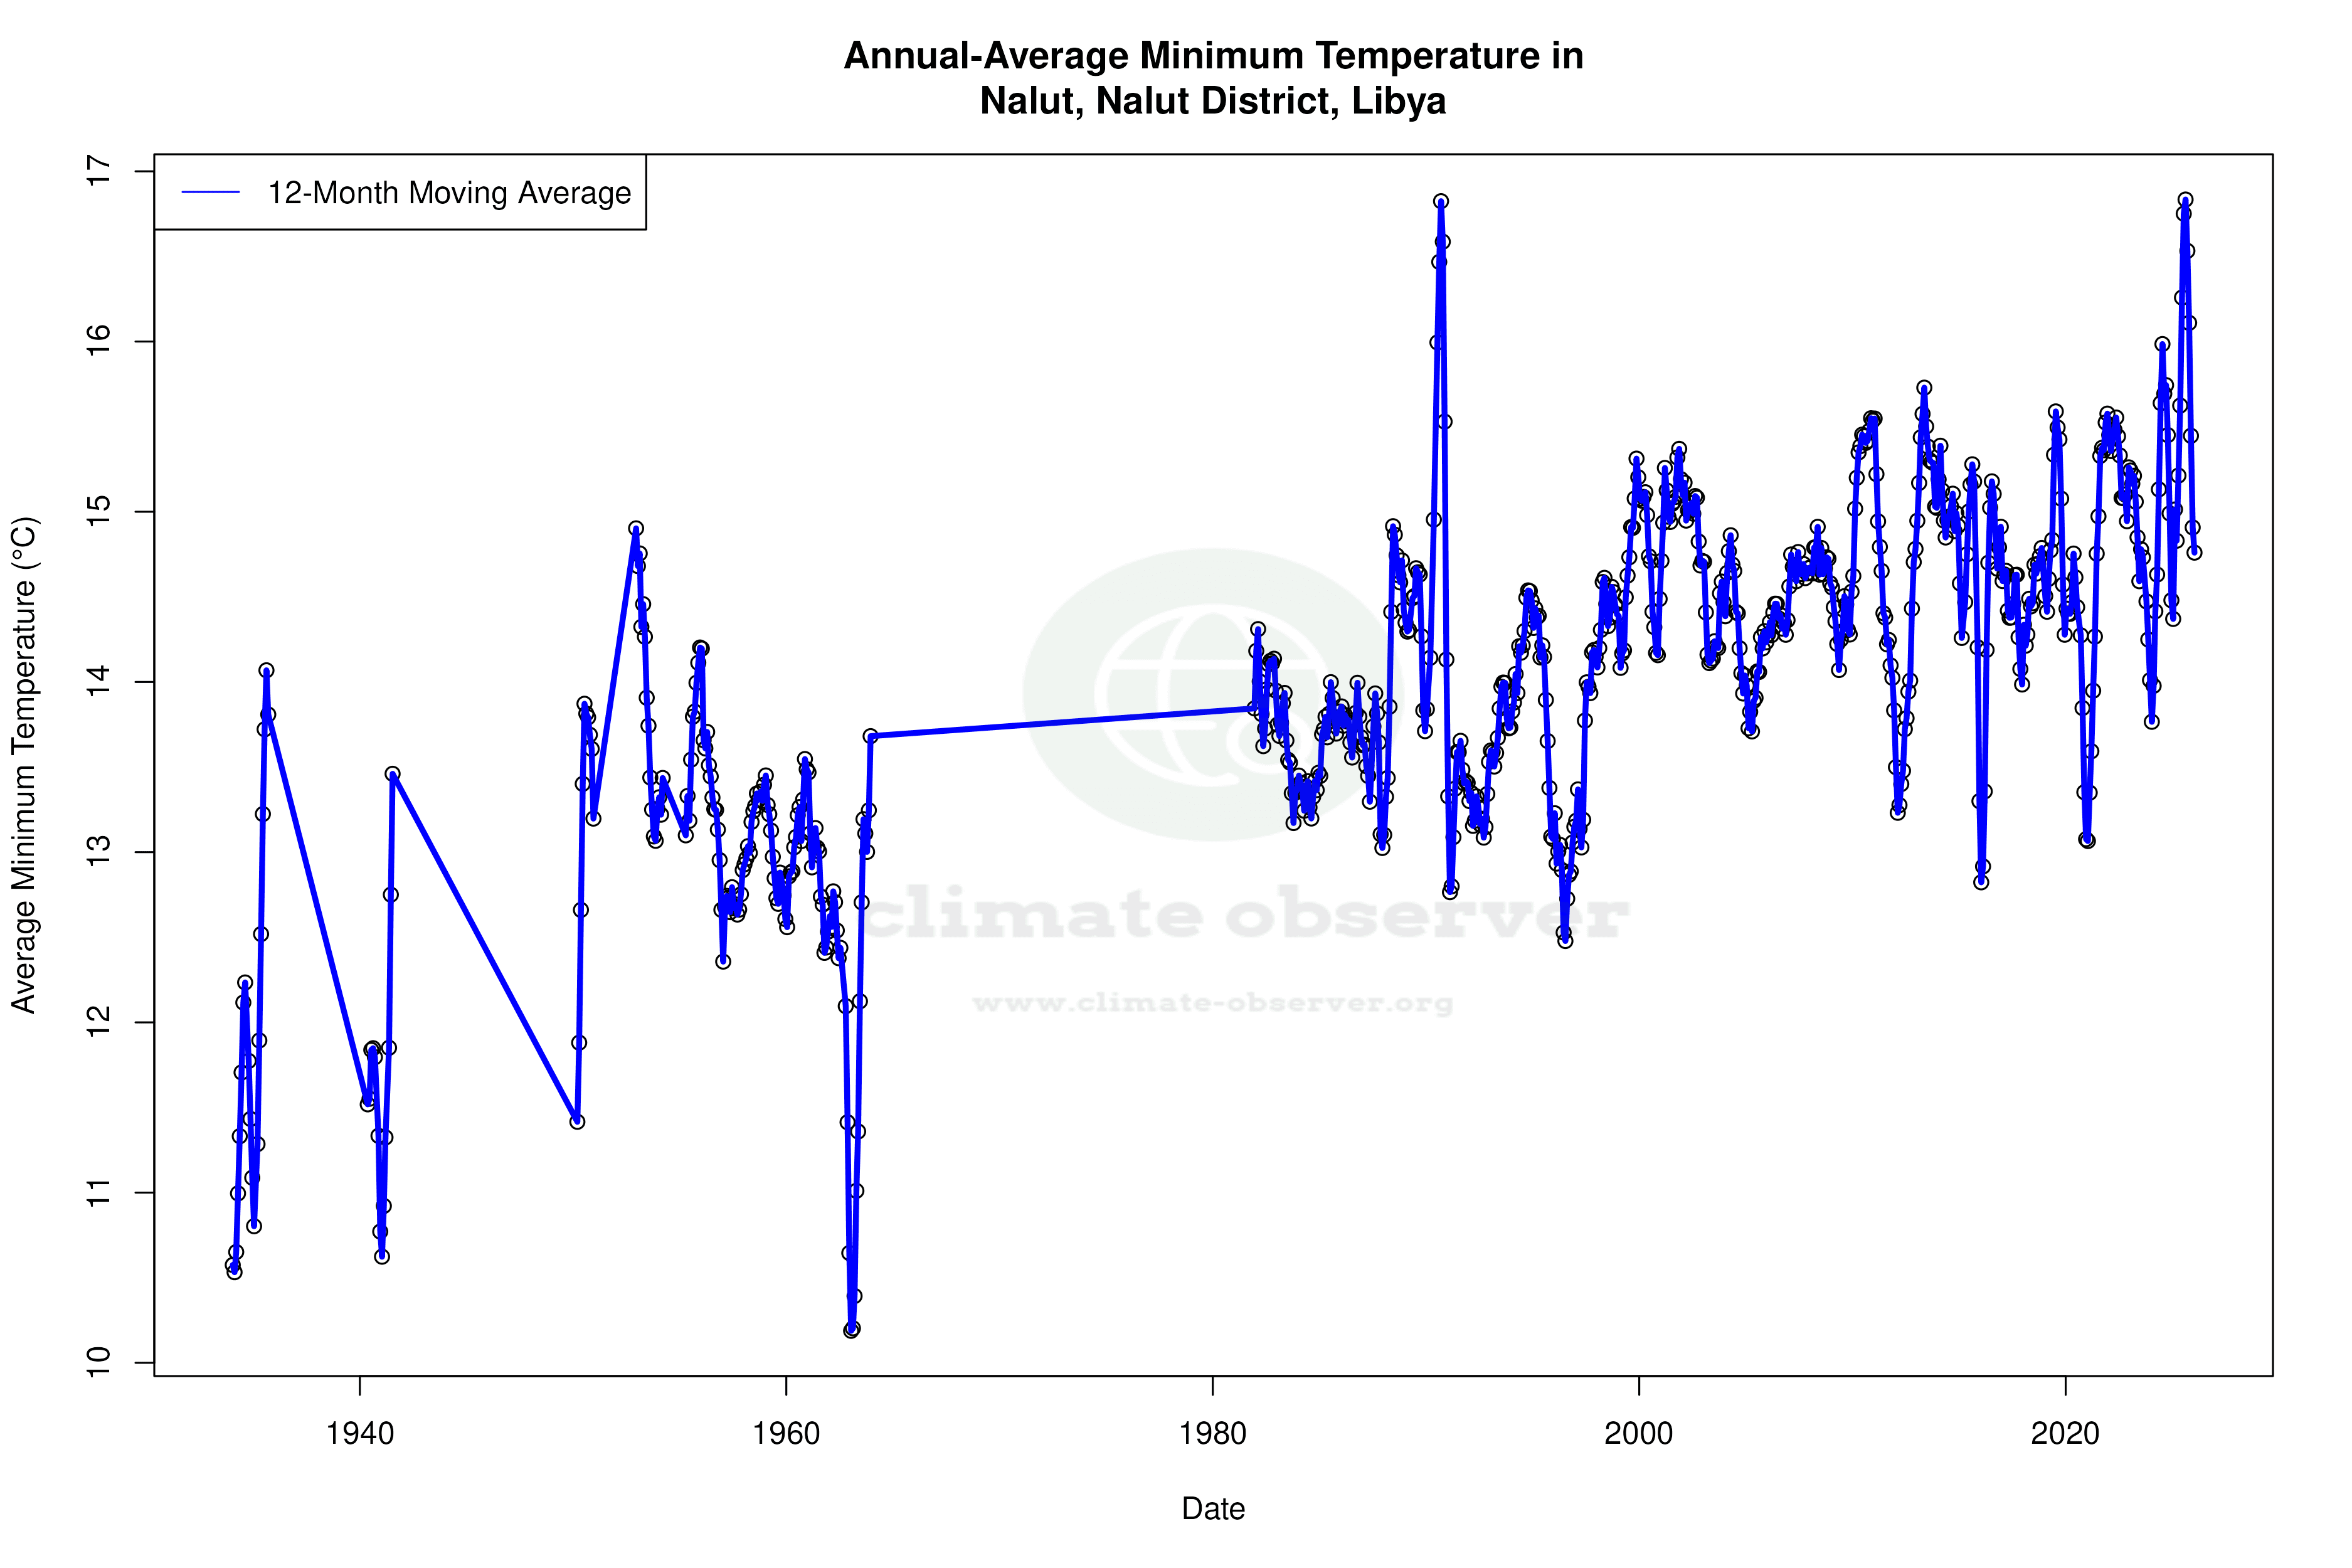
While daytime highs have shown recent cooling, night-time lows tell a different story. Over the past ten years, low temperatures in Nalut have risen by 1.18°C (2.12°F), suggesting warmer nights. This trend aligns with the all-time low temperature increase of 0.30°C (0.54°F), indicating a consistent warming pattern during night-time. Such changes could have implications for energy use and agricultural practices, as warmer nights may affect crop growth and water usage.
Precipitation Patterns: A Subtle Shift
The Precipitation Concentration Index (PCI) offers insights into rainfall distribution. Nalut's PCI has decreased slightly from a baseline of 24.98 to 23.32, indicating a marginal shift towards more evenly distributed precipitation events. While still highly concentrated, this change suggests a potential reduction in intense, isolated rainfall events. Such a shift could impact water resource management and agricultural planning, as more evenly spread precipitation may improve water availability.
Temperature Extremes and Regional Implications
Nalut's climate extremes underscore the region's vulnerability to temperature fluctuations. The record high of 51.0°C (123.8°F) and record low of -7.0°C (19.4°F) highlight the broad range of conditions experienced. These extremes, coupled with the recent cooling of daytime highs and warming of night-time lows, suggest complex climatic dynamics at play. Understanding these patterns is crucial for regional planning, particularly in light of Libya's climate goals, which focus on adapting to and mitigating climate impacts.
Contextualising Climate Trends
The interplay between warming trends and cooling intervals in Nalut reflects broader regional climatic patterns. Libya's climate strategies, aimed at enhancing resilience to temperature and precipitation changes, must consider these nuanced dynamics. As Nalut experiences both warming nights and cooling days, the region's climate profile serves as a microcosm of the challenges and opportunities facing Libya in its pursuit of sustainable development and climate adaptation.
Station Statistics
10-Year Trend
High: -1.40 °F/decade
Low: +2.06 °F/decade
Rain: -0.006 in/decade
25-Year Trend
High: -0.02 °F/decade
Low: +0.42 °F/decade
Rain: -0.002 in/decade
50-Year Trend
High: +0.58 °F/decade
Low: +0.56 °F/decade
Rain: -0.001 in/decade
All-Time Trend
High: +0.54 °F/decade
Low: +0.53 °F/decade
Rain: -0.000 in/decade
Percentage Above-Average Days
Last 12 Months: 53.0%
This Year: 67.8%
Precipitation Concentration Index (PCI) ℹ️
Last 12 Months: 32.3
Historical Average: 26.2
Percentile Rank of Last 12 Months ℹ️
High: 58th percentile
Low: 91st percentile
Rain: 36th percentile
Change in Variance ℹ️
High: -0.7%
Low: +1.9%
Intraday: -14.4%
Data Coverage
71.8%
First Year of Data
1932
Station Location
Historical Weather Records
| Max High | Avg High | Min High | Max Avg | Avg Avg | Min Avg | Max Low | Avg Low | Min Low | Max Precipitation | Avg Precipitation | Max Snow | Avg Snow | |
|---|---|---|---|---|---|---|---|---|---|---|---|---|---|
| Record | 123.80 °F | — | 39.92 °F | 104.90 °F | — | 33.82 °F | 89.78 °F | — | 19.40 °F | 3.54 in | — | — | — |
| January | 84.20 °F | 57.95 °F | 41.00 °F | 74.12 °F | 49.92 °F | 33.82 °F | 64.94 °F | 41.33 °F | 19.40 °F | 1.29 in | 0.02 in | — | — |
| February | 91.40 °F | 61.83 °F | 39.92 °F | 76.82 °F | 53.11 °F | 36.68 °F | 64.76 °F | 43.50 °F | 26.06 °F | 2.10 in | 0.03 in | — | — |
| March | 102.56 °F | 68.43 °F | 44.60 °F | 86.72 °F | 58.75 °F | 38.12 °F | 75.92 °F | 48.23 °F | 31.82 °F | 3.54 in | 0.03 in | — | — |
| April | 105.06 °F | 76.88 °F | 48.02 °F | 88.52 °F | 65.52 °F | 44.24 °F | 80.24 °F | 53.82 °F | 32.00 °F | 1.93 in | 0.01 in | — | — |
| May | 110.39 °F | 84.71 °F | 53.60 °F | 95.36 °F | 72.98 °F | 50.00 °F | 86.00 °F | 60.51 °F | 43.88 °F | 1.85 in | 0.01 in | — | — |
| June | 114.03 °F | 92.47 °F | 62.60 °F | 104.90 °F | 80.13 °F | 58.82 °F | 89.60 °F | 67.40 °F | 44.60 °F | 0.71 in | 0.00 in | — | — |
| July | 116.60 °F | 95.62 °F | 74.30 °F | 103.10 °F | 83.85 °F | 64.94 °F | 87.80 °F | 71.05 °F | 50.36 °F | 0.05 in | 0.00 in | — | — |
| August | 123.80 °F | 95.15 °F | 74.30 °F | 101.12 °F | 83.86 °F | 68.54 °F | 89.78 °F | 71.59 °F | 50.00 °F | 0.54 in | 0.00 in | — | — |
| September | 113.72 °F | 90.01 °F | 64.76 °F | 98.96 °F | 79.04 °F | 59.00 °F | 85.10 °F | 68.19 °F | 45.68 °F | 1.05 in | 0.01 in | — | — |
| October | 108.32 °F | 80.62 °F | 53.96 °F | 90.32 °F | 70.89 °F | 49.82 °F | 80.42 °F | 61.35 °F | 41.00 °F | 1.46 in | 0.02 in | — | — |
| November | 95.00 °F | 69.25 °F | 46.04 °F | 81.32 °F | 60.52 °F | 41.36 °F | 75.20 °F | 51.72 °F | 32.90 °F | 2.09 in | 0.02 in | — | — |
| December | 81.68 °F | 59.99 °F | 41.00 °F | 73.58 °F | 52.02 °F | 36.32 °F | 63.68 °F | 43.78 °F | 23.00 °F | 1.51 in | 0.03 in | — | — |
Data Visualisations
Remove WatermarksCurrent Year Climate Trends vs Historical


Max Temperature this Year | 1 of 6
Climate 12-Month Moving Averages
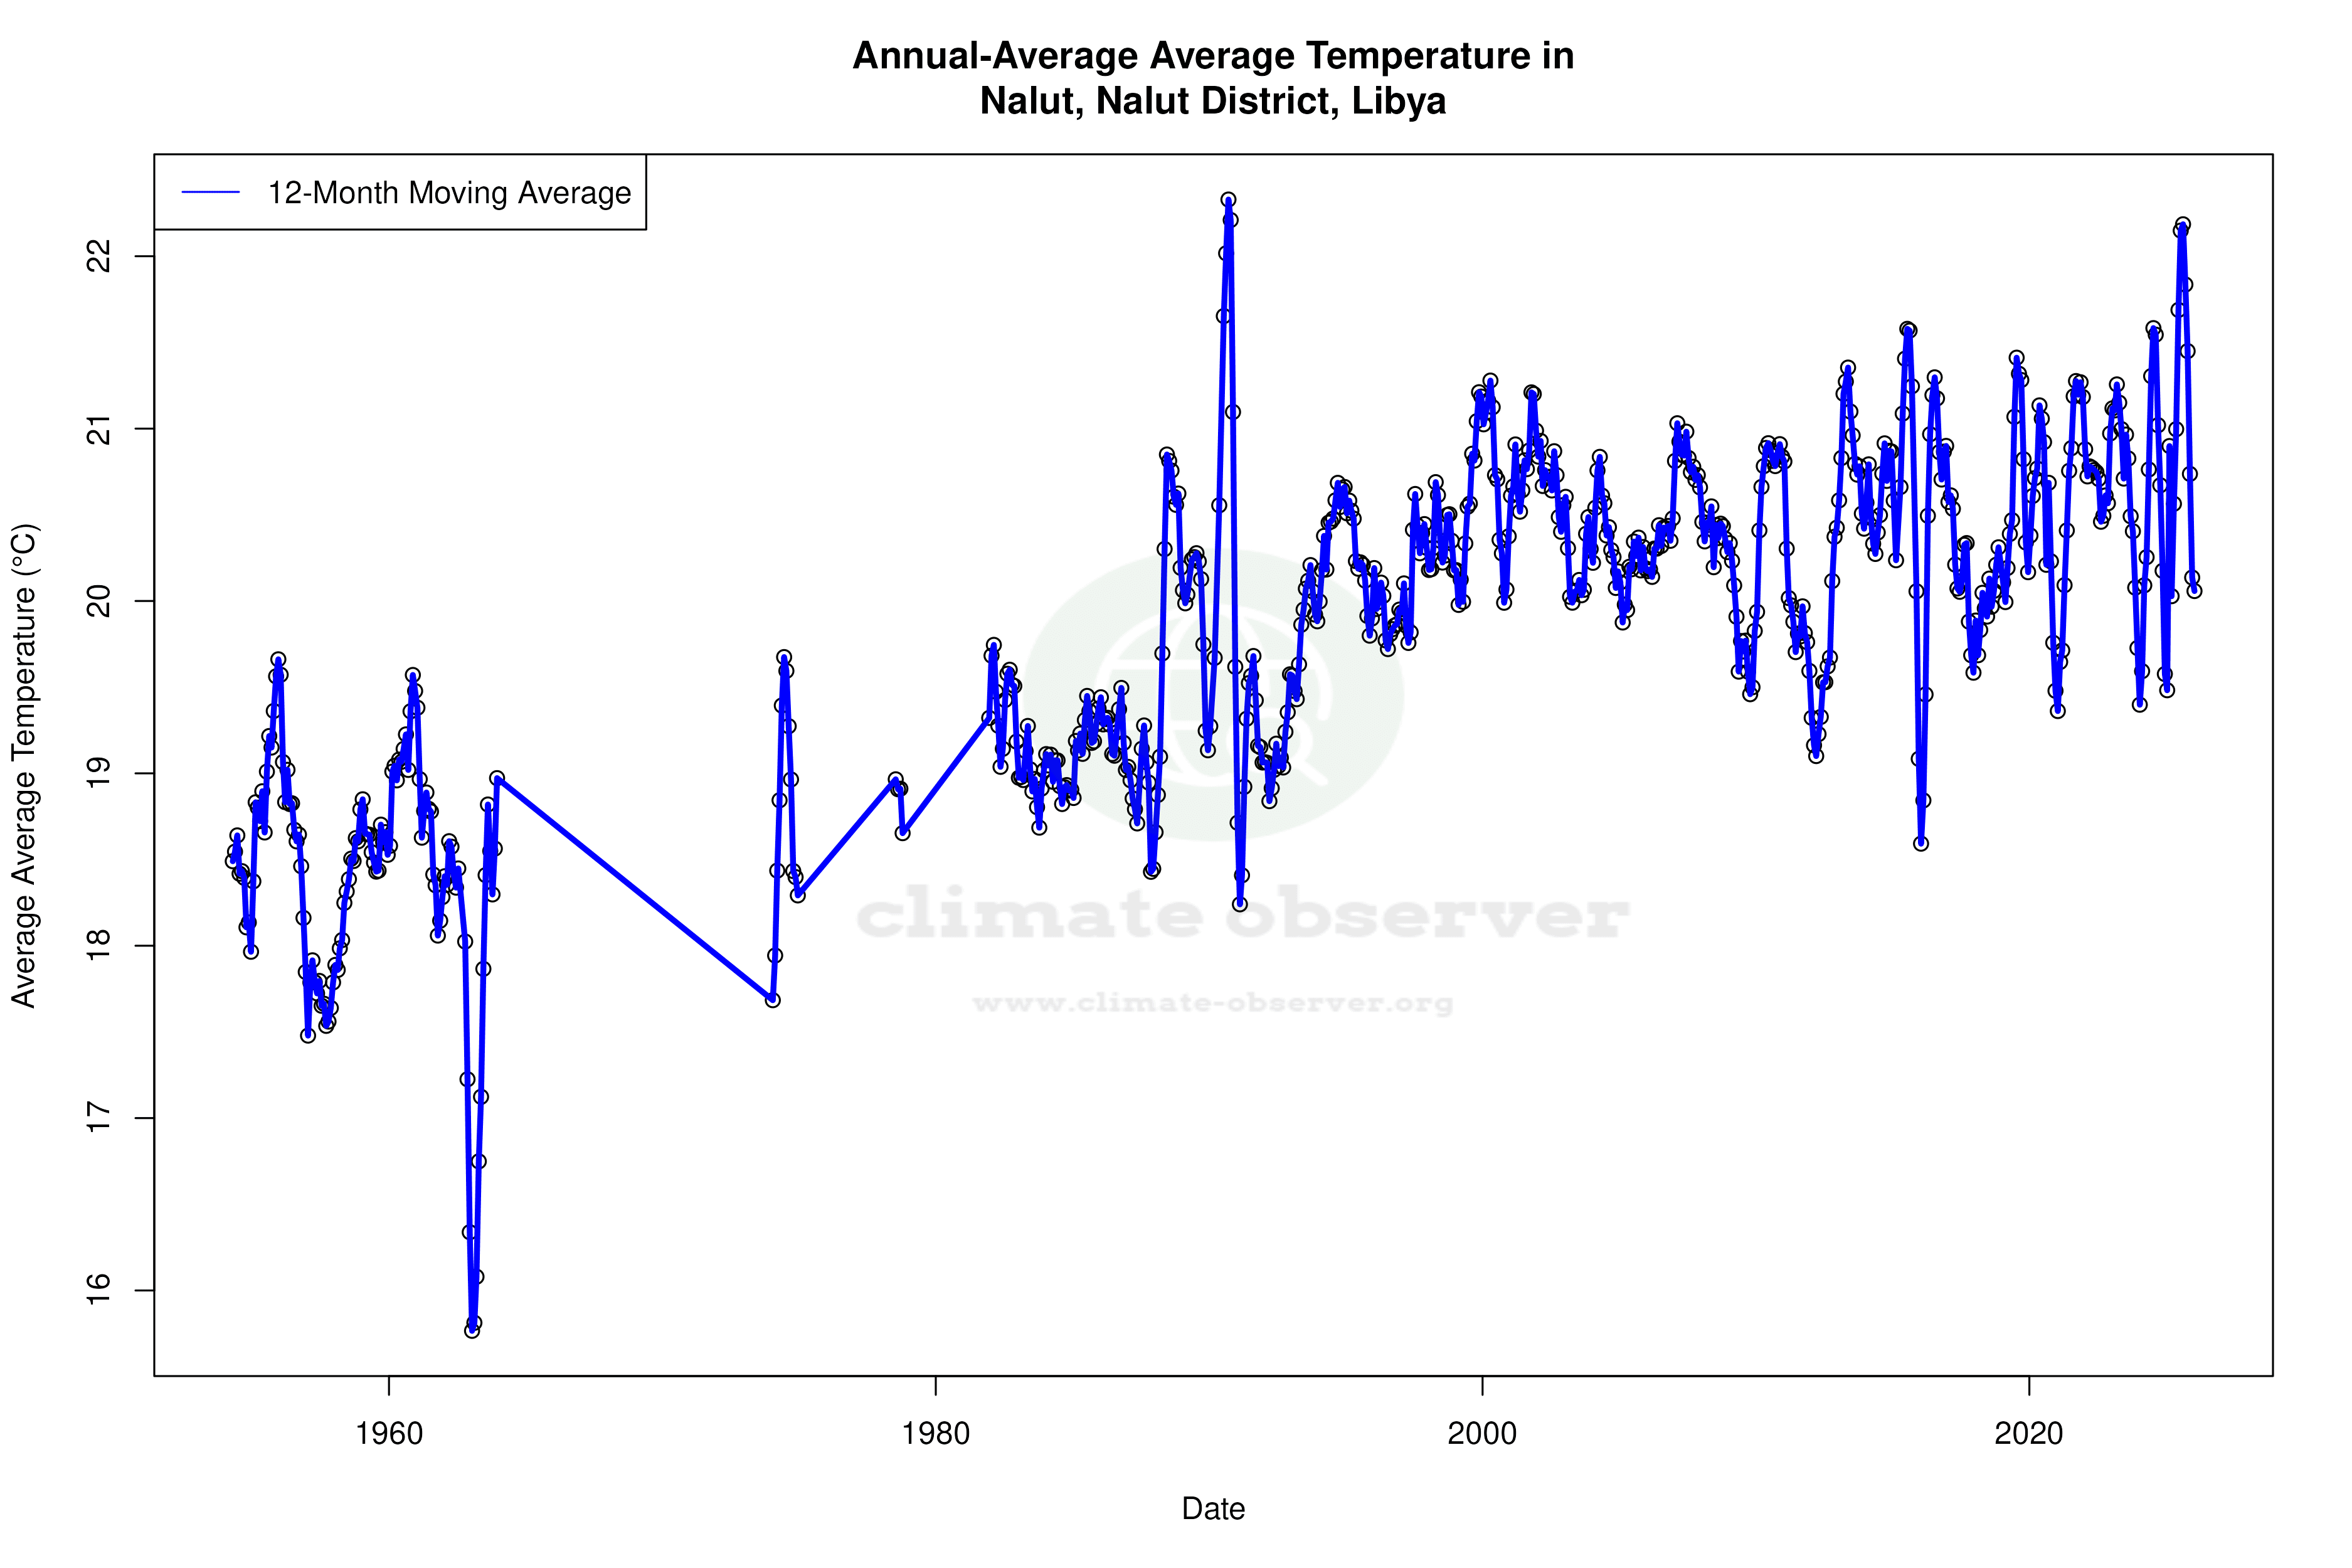


Max Temperature 12-Month MA | 1 of 6
Daily Data Points and Averages Throughout the Year

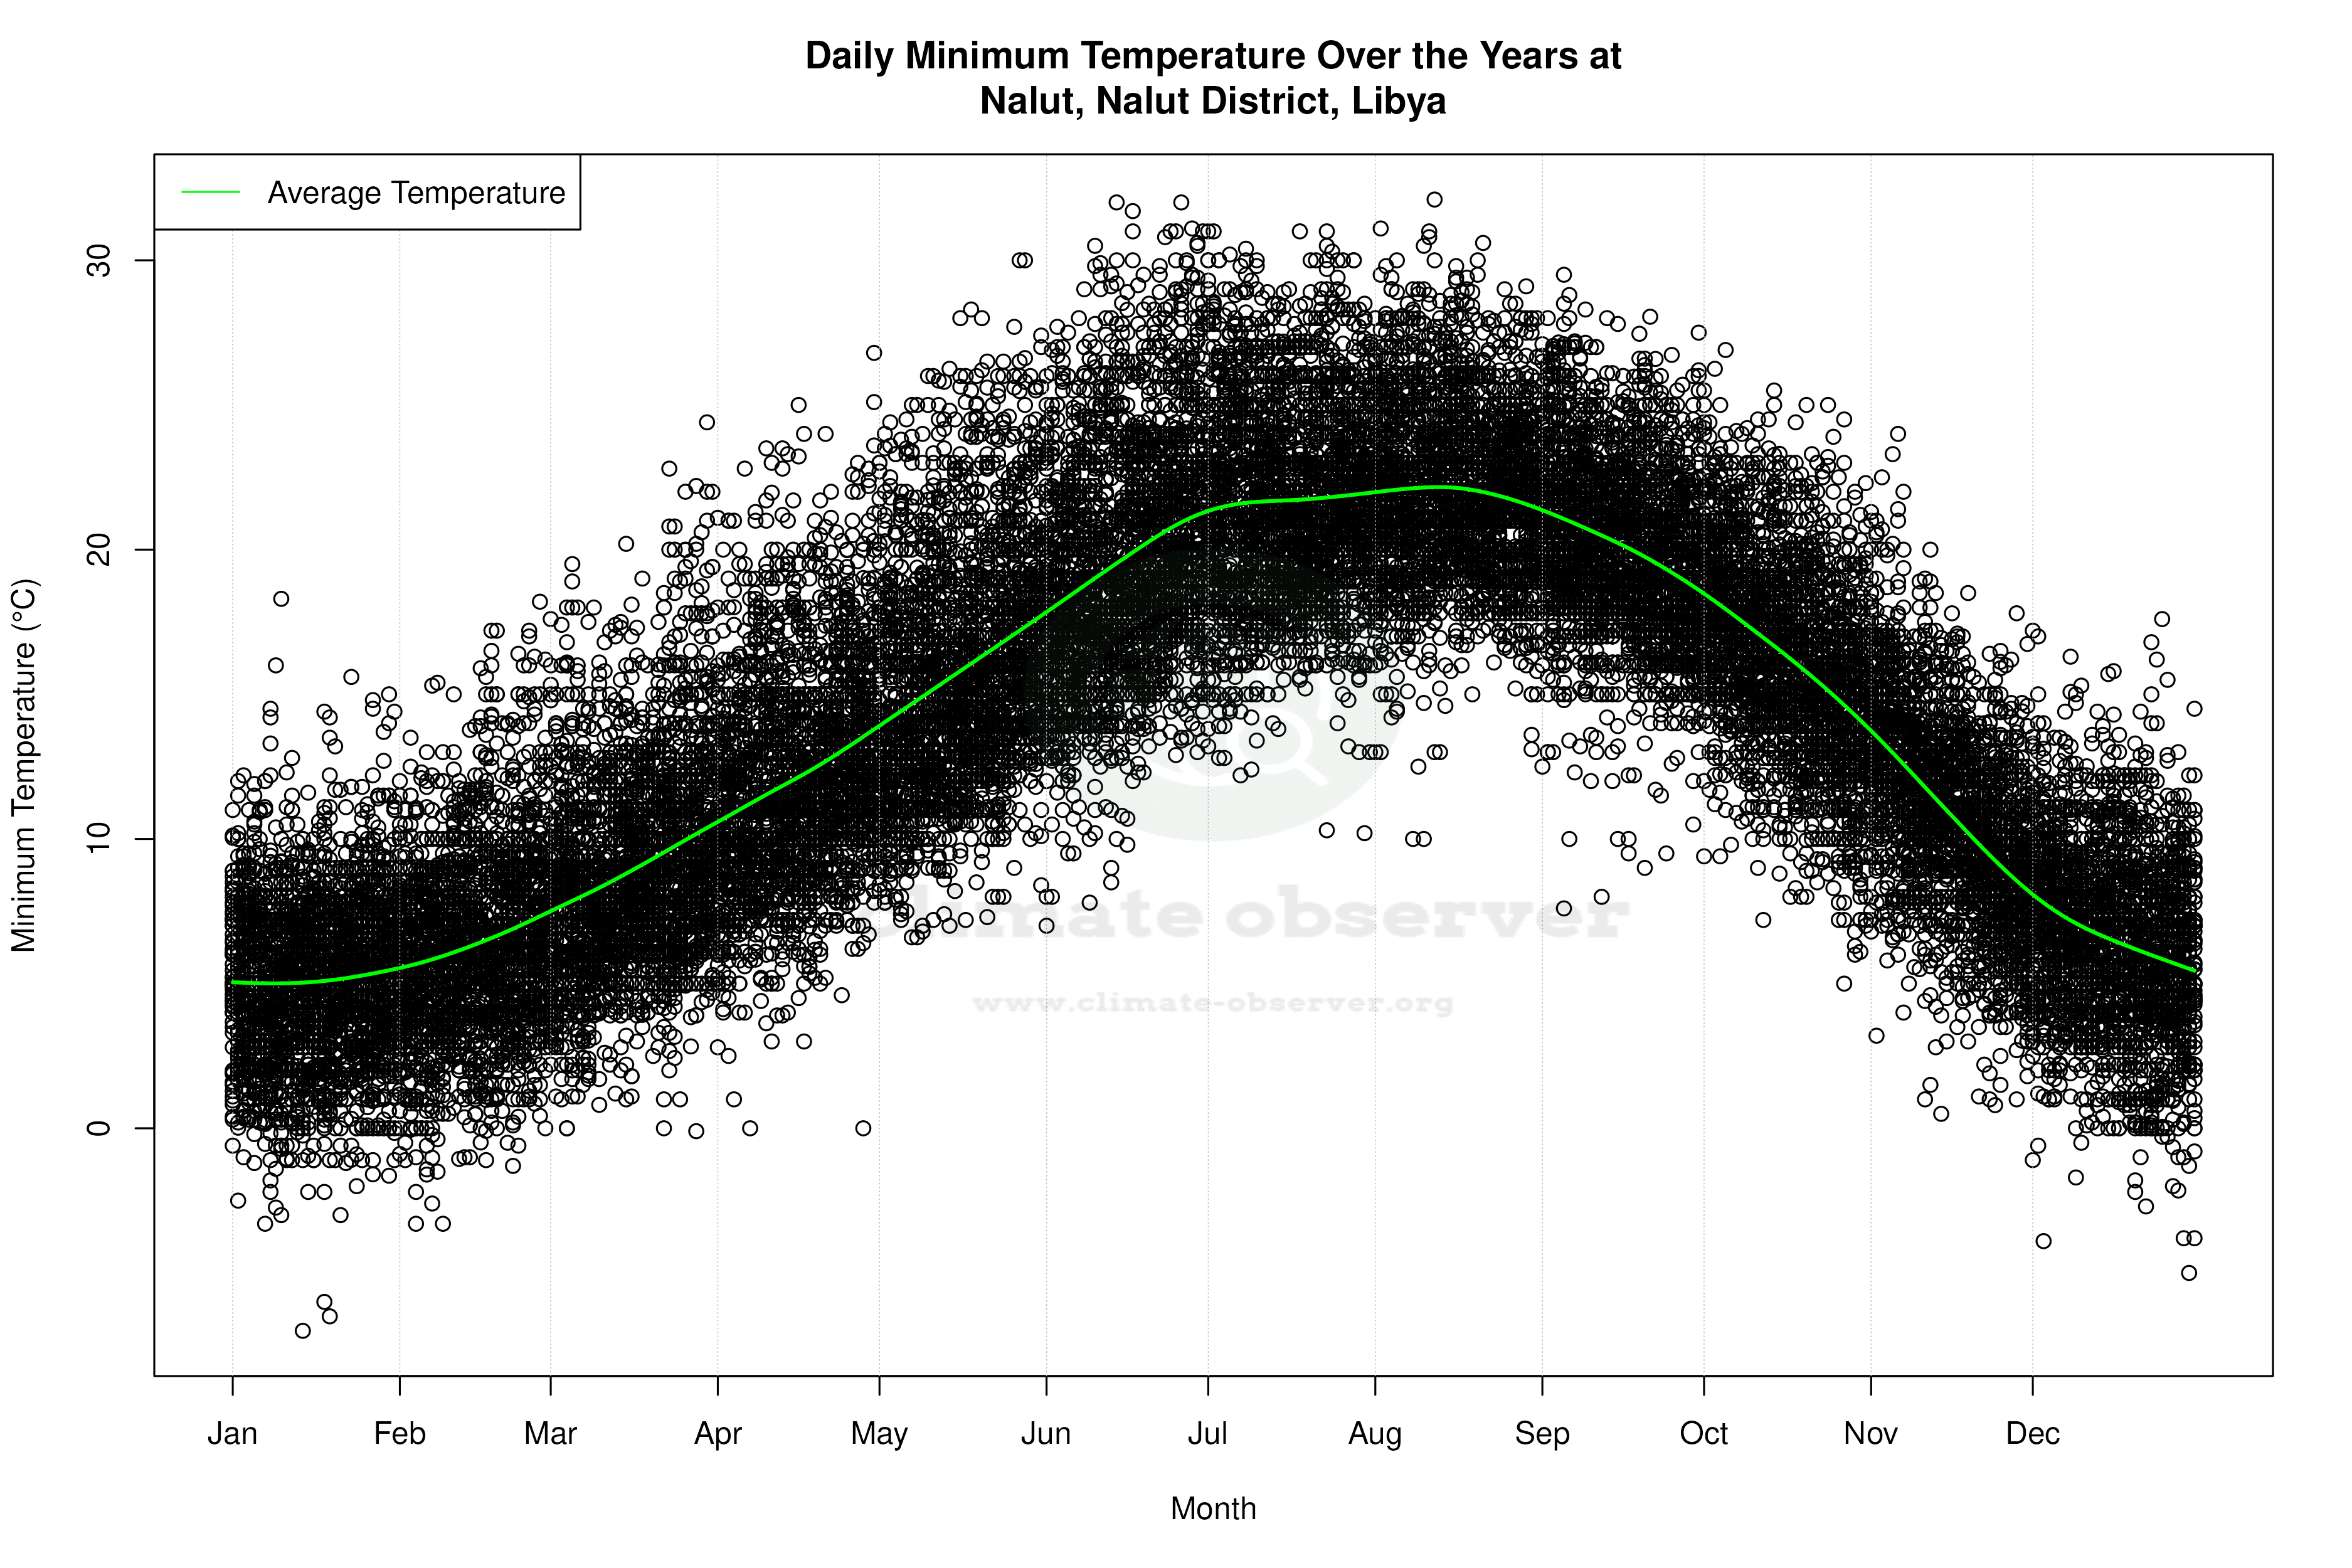
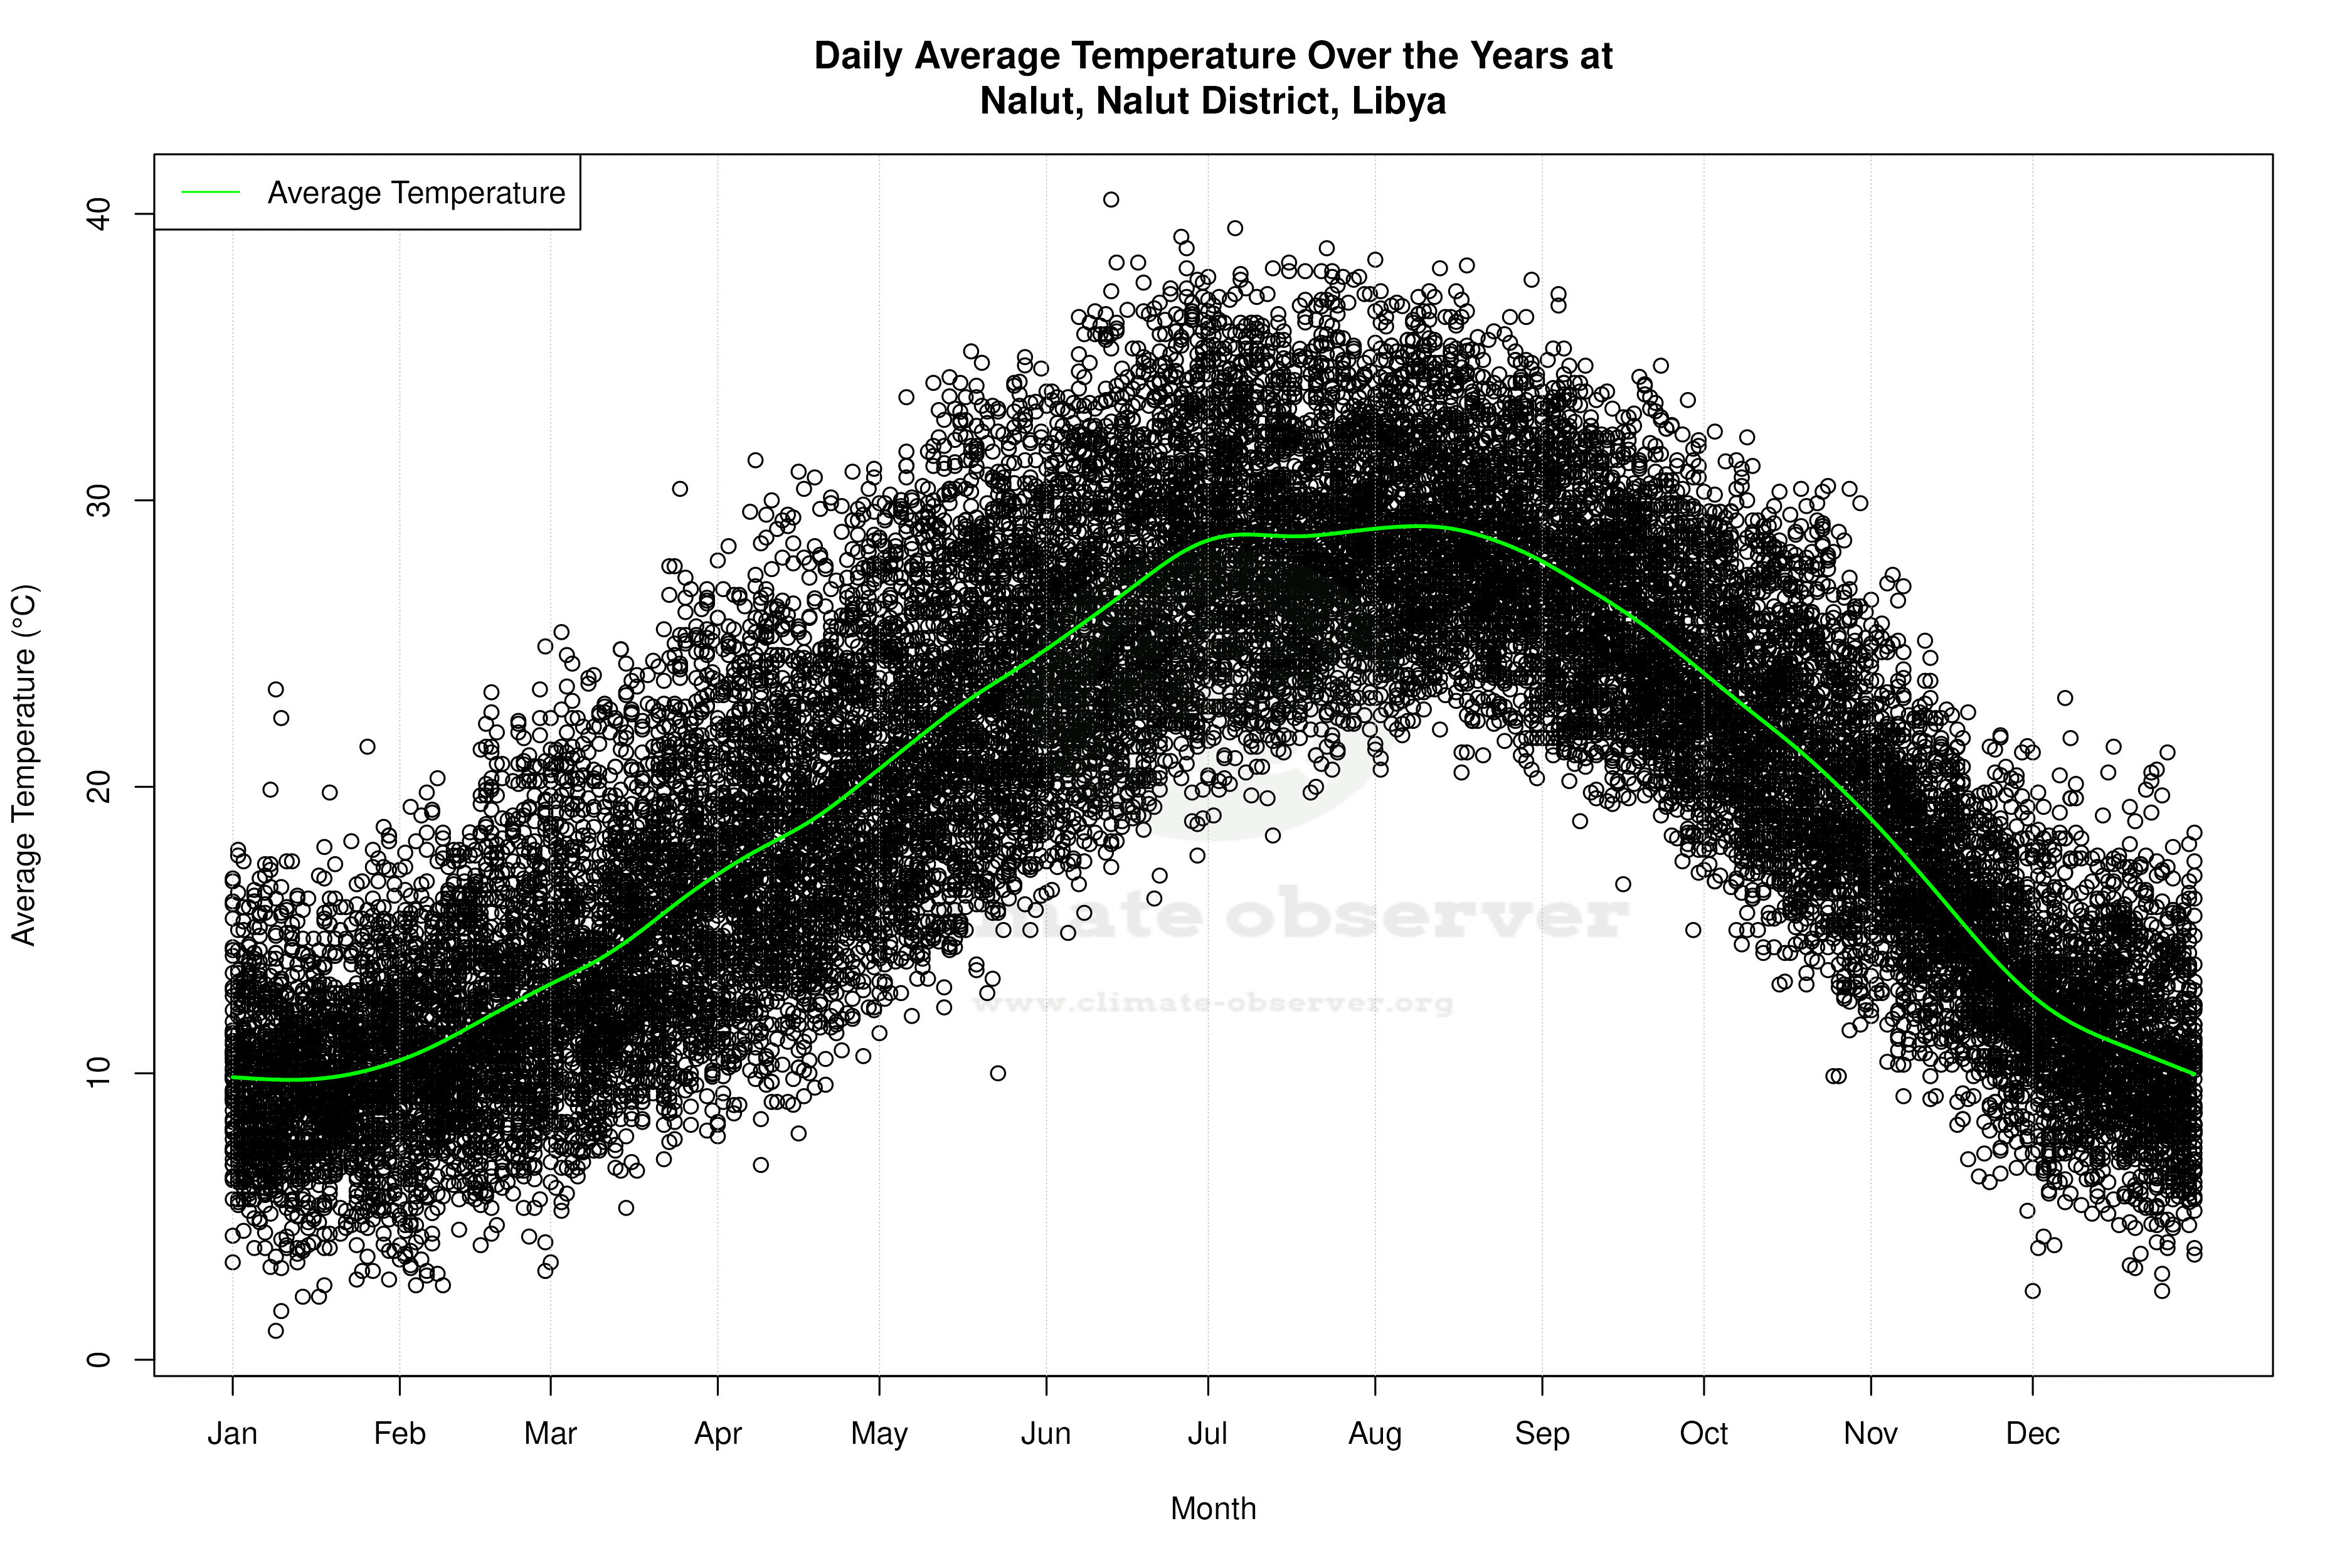
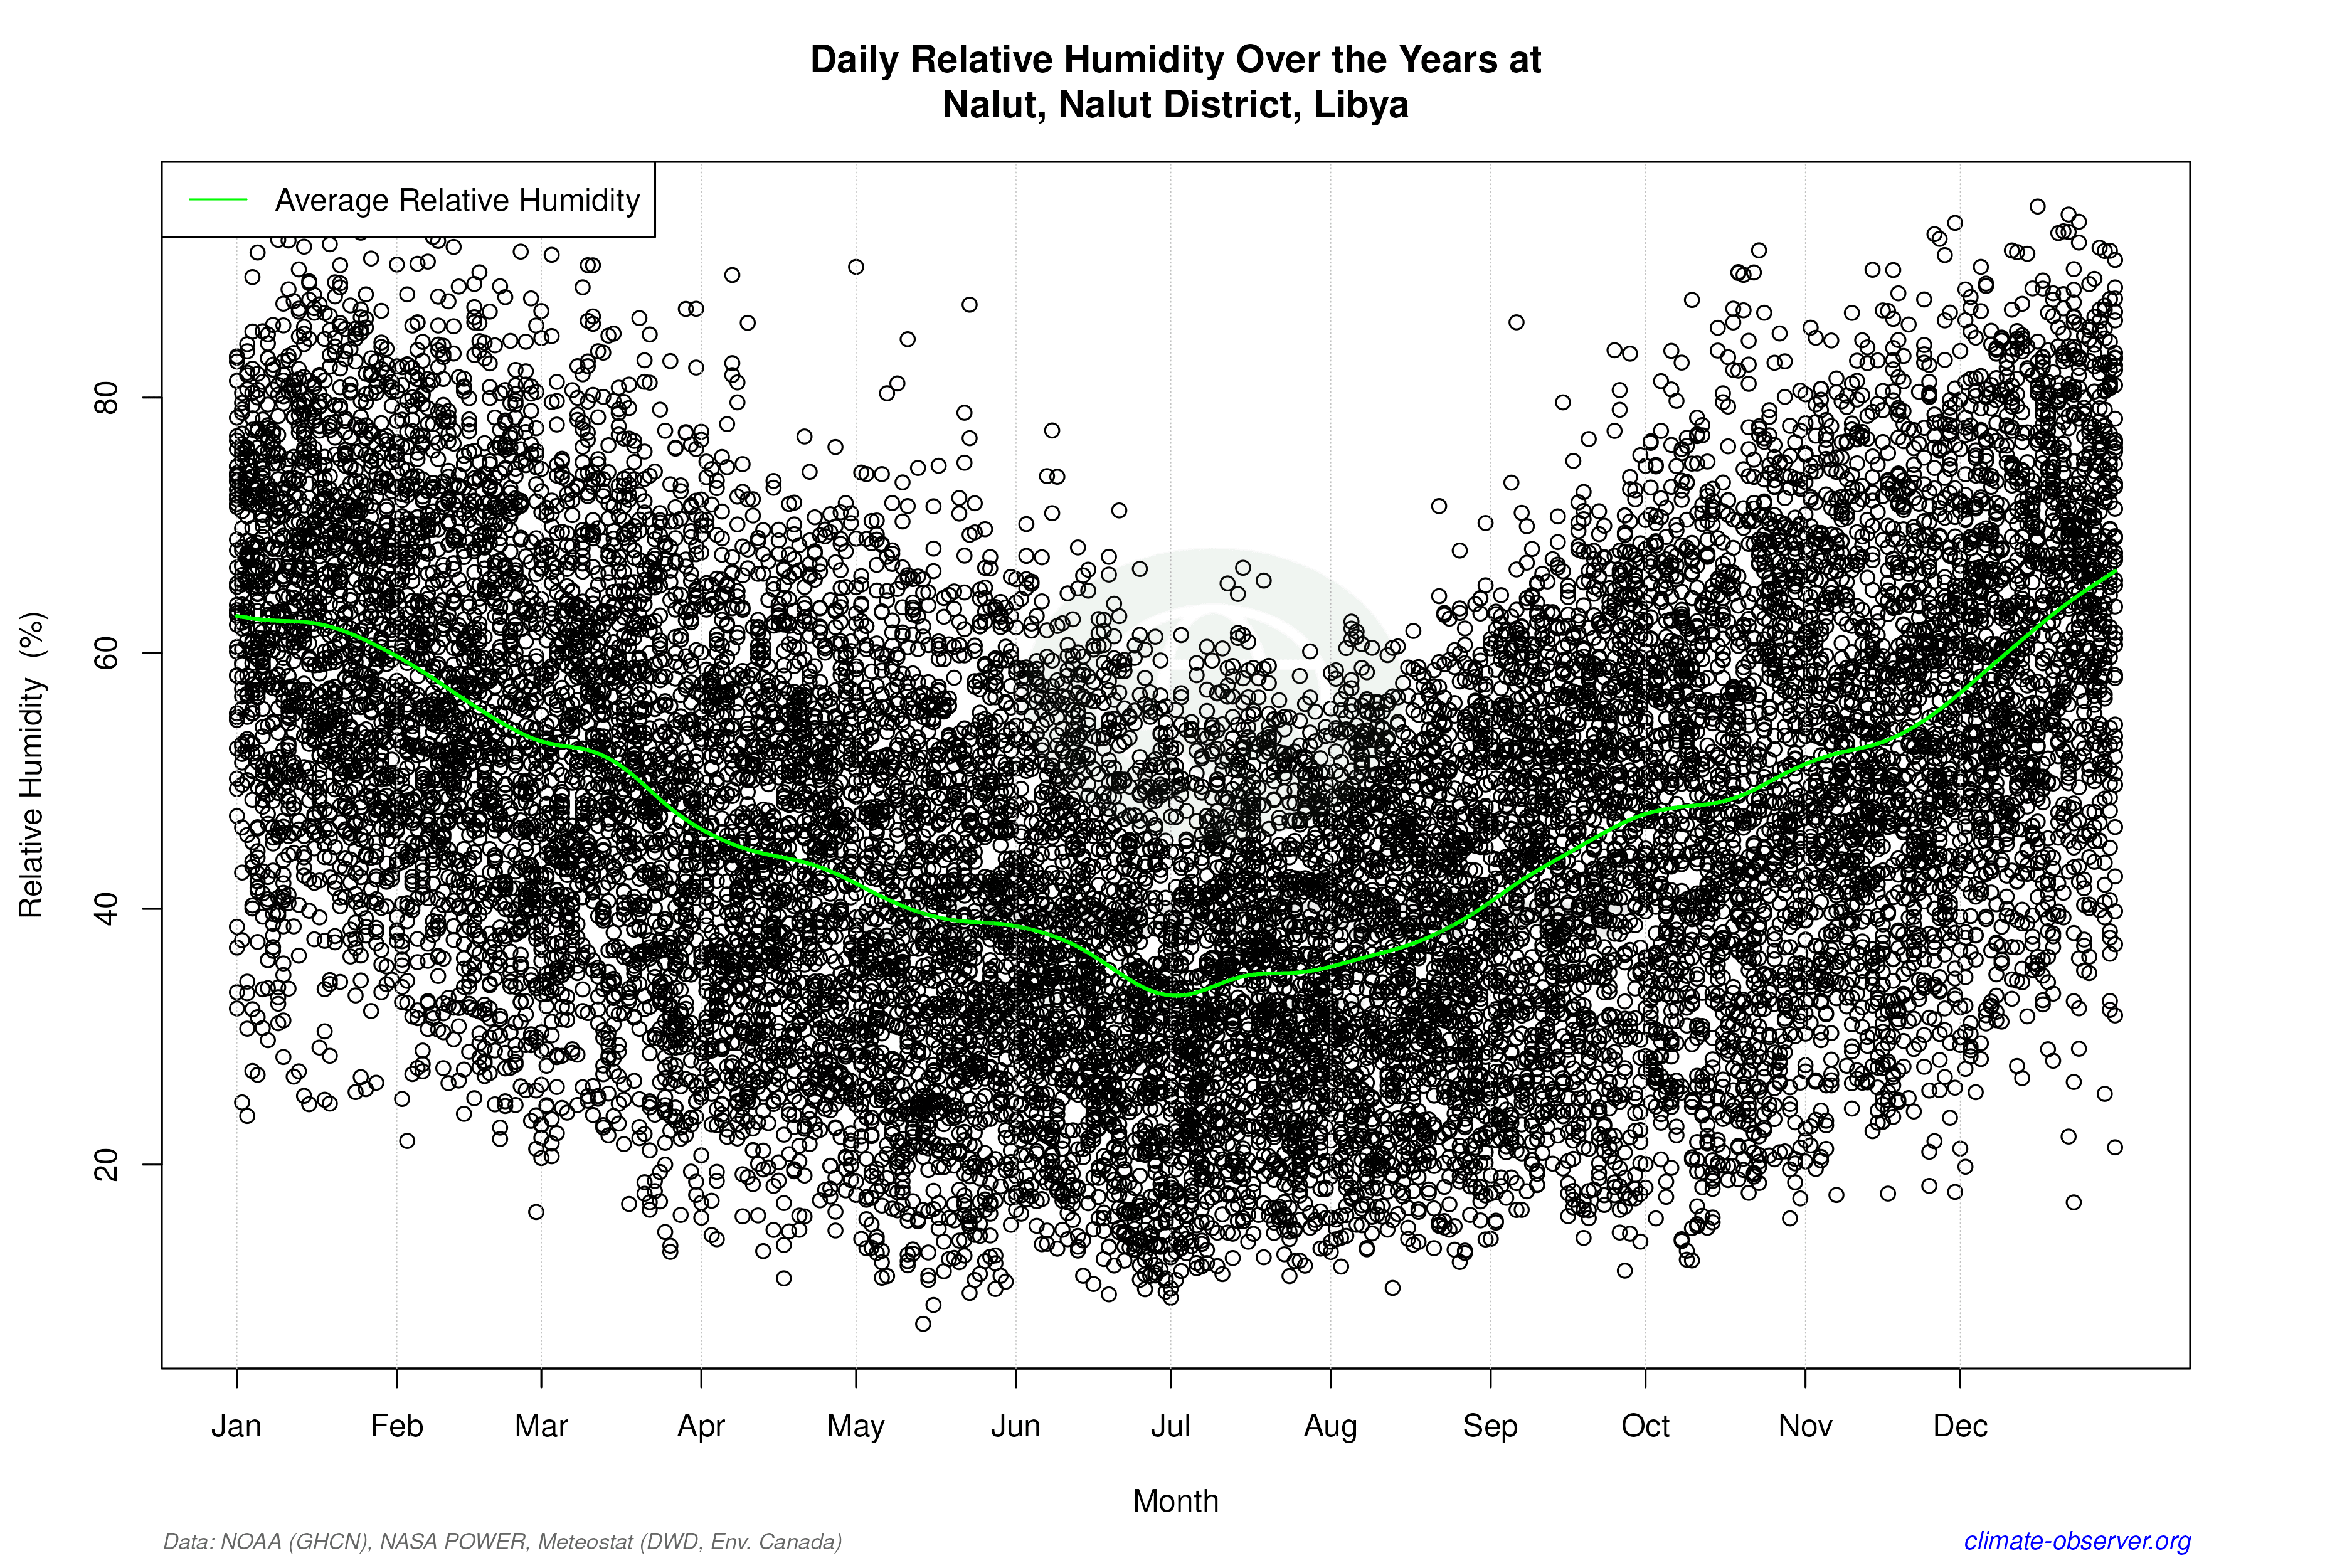

Average Max Temperature Throughout Year | 1 of 5
