Climate for Station: Benghazi Benina, Benghazi District, Libya
Loading live weather...
Climate Analysis & Overview
Benghazi Benina's climate reflects complex thermal dynamics with a recent trend towards warmer highs and cooler lows over the past decade. Despite a historical cooling trend in high temperatures, the region's precipitation is becoming more evenly distributed, indicating shifts in climatic patterns.
Thermal Dynamics in Benghazi Benina
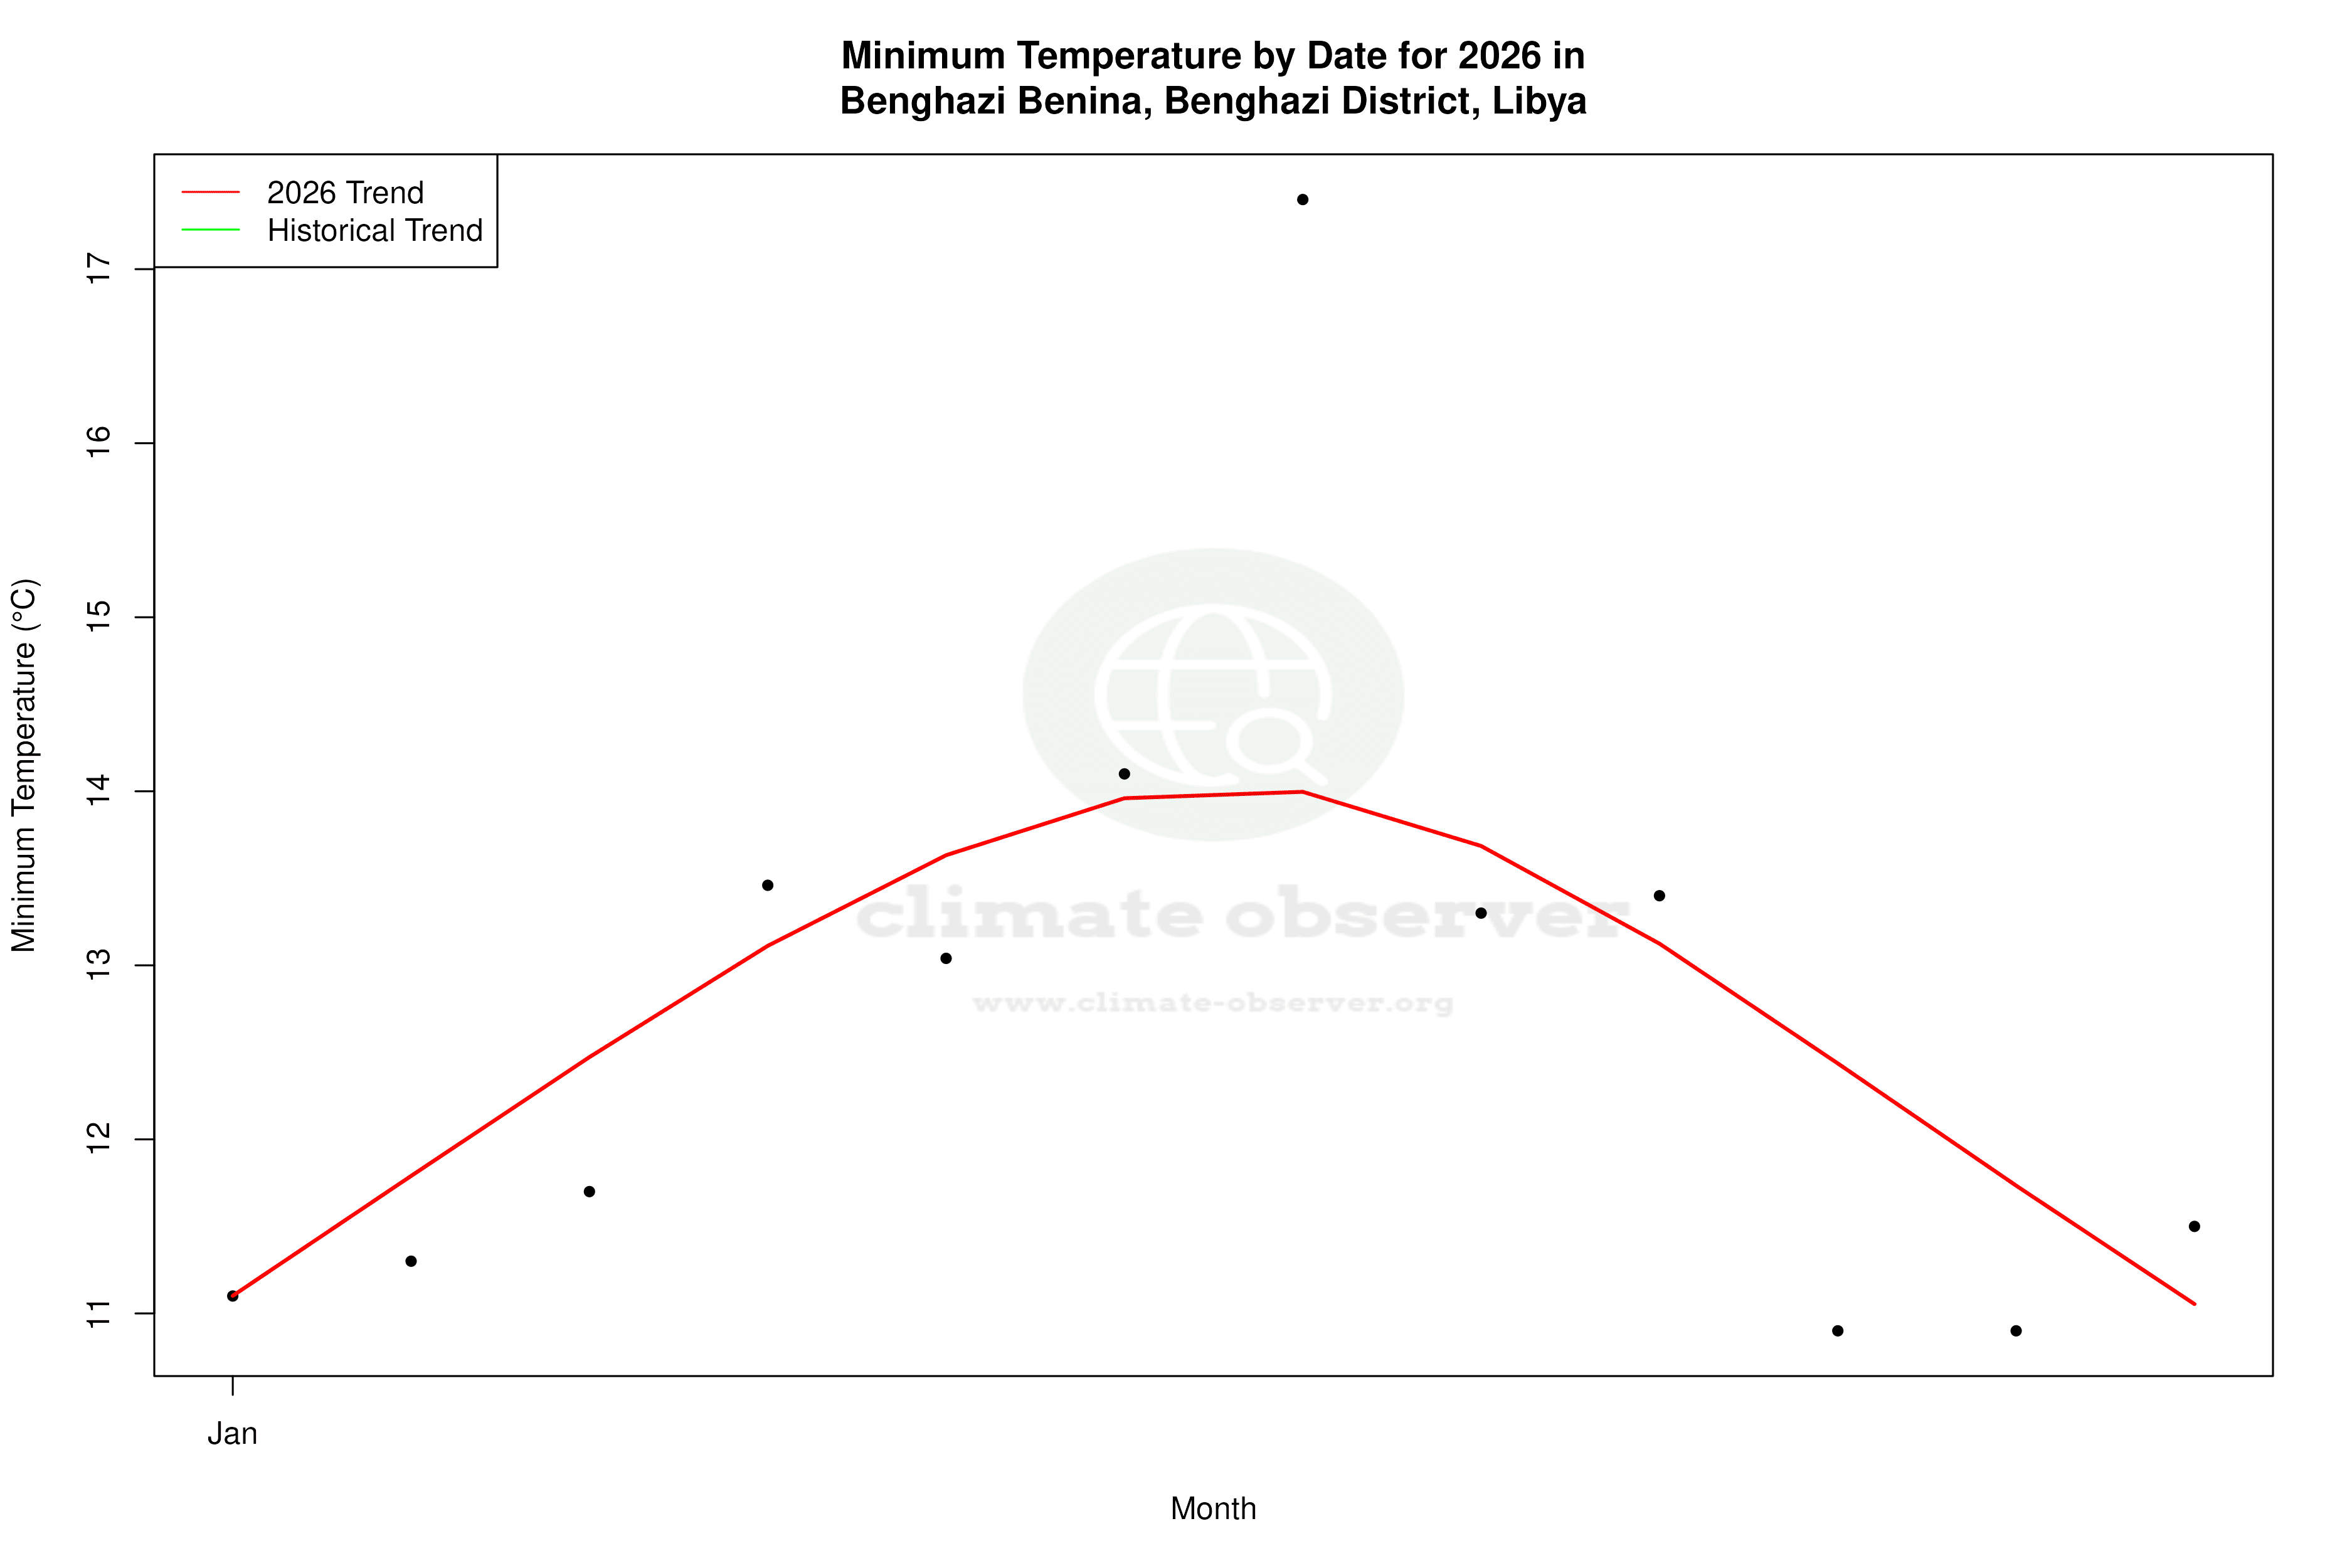
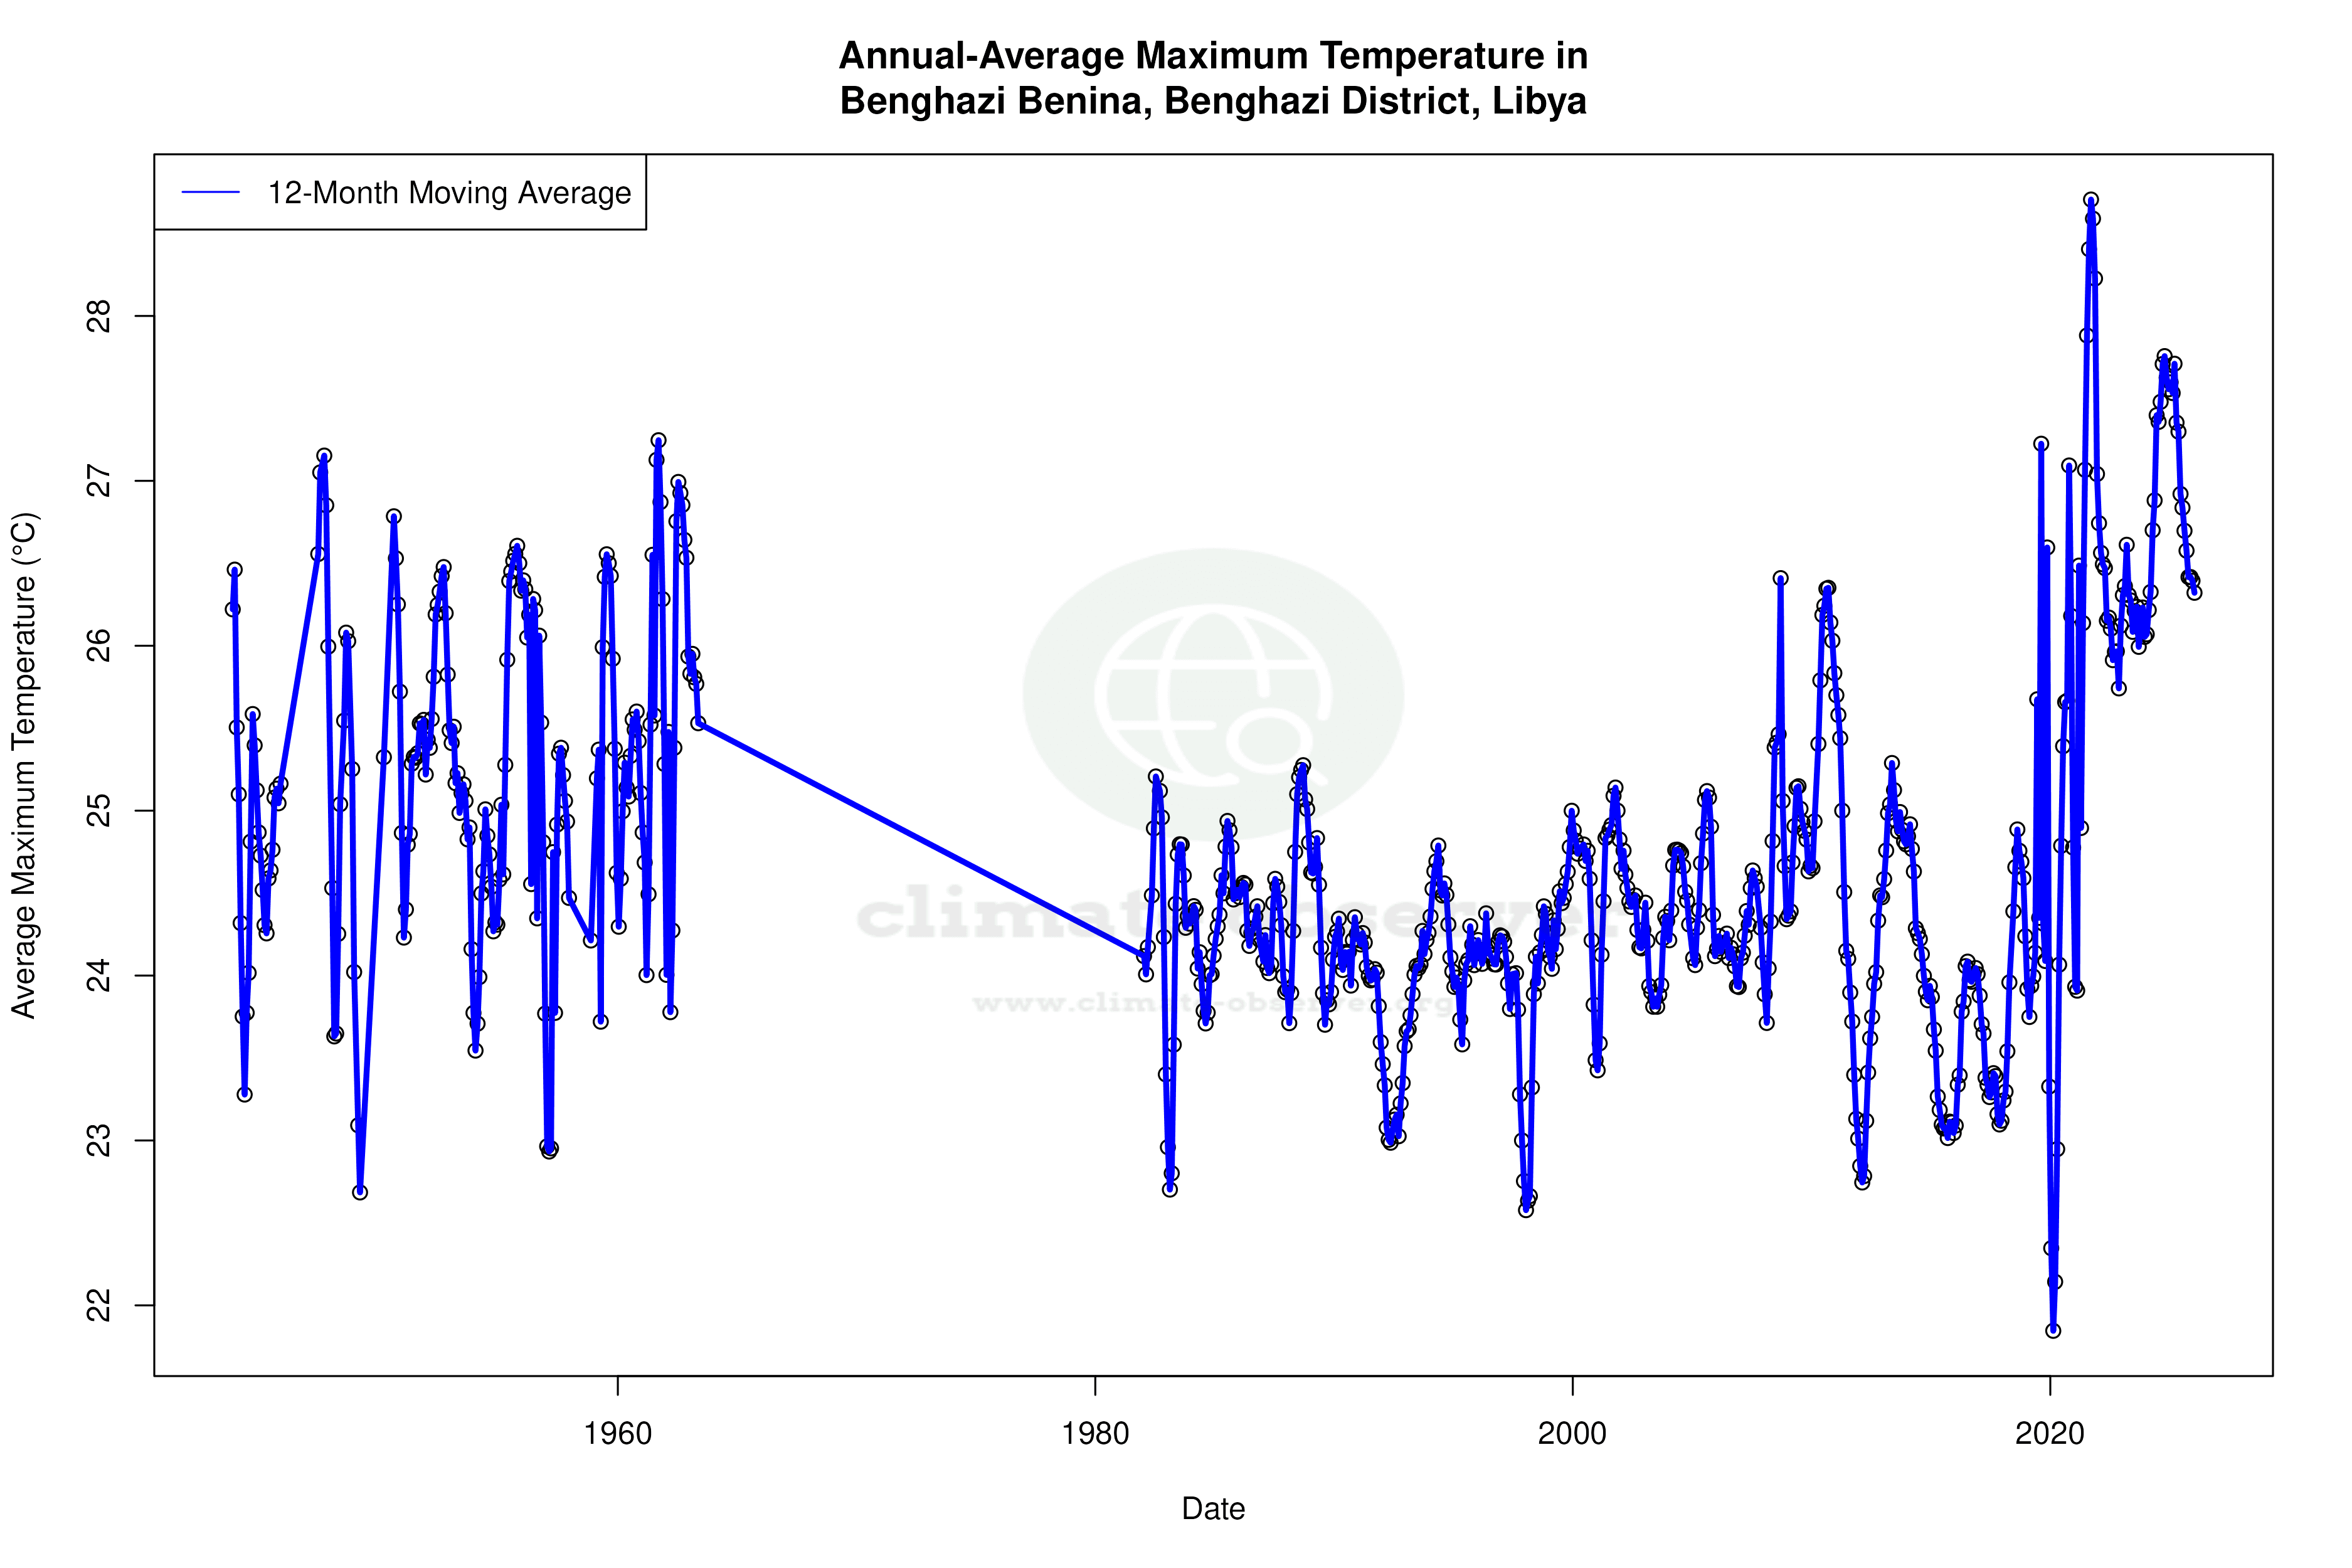
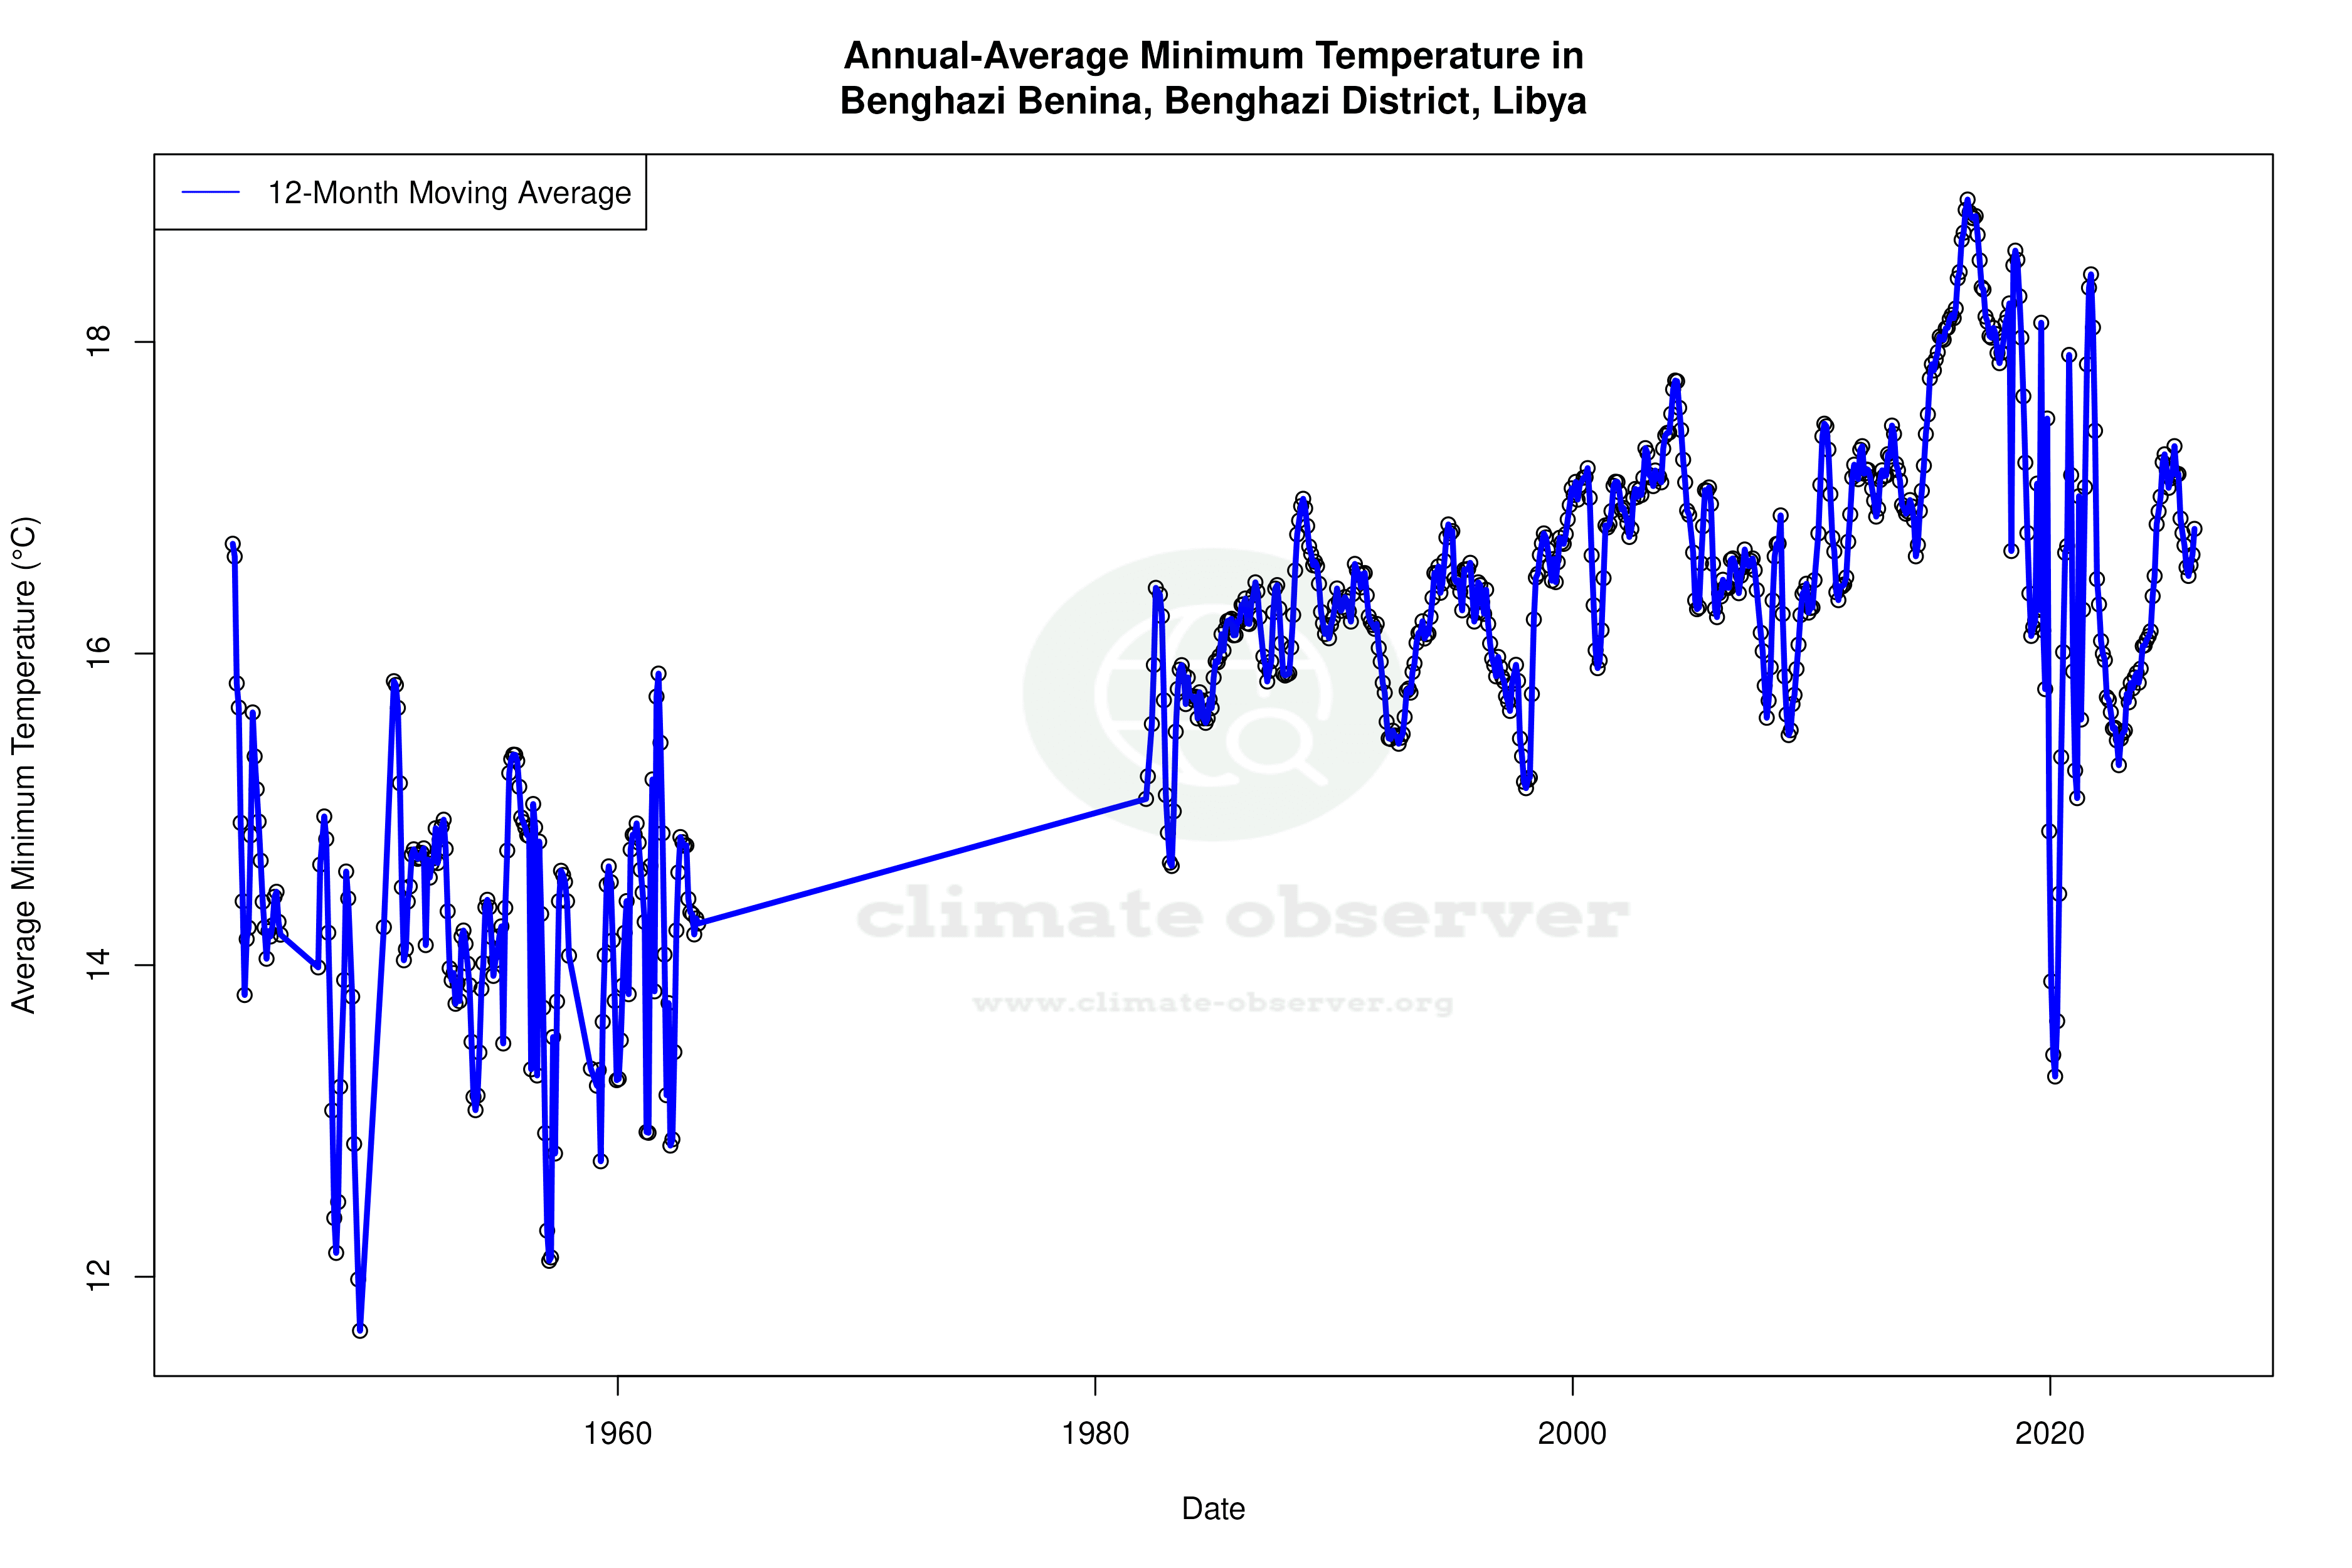
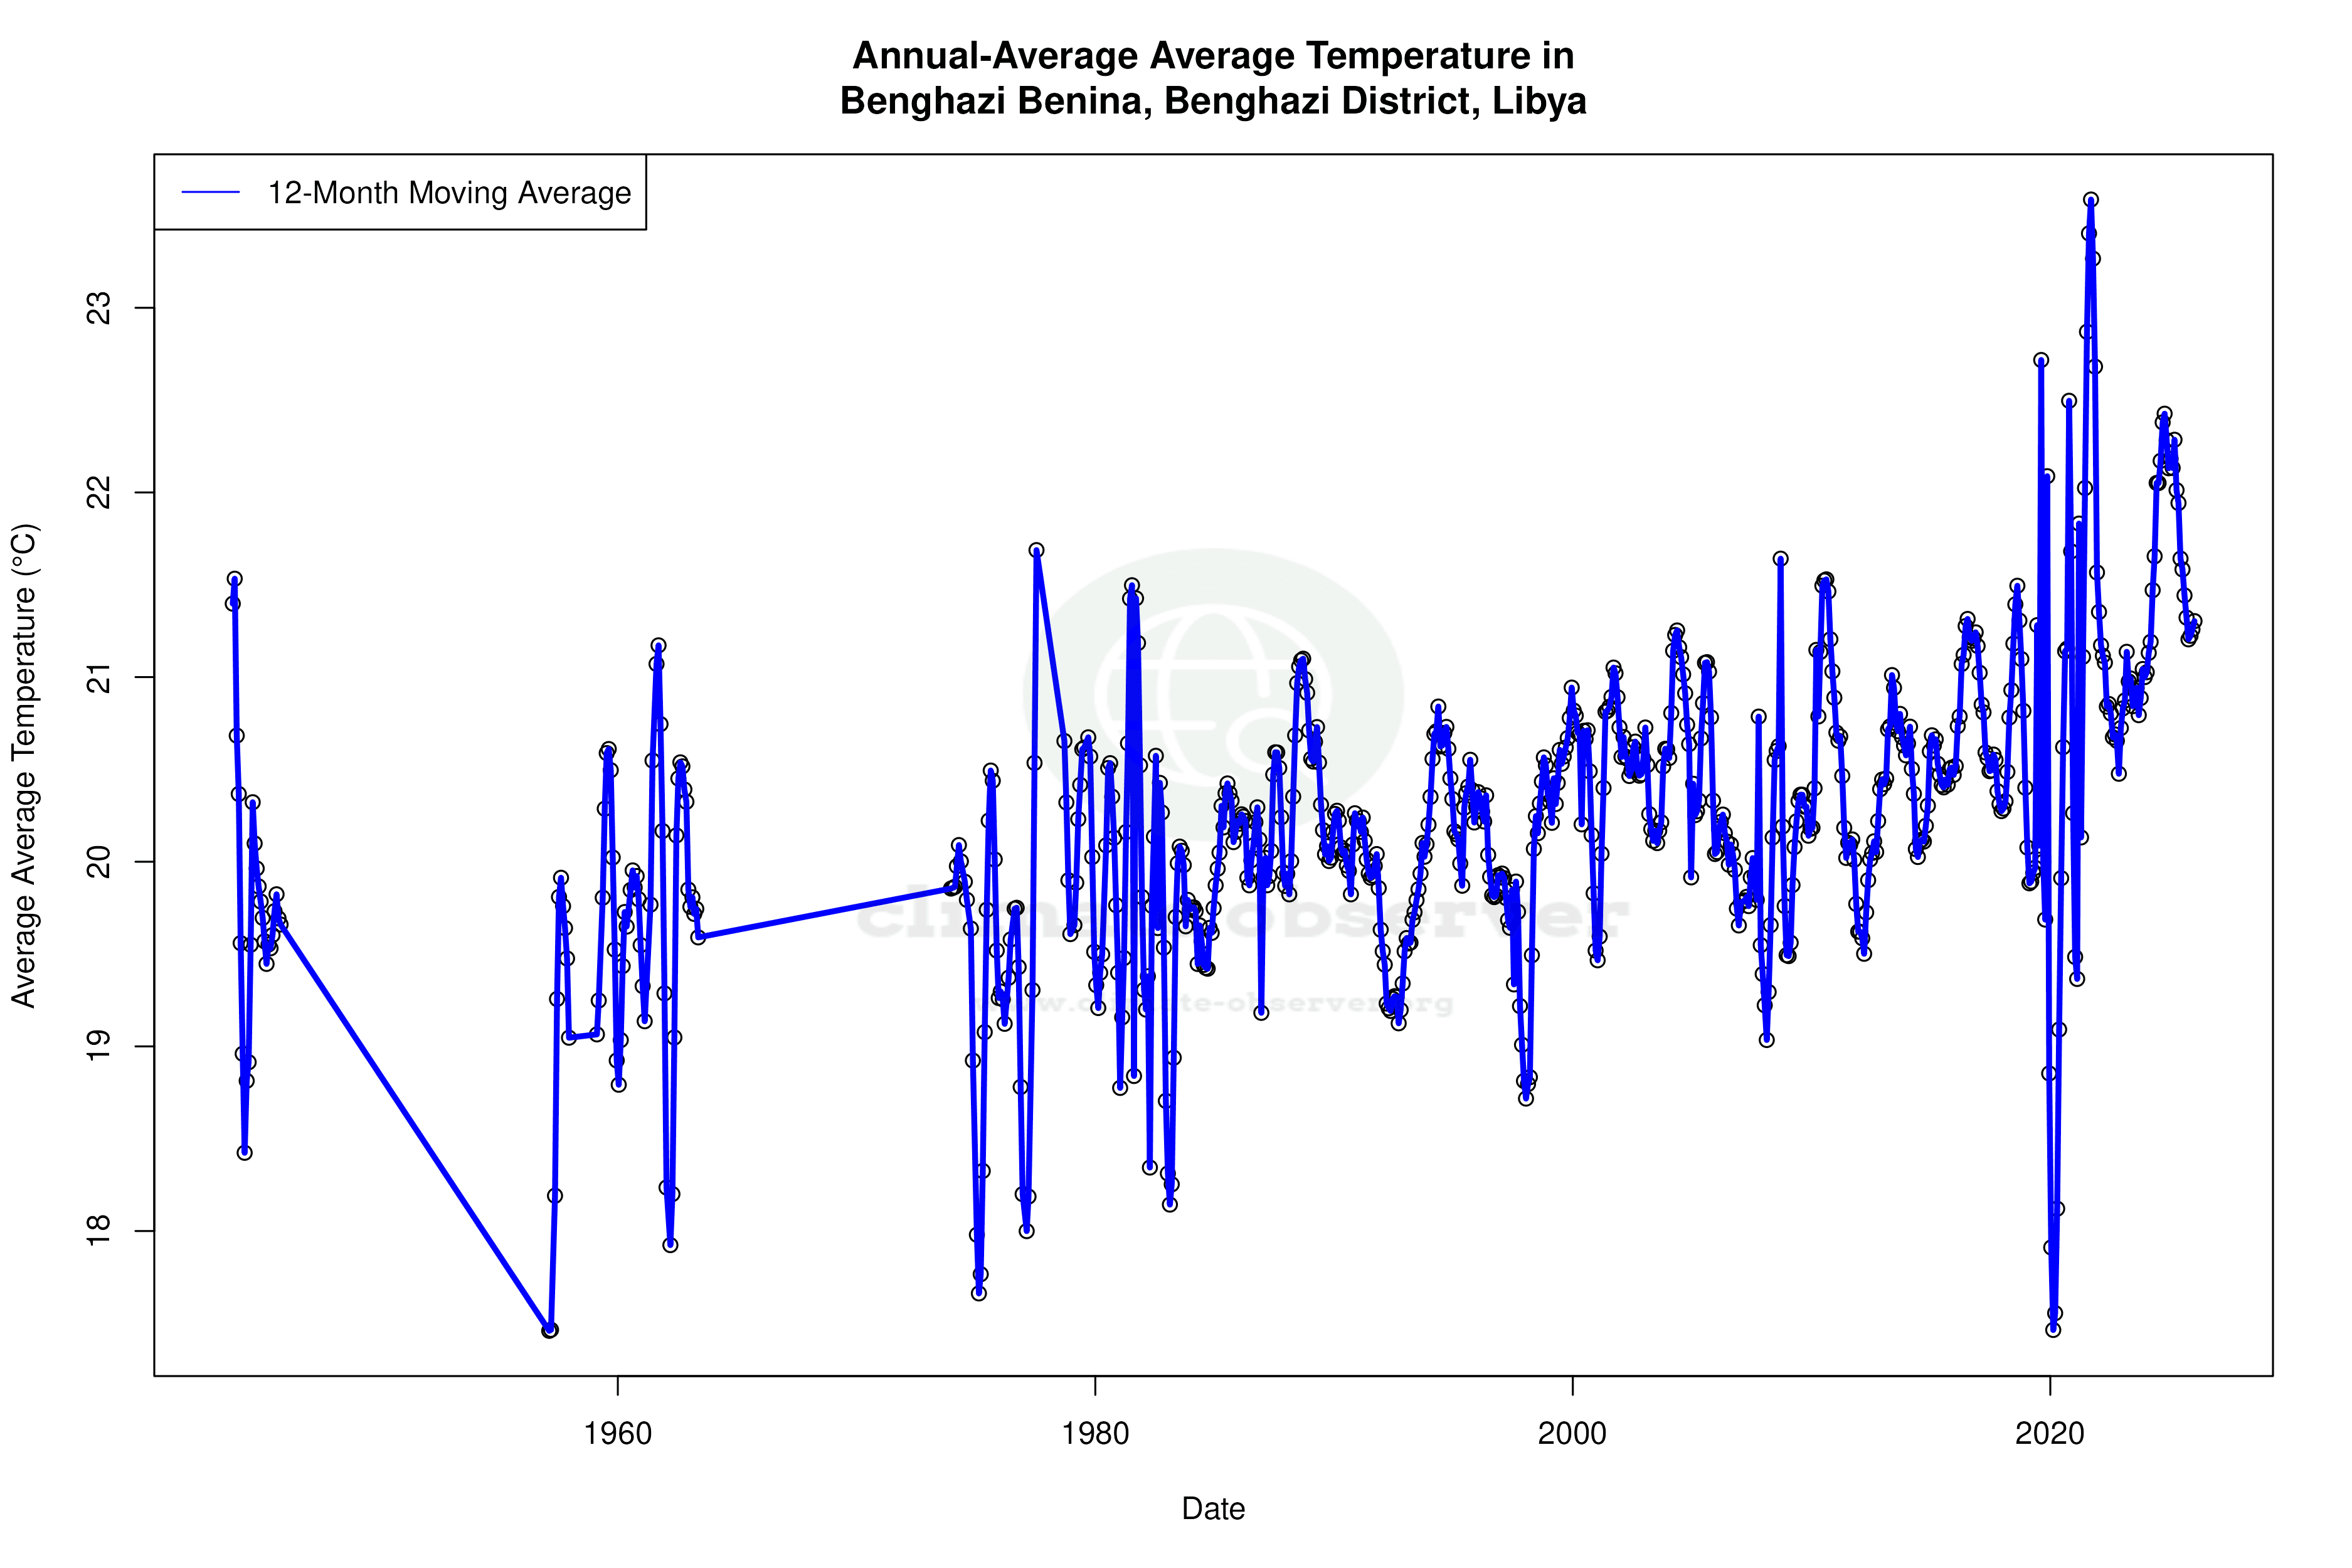
Benghazi Benina, located at 32.08°N, 20.27°E, experiences a hot desert climate, classified as BWh under the Köppen system. This classification is typical for regions with high temperatures and scarce precipitation, influenced by its proximity to the Mediterranean Sea. Over the past decade, the area has seen a significant warming trend in high temperatures, with an increase of 4.10°C (7.38°F). Conversely, the lows have cooled by 2.16°C (3.89°F), illustrating a complex interplay of climatic forces.
Historical Temperature Trends
Examining the all-time data, Benghazi Benina shows a slight historical cooling in high temperatures, with a decrease of 0.04°C (0.07°F). However, the low temperatures have seen a warming trend, rising by 0.43°C (0.77°F). These trends suggest a gradual shift in temperature patterns, possibly influenced by broader regional climatic changes in Libya, which has been focusing on climate resilience and adaptation strategies.
Precipitation Patterns and Distribution
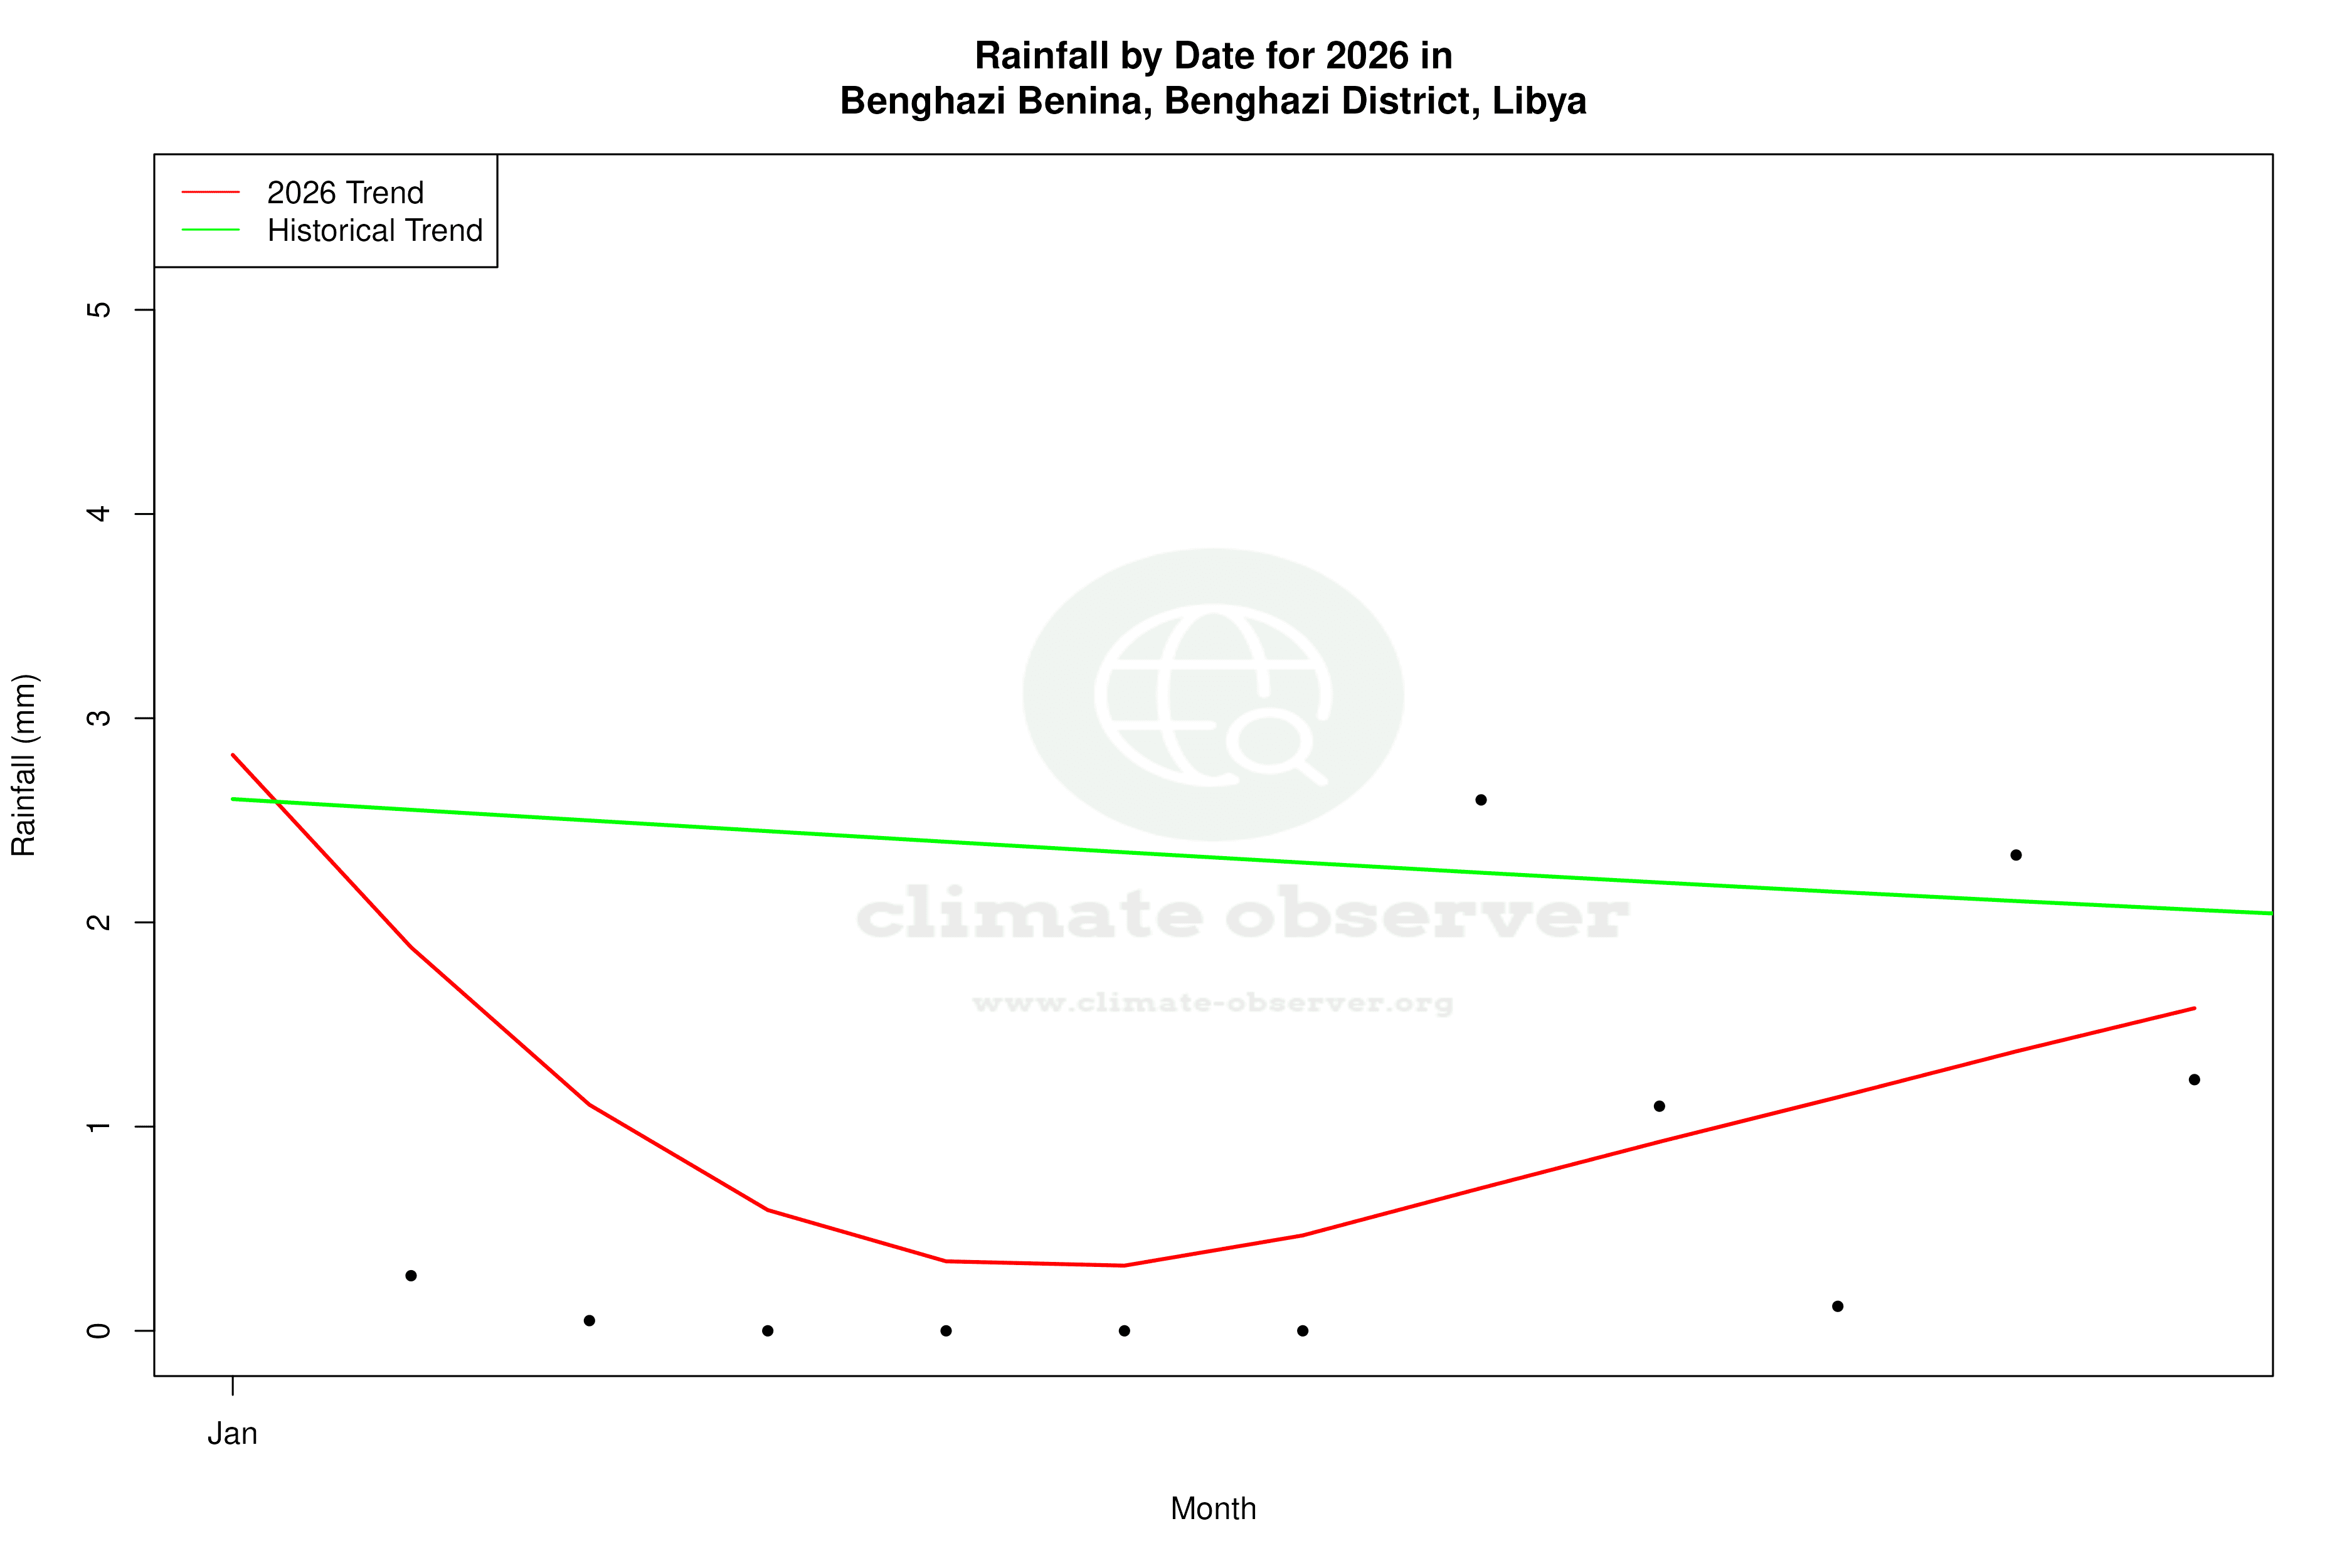
The Precipitation Concentration Index (PCI) offers insights into rainfall distribution. Benghazi Benina's PCI has decreased from a baseline of 23.66 to a current value of 19.24. This indicates a more even distribution of precipitation over time, moving away from highly concentrated rainfall events. Such a shift can have significant implications for water resource management and agricultural planning in the region.
Record Extremes and Implications
The station has recorded extreme temperatures, with a maximum of 45.0°C (113.0°F) and a minimum of -0.1°C (31.8°F). These records highlight the potential for extreme weather events, which are critical considerations for infrastructure and public health planning. As Libya continues to navigate its climate goals, understanding these extremes is essential for developing effective mitigation and adaptation strategies.
Regional Climate Considerations
The recent climatic trends in Benghazi Benina must be viewed within the broader context of Libya's climate initiatives. The country's efforts to address climate change include enhancing adaptive capacity and reducing vulnerability to climate impacts. The observed changes in temperature and precipitation patterns at Benghazi Benina provide valuable data for informing these national strategies.
Station Statistics
10-Year Trend
High: +6.68 °F/decade
Low: -3.30 °F/decade
Rain: +0.011 in/decade
25-Year Trend
High: +1.45 °F/decade
Low: -0.20 °F/decade
Rain: +0.001 in/decade
50-Year Trend
High: +0.61 °F/decade
Low: +0.40 °F/decade
Rain: -0.001 in/decade
All-Time Trend
High: -0.07 °F/decade
Low: +0.77 °F/decade
Rain: -0.001 in/decade
Percentage Above-Average Days
Last 12 Months: 50.0%
This Year: 47.0%
Precipitation Concentration Index (PCI) ℹ️
Last 12 Months: 19.2
Historical Average: 23.7
Percentile Rank of Last 12 Months ℹ️
High: 94th percentile
Low: 75th percentile
Rain: 19th percentile
Change in Variance ℹ️
High: -1.6%
Low: +3.9%
Intraday: -15.0%
Data Coverage
80.1%
First Year of Data
1943
Station Location
Historical Weather Records
| Max High | Avg High | Min High | Max Avg | Avg Avg | Min Avg | Max Low | Avg Low | Min Low | Max Precipitation | Avg Precipitation | Max Snow | Avg Snow | |
|---|---|---|---|---|---|---|---|---|---|---|---|---|---|
| Record | 113.00 °F | — | 44.60 °F | 100.58 °F | — | 40.82 °F | 90.14 °F | — | 31.82 °F | 7.86 in | — | — | — |
| January | 84.20 °F | 62.22 °F | 44.60 °F | 71.42 °F | 55.13 °F | 40.82 °F | 66.20 °F | 49.76 °F | 32.00 °F | 2.13 in | 0.08 in | — | — |
| February | 88.88 °F | 63.31 °F | 48.20 °F | 75.38 °F | 55.59 °F | 42.98 °F | 64.76 °F | 49.15 °F | 32.00 °F | 3.04 in | 0.06 in | — | — |
| March | 100.04 °F | 67.76 °F | 49.10 °F | 83.12 °F | 59.46 °F | 43.70 °F | 75.20 °F | 51.20 °F | 31.82 °F | 2.60 in | 0.03 in | — | — |
| April | 104.18 °F | 74.90 °F | 55.94 °F | 89.96 °F | 65.92 °F | 51.44 °F | 81.86 °F | 56.17 °F | 33.80 °F | 0.71 in | 0.01 in | — | — |
| May | 113.00 °F | 81.82 °F | 62.96 °F | 98.42 °F | 72.46 °F | 57.74 °F | 87.98 °F | 62.23 °F | 44.06 °F | 0.83 in | 0.01 in | — | — |
| June | 113.00 °F | 87.01 °F | 69.66 °F | 100.58 °F | 77.96 °F | 64.04 °F | 90.14 °F | 67.62 °F | 41.00 °F | 0.31 in | 0.00 in | — | — |
| July | 109.40 °F | 88.11 °F | 75.02 °F | 96.08 °F | 79.71 °F | 62.78 °F | 87.80 °F | 70.75 °F | 51.08 °F | 0.19 in | 0.00 in | — | — |
| August | 111.02 °F | 88.89 °F | 77.00 °F | 93.38 °F | 80.49 °F | 70.52 °F | 85.10 °F | 72.03 °F | 51.80 °F | 0.87 in | 0.00 in | — | — |
| September | 106.70 °F | 86.65 °F | 71.60 °F | 92.84 °F | 78.06 °F | 66.56 °F | 83.48 °F | 69.69 °F | 48.92 °F | 1.42 in | 0.01 in | — | — |
| October | 105.80 °F | 81.49 °F | 63.50 °F | 91.04 °F | 72.70 °F | 57.92 °F | 81.32 °F | 65.13 °F | 41.00 °F | 2.05 in | 0.02 in | — | — |
| November | 98.96 °F | 73.31 °F | 51.08 °F | 85.64 °F | 65.10 °F | 47.84 °F | 78.80 °F | 58.59 °F | 35.60 °F | 1.84 in | 0.04 in | — | — |
| December | 86.00 °F | 65.37 °F | 44.96 °F | 74.84 °F | 58.11 °F | 48.02 °F | 68.00 °F | 52.87 °F | 33.44 °F | 7.86 in | 0.09 in | — | — |
Data Visualisations
Remove WatermarksCurrent Year Climate Trends vs Historical


Max Temperature this Year | 1 of 6
Climate 12-Month Moving Averages


Max Temperature 12-Month MA | 1 of 6
Daily Data Points and Averages Throughout the Year


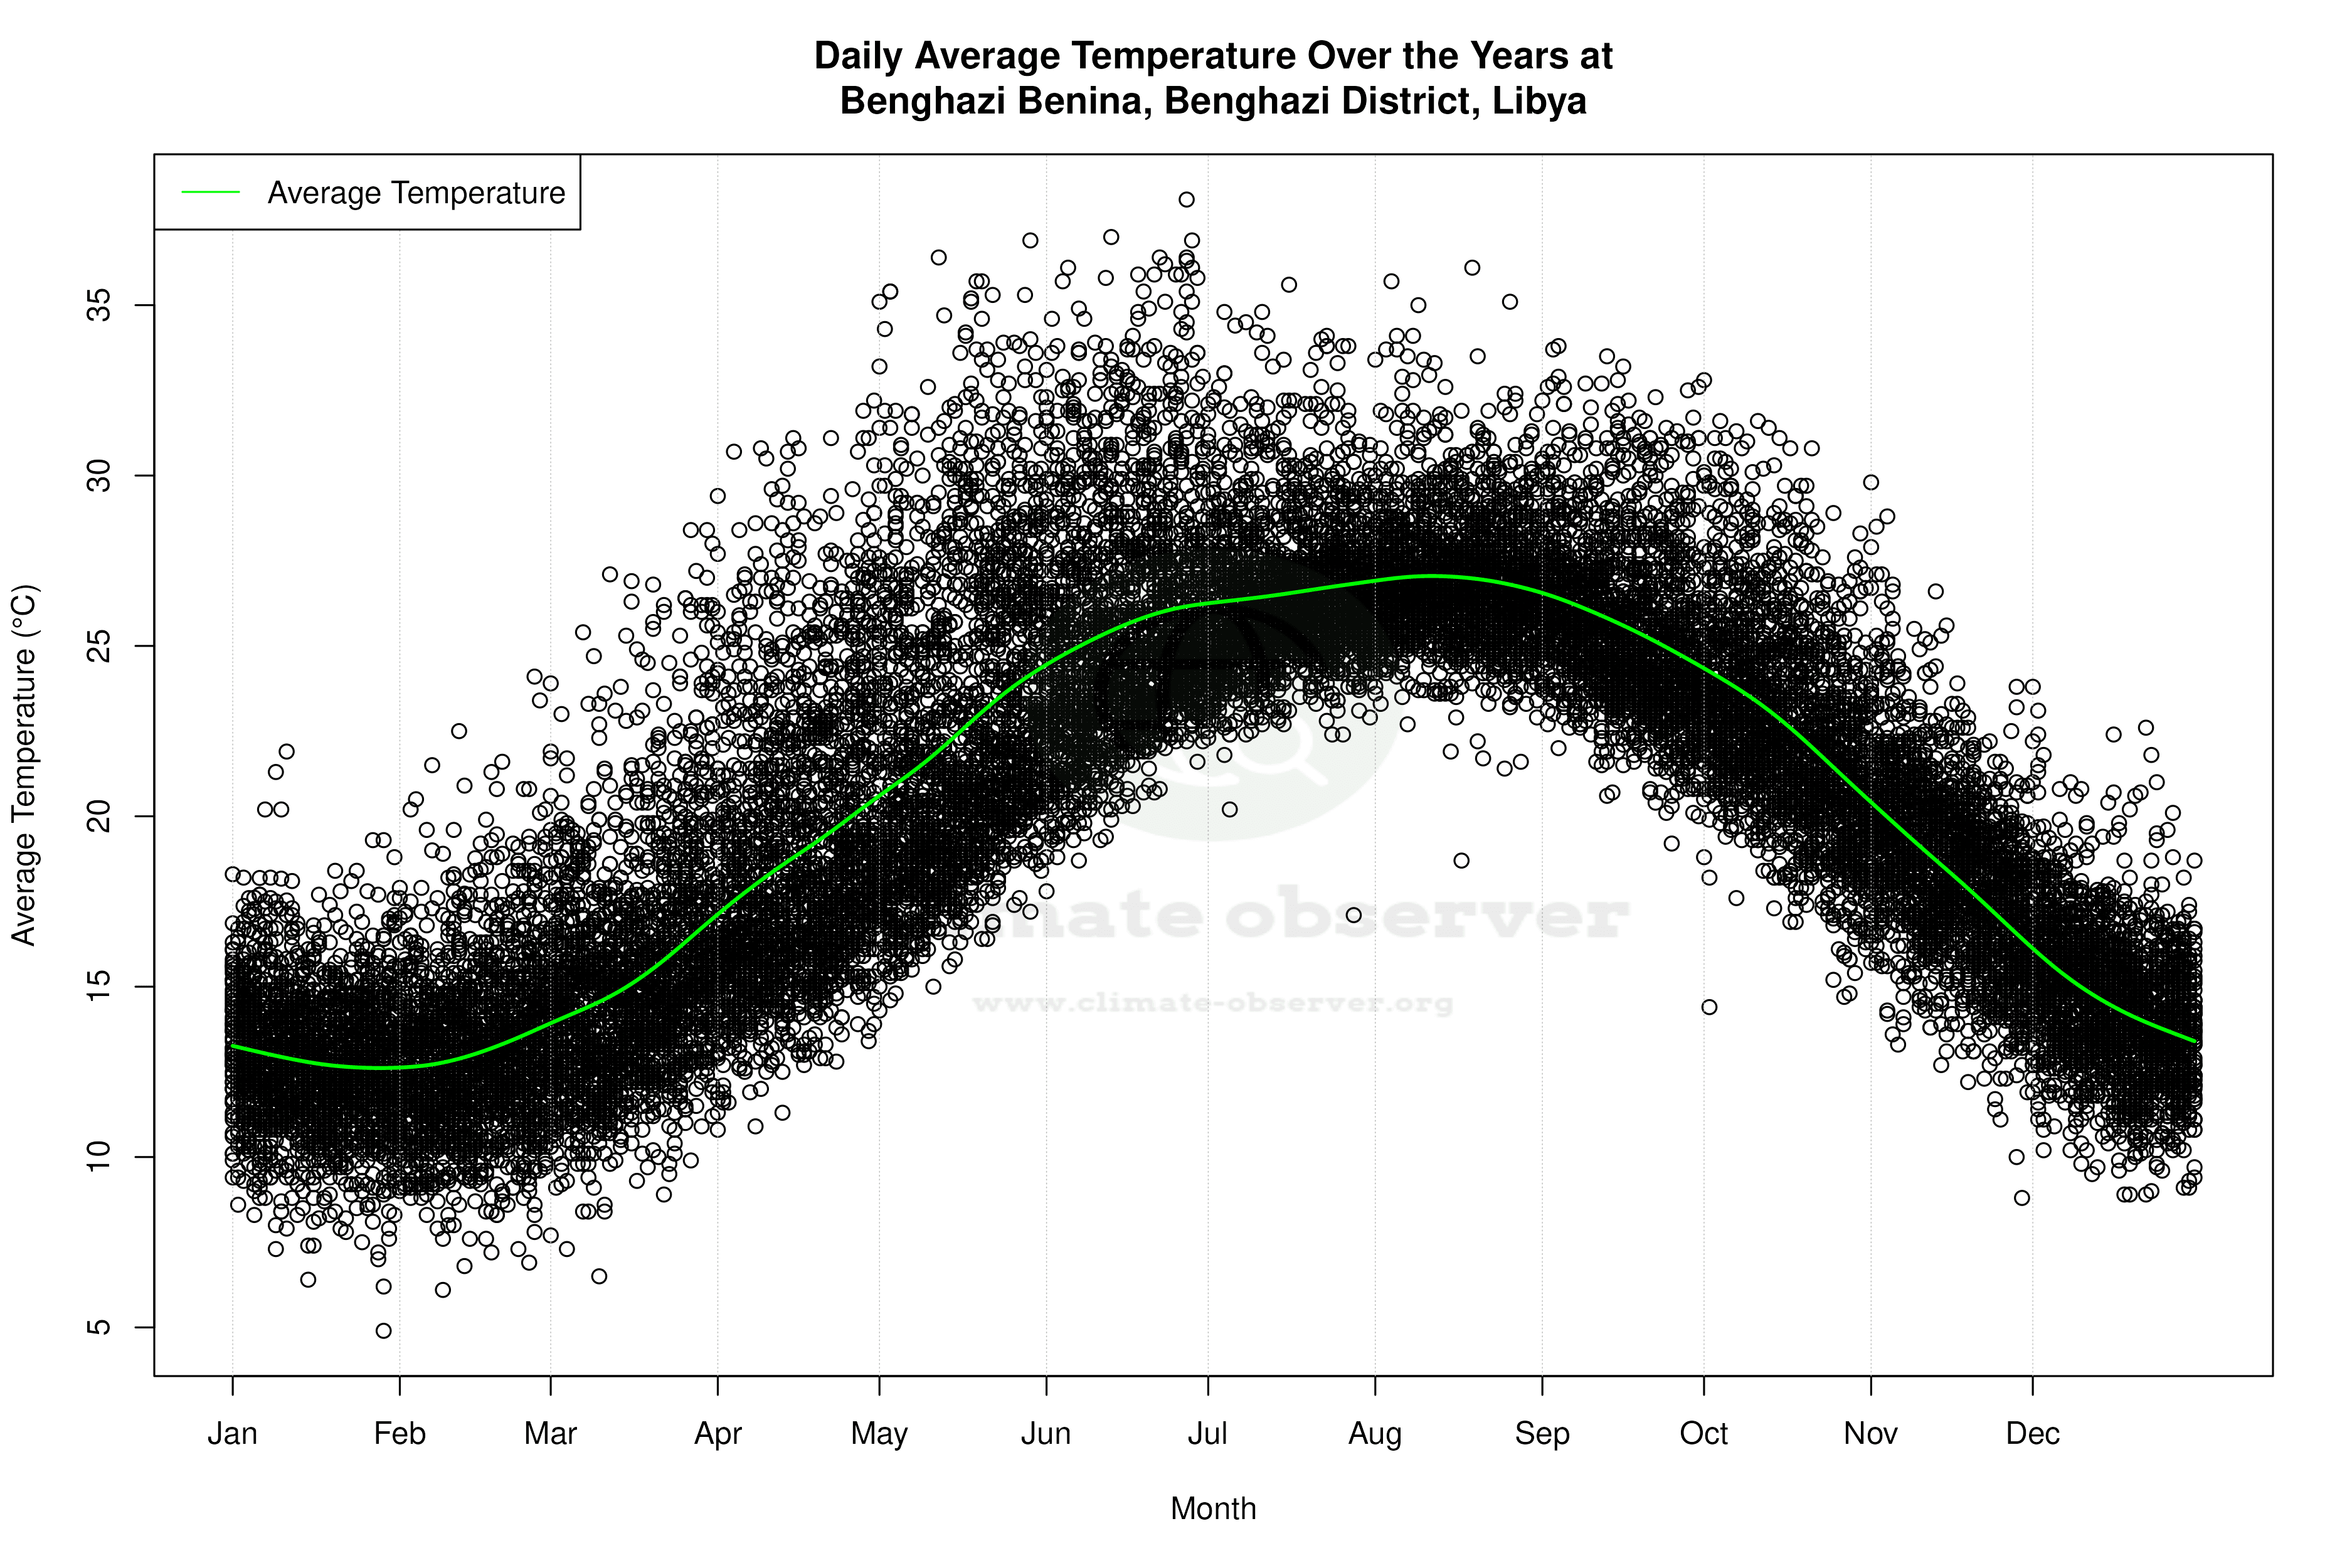

Average Max Temperature Throughout Year | 1 of 5
