Climate for Station: Agedabia, Al Wahat District, Libya
Loading live weather...
Climate Analysis & Overview
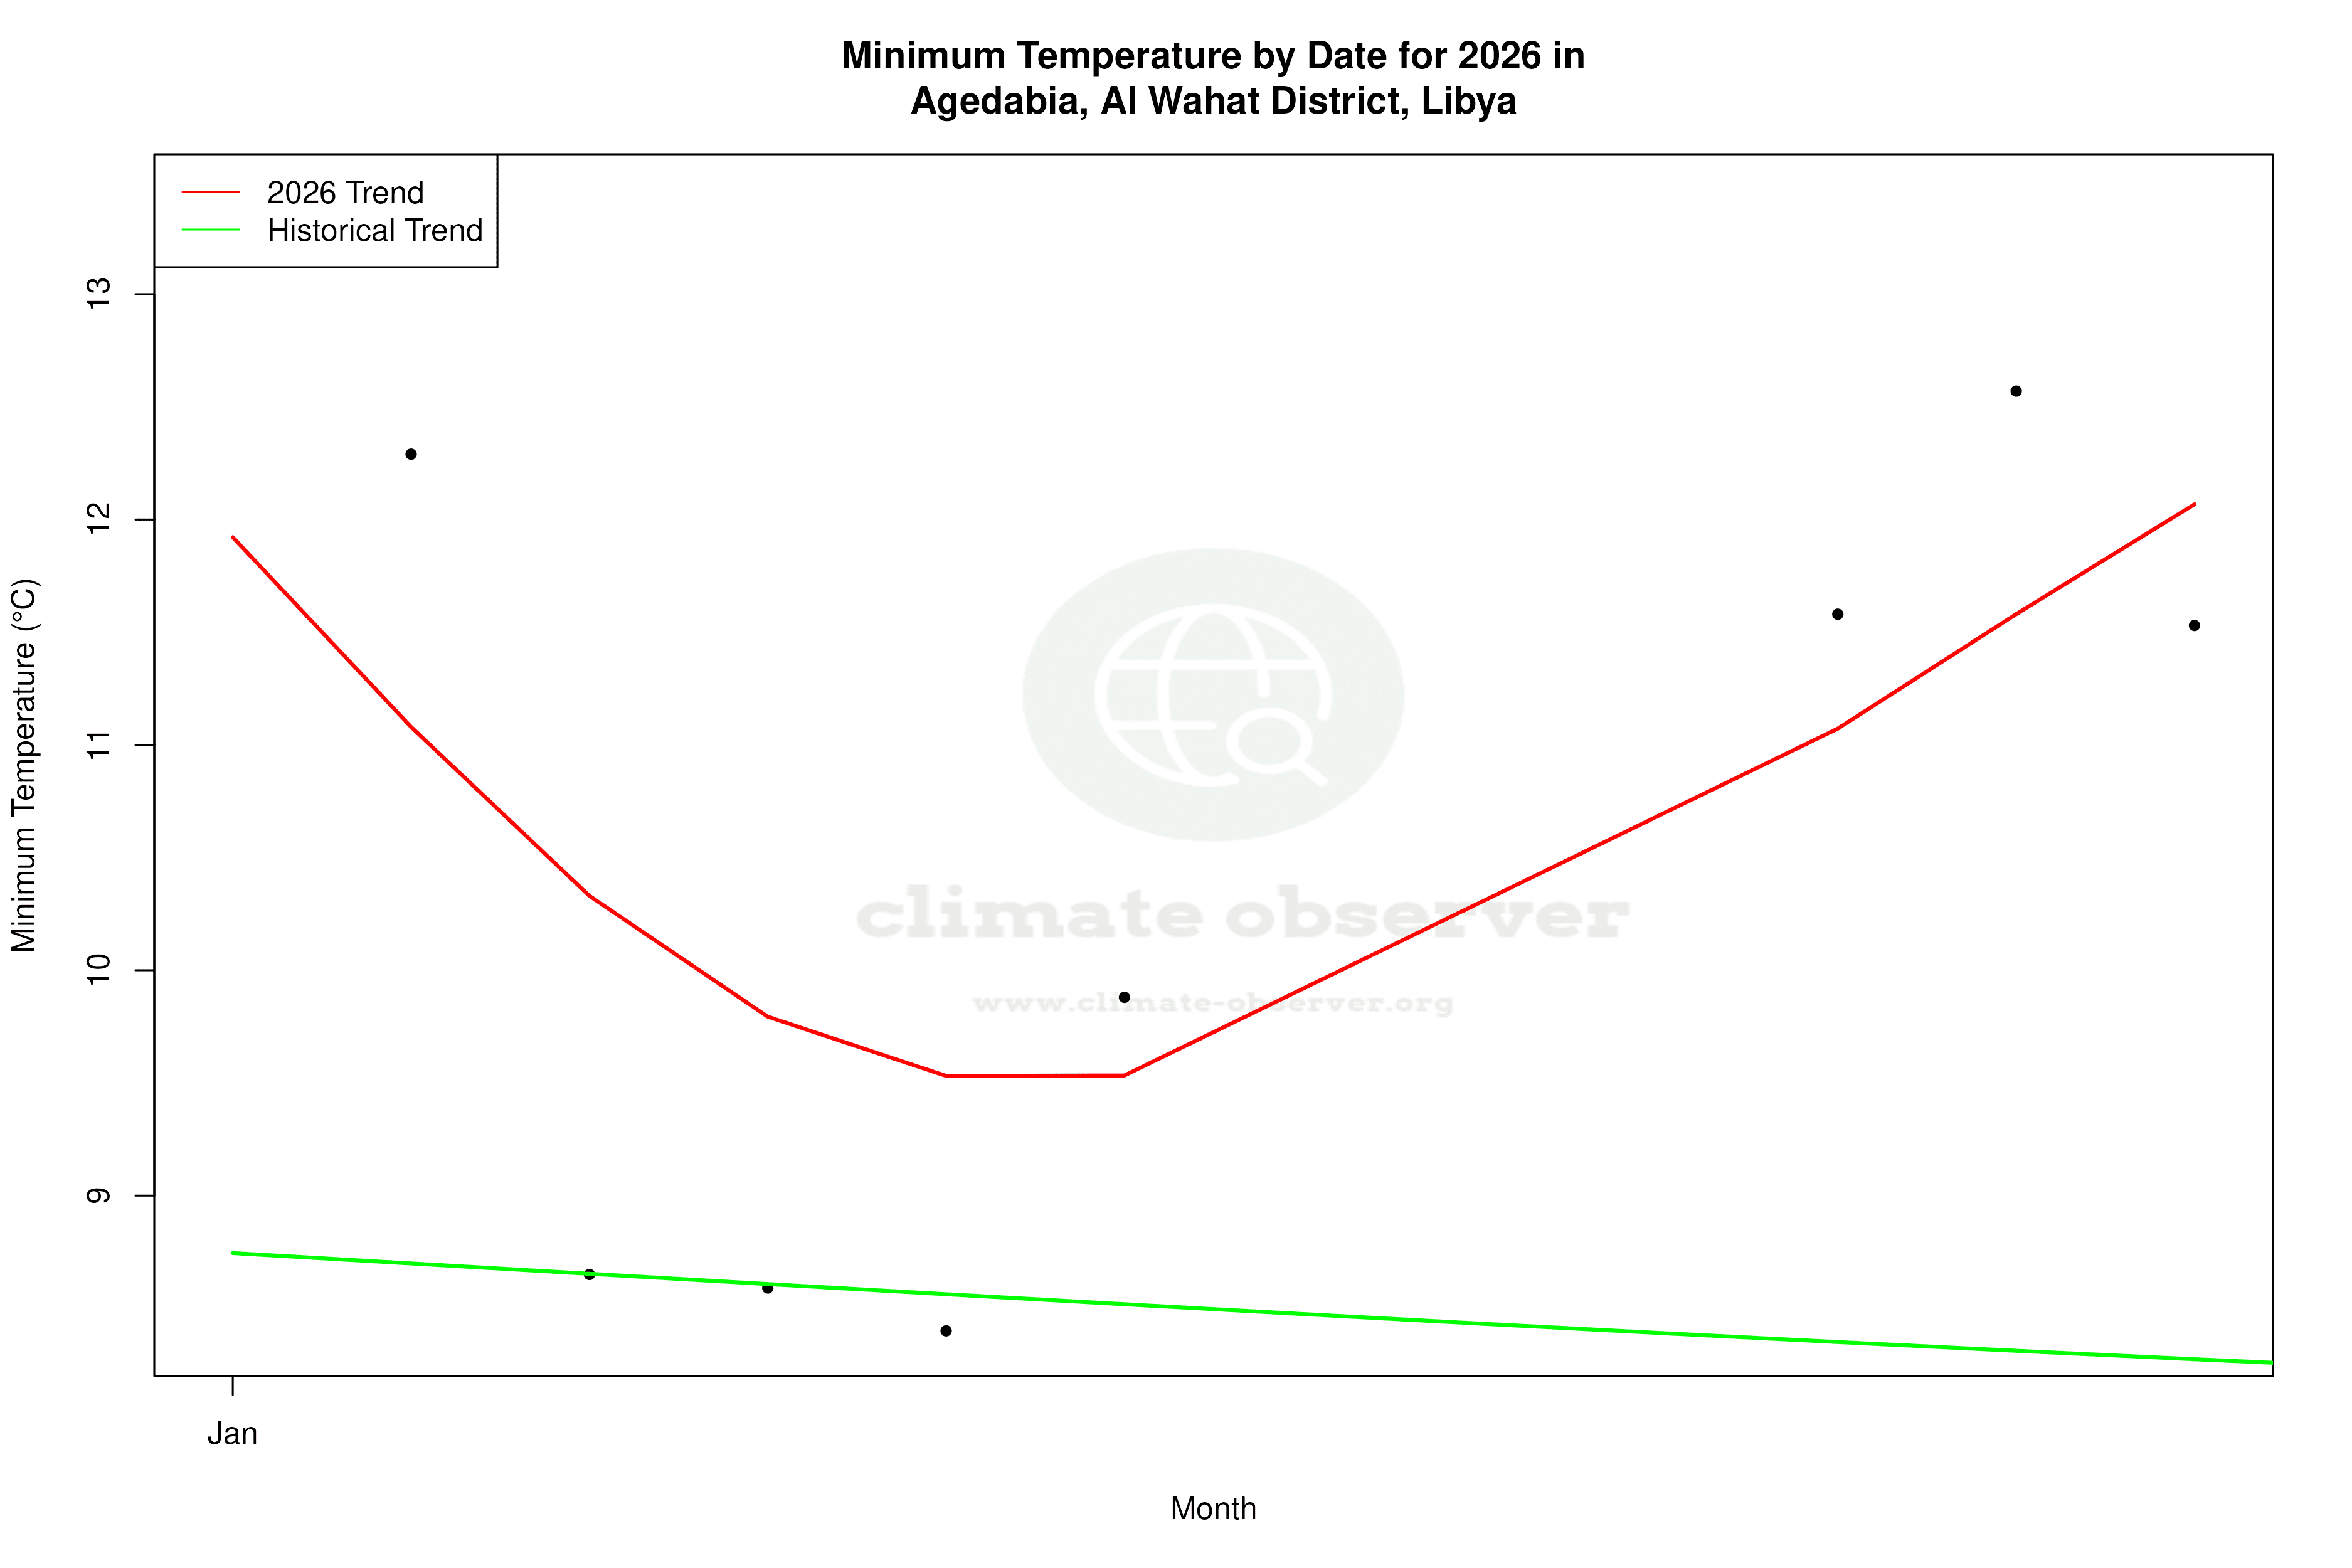
Agedabia, Libya, experiences a complex climate narrative marked by a long-term cooling trend in high temperatures and a warming trend in low temperatures. Over the past decade, however, both high and low temperatures have shown a warming trend. Precipitation has become more evenly distributed, indicating a shift in rainfall patterns.
Desert Climate Dynamics
Agedabia is situated in Libya's arid desert region, classified under the Köppen climate system as a hot desert climate (BWh). This classification is characterised by extremely high temperatures and minimal precipitation. The geographical location, with its expansive desert terrain, influences the climate data, resulting in significant temperature variations between day and night.
Temperature Trends: Warming and Cooling
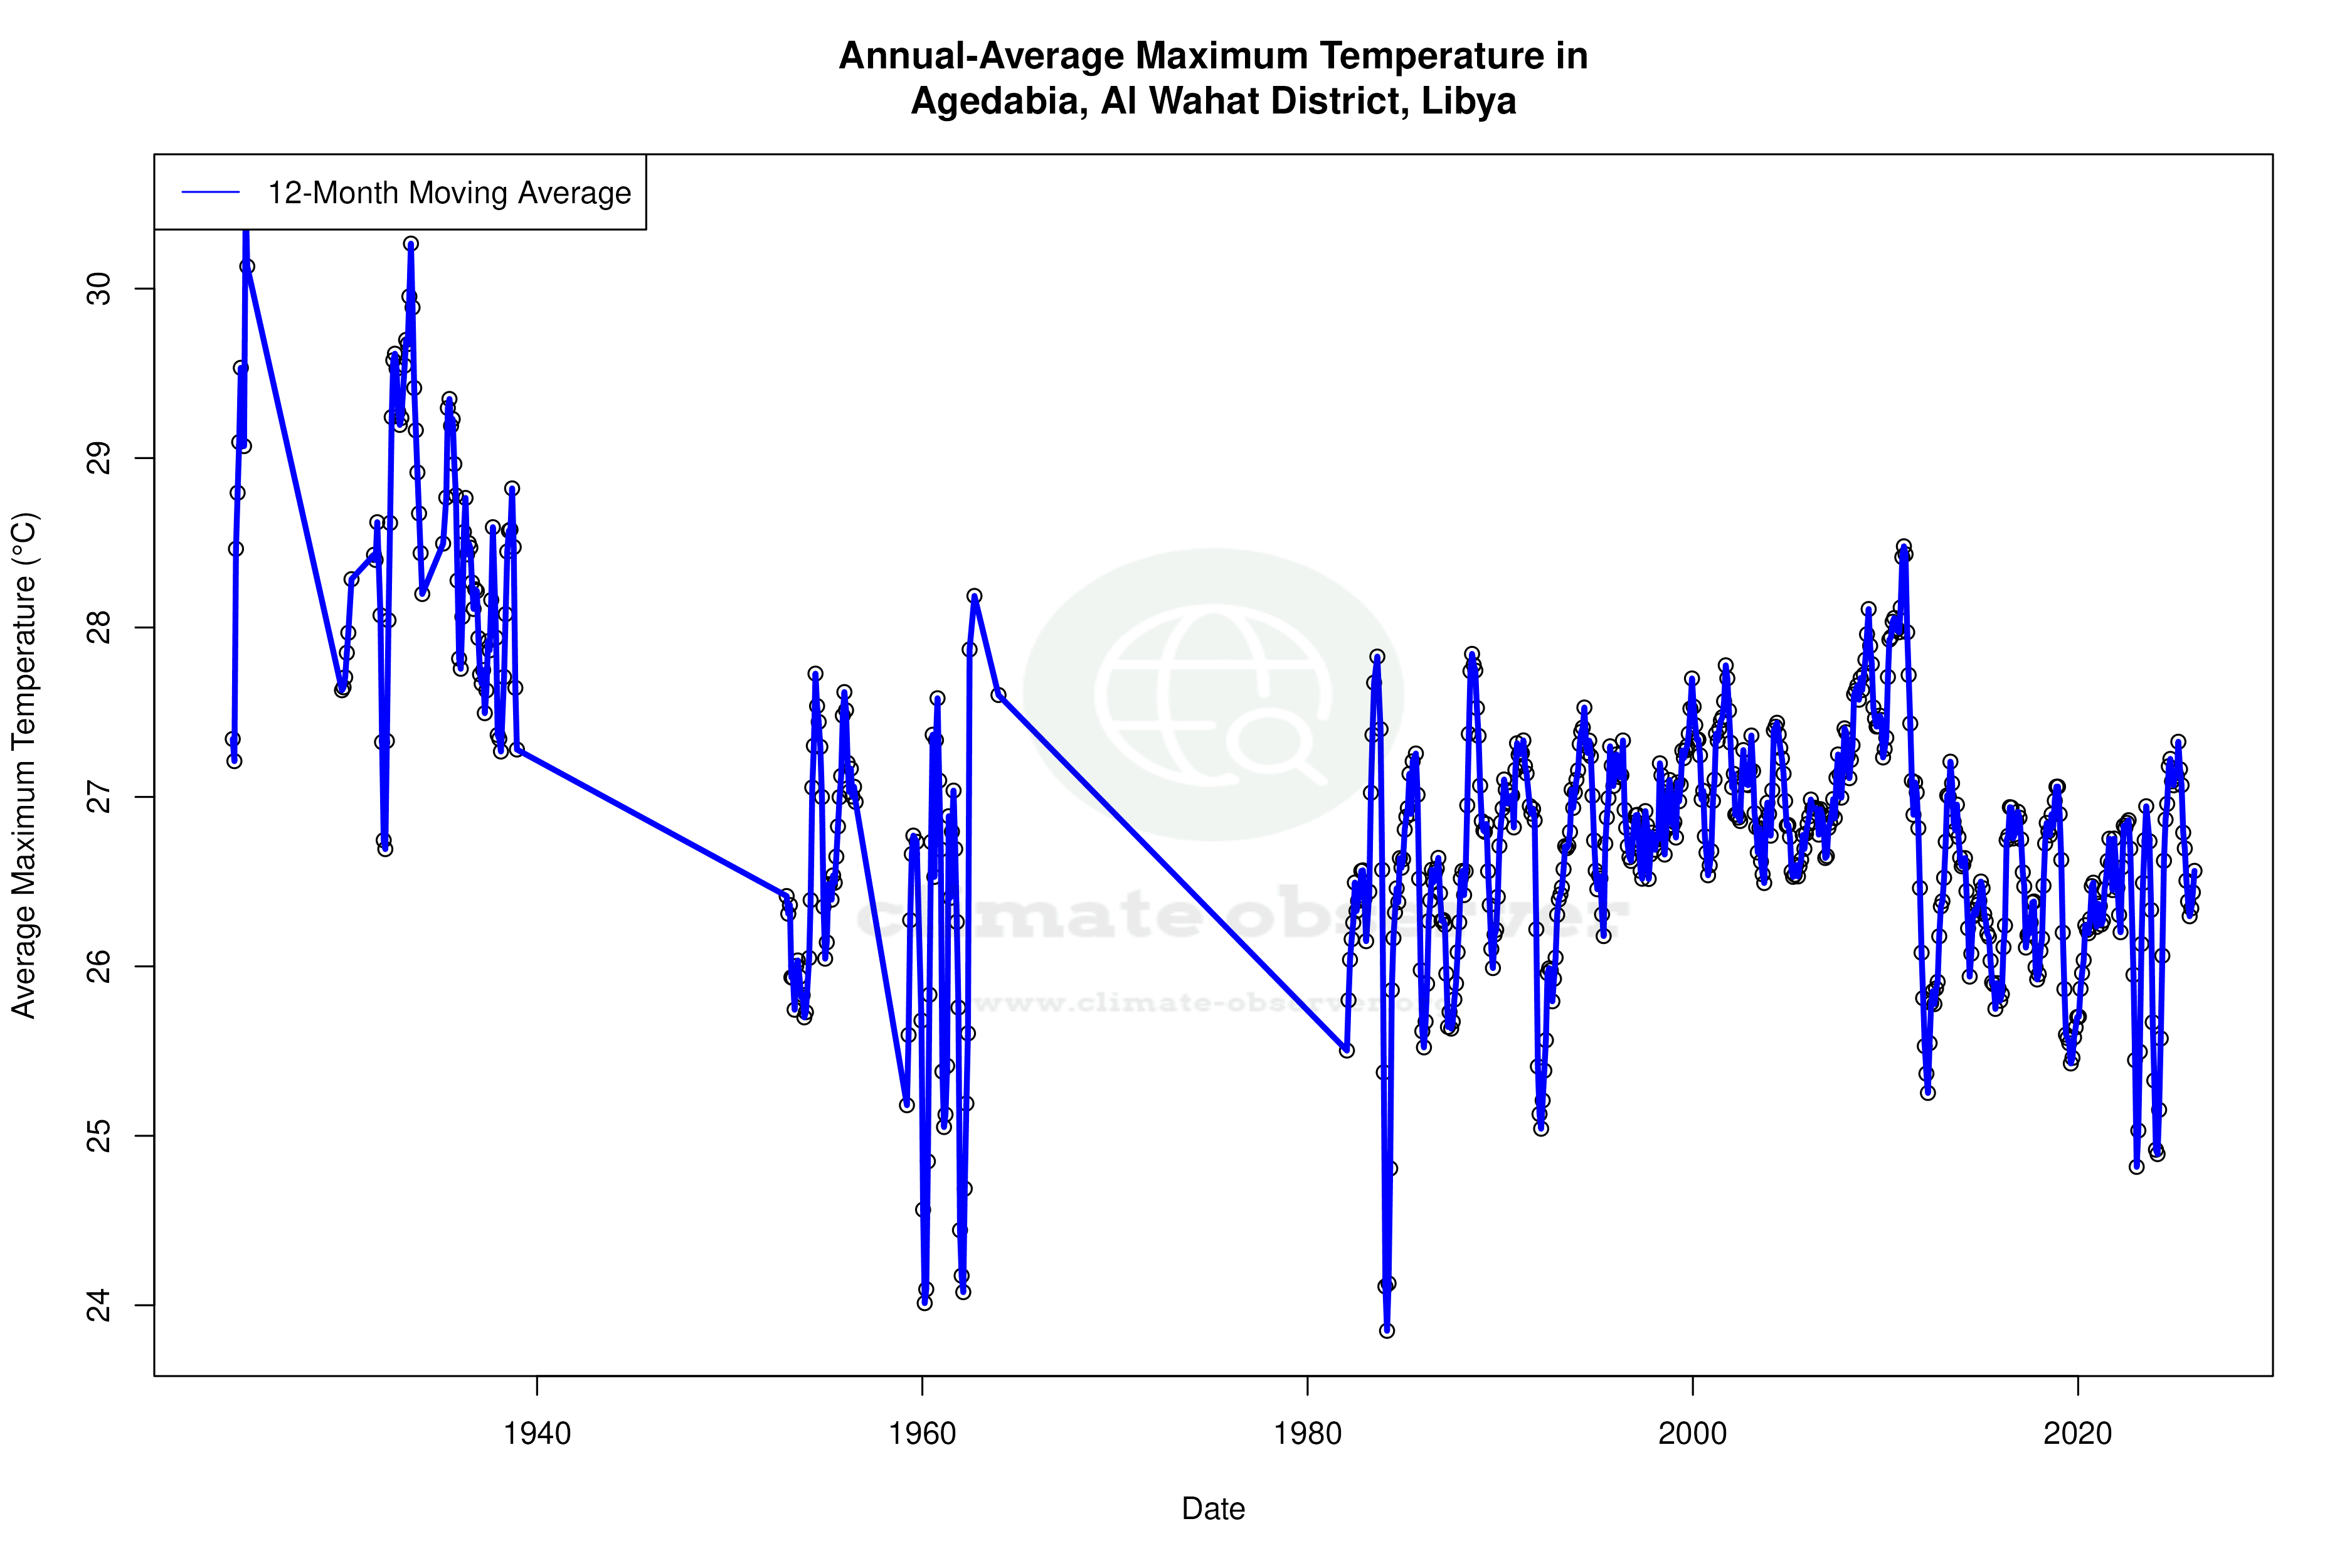
The long-term climate data reveals a dual narrative. High temperatures have shown a cooling trend, with a decrease of 0.12°C (0.22°F), while low temperatures have experienced a warming trend, rising by 0.34°C (0.61°F). This divergence suggests a narrowing of the diurnal temperature range over time. In contrast, the past decade shows a warming trend for both highs and lows, with increases of 0.11°C (0.20°F) and 0.17°C (0.31°F), respectively. This recent warming could be indicative of broader regional climate changes.
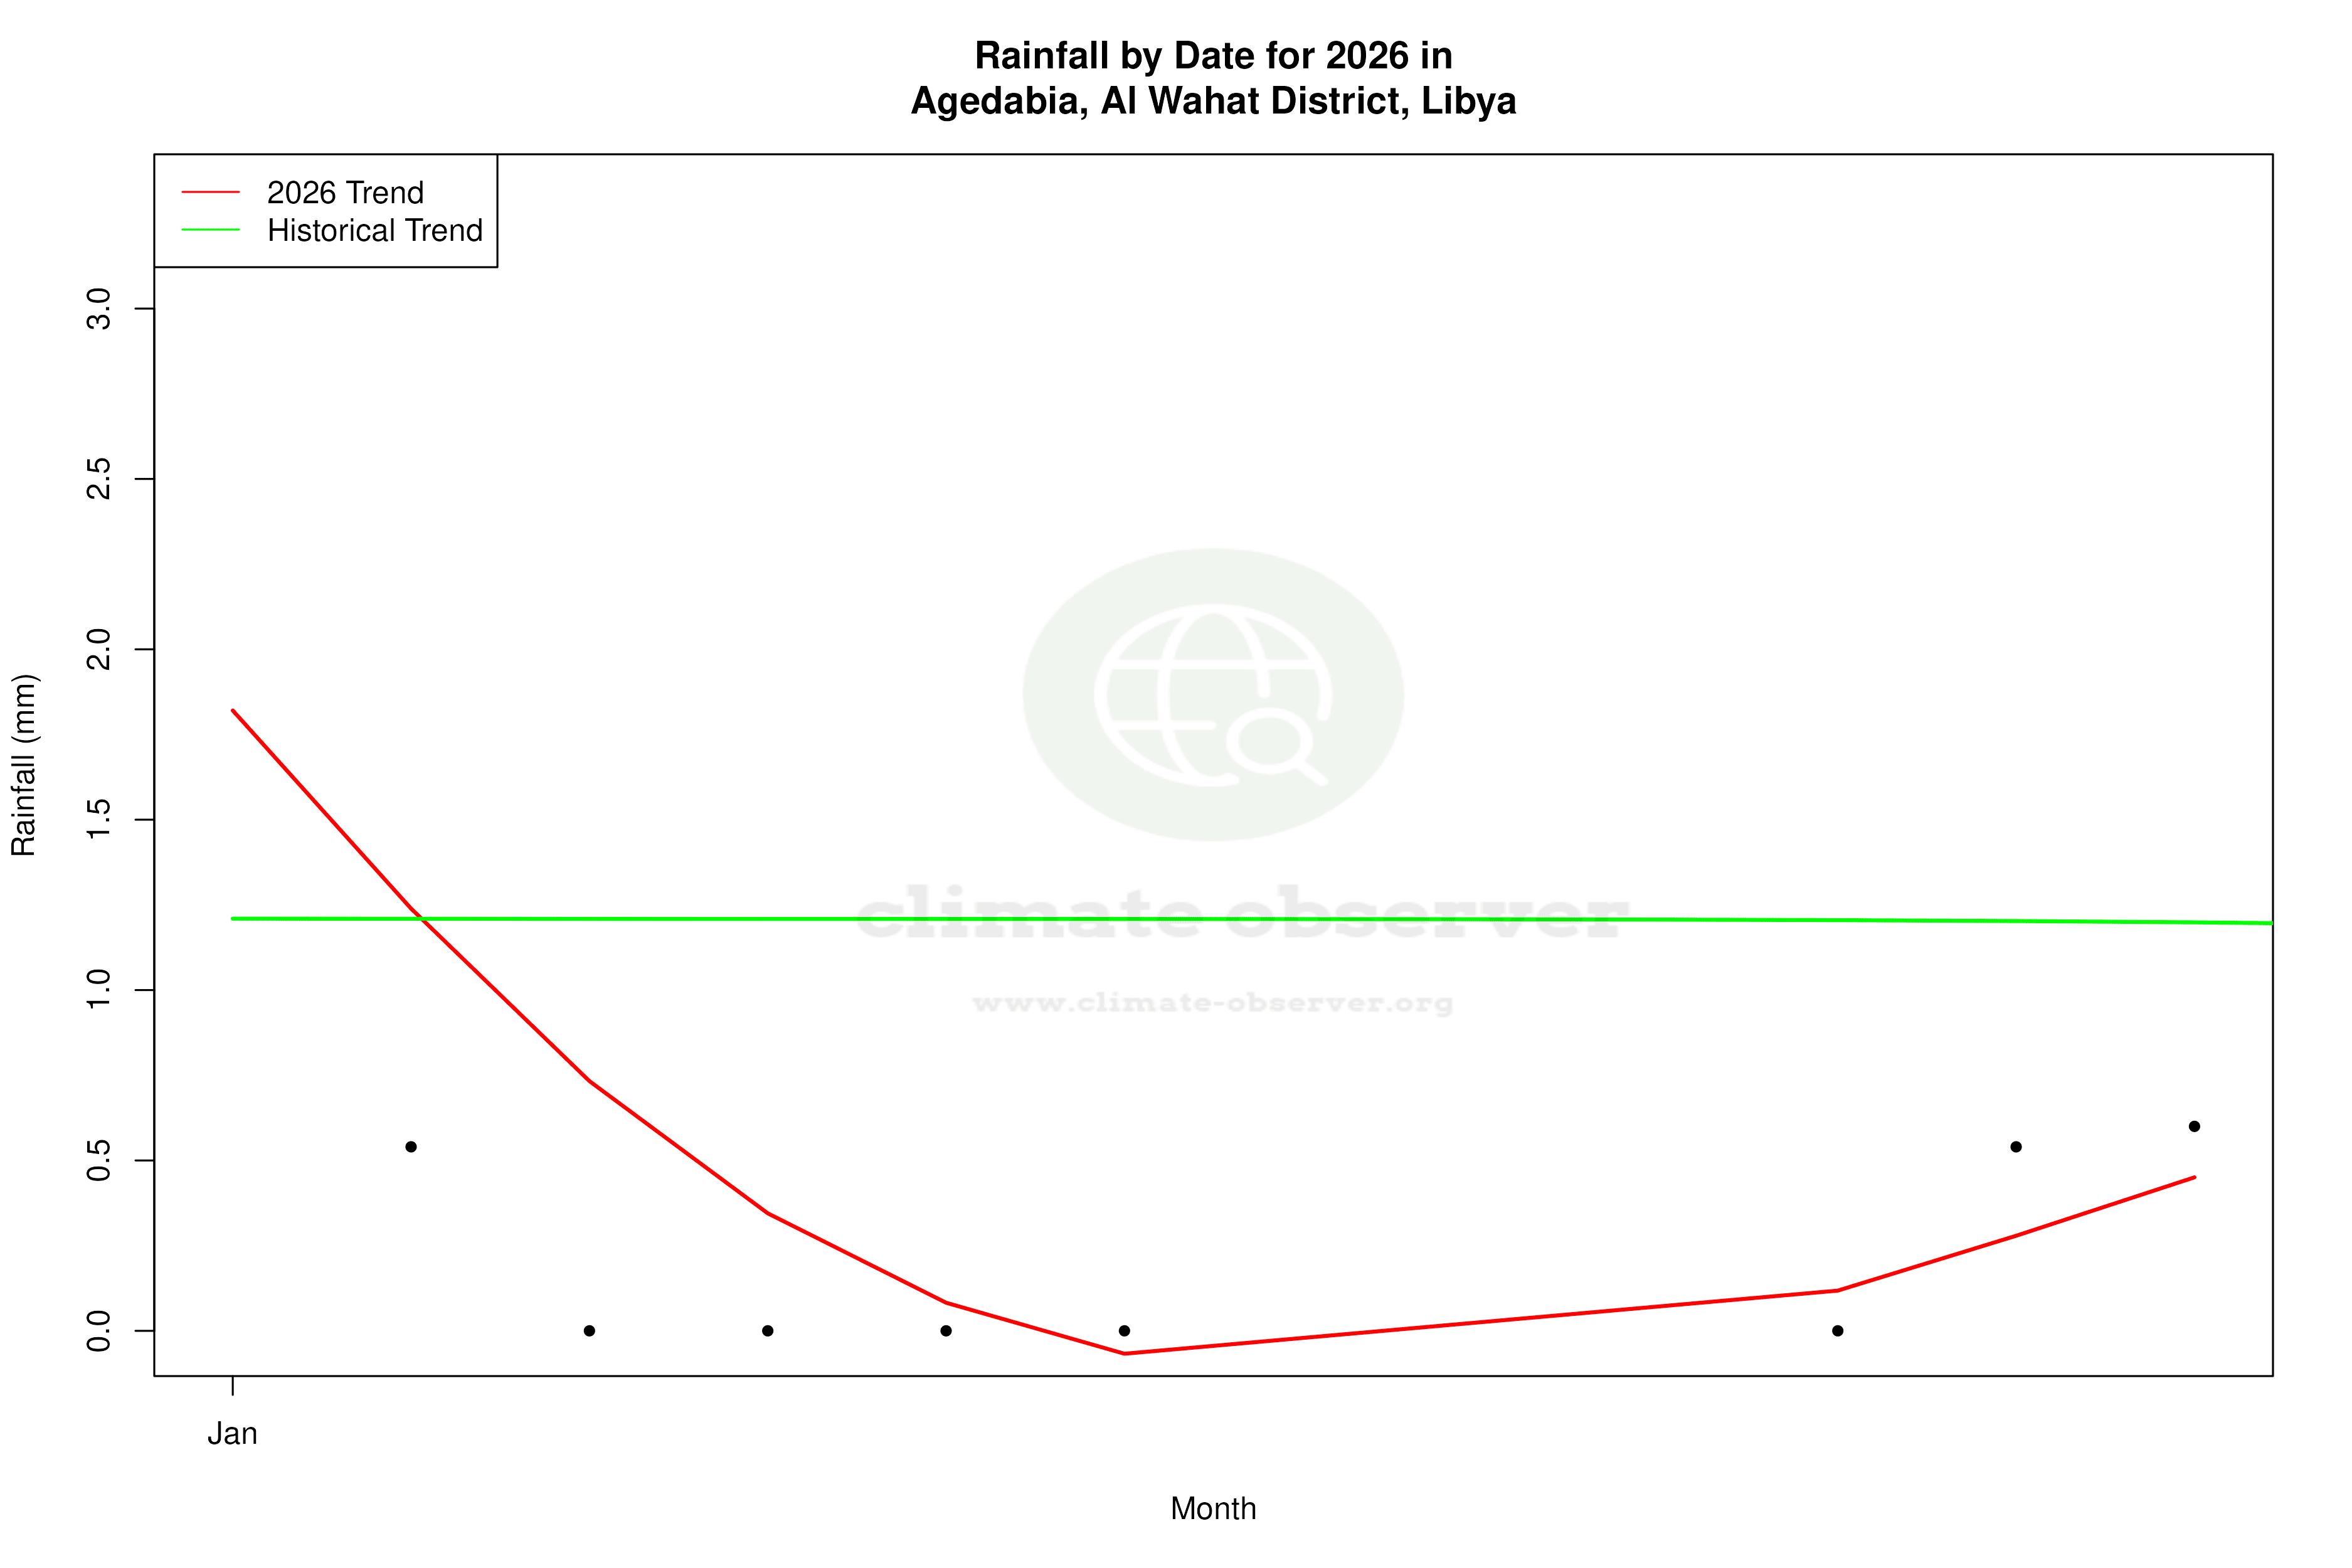
Precipitation Patterns: A Shift Towards Even Distribution
The Precipitation Concentration Index (PCI) for Agedabia has decreased from a baseline of 30.1 to a current value of 26.8. This indicates a more even distribution of rainfall events over time, moving away from highly concentrated precipitation. While still considered concentrated, this shift suggests a potential change in the frequency and intensity of rainfall events, which could have implications for water resource management in the region.
Record Extremes and Regional Implications
Agedabia's climate is marked by extreme temperatures, with historical records showing a maximum of 49.1°C (120.4°F) and a minimum of -0.1°C (31.8°F). These extremes highlight the harsh conditions typical of desert climates. The cooling trend in high temperatures may offer some relief from the intense heat, although the recent warming trend could counteract this effect.
Regional Climate Context
Libya's regional climate goals focus on adapting to and mitigating the impacts of climate change, particularly in its vulnerable desert regions. The observed trends in Agedabia provide valuable insights into the broader climatic shifts occurring in the area. Understanding these changes is crucial for developing strategies to address the challenges posed by climate variability, such as water scarcity and extreme weather events.
Station Statistics
10-Year Trend
High: +0.31 °F/decade
Low: +0.51 °F/decade
Rain: +0.018 in/decade
25-Year Trend
High: -0.77 °F/decade
Low: +0.66 °F/decade
Rain: +0.006 in/decade
50-Year Trend
High: -0.12 °F/decade
Low: +1.02 °F/decade
Rain: +0.002 in/decade
All-Time Trend
High: -0.21 °F/decade
Low: +0.61 °F/decade
Rain: +0.000 in/decade
Percentage Above-Average Days
Last 12 Months: 48.1%
This Year: 56.4%
Precipitation Concentration Index (PCI) ℹ️
Last 12 Months: 26.2
Historical Average: 30.5
Percentile Rank of Last 12 Months ℹ️
High: 35th percentile
Low: 90th percentile
Rain: 40th percentile
Change in Variance ℹ️
High: -5.0%
Low: -0.6%
Intraday: -33.0%
Data Coverage
67.1%
First Year of Data
1924
Station Location
Historical Weather Records
| Max High | Avg High | Min High | Max Avg | Avg Avg | Min Avg | Max Low | Avg Low | Min Low | Max Precipitation | Avg Precipitation | Max Snow | Avg Snow | |
|---|---|---|---|---|---|---|---|---|---|---|---|---|---|
| Record | 120.38 °F | — | 47.48 °F | 107.42 °F | — | 42.44 °F | 91.04 °F | — | 31.82 °F | 12.99 in | — | — | — |
| January | 84.92 °F | 64.47 °F | 51.80 °F | 68.36 °F | 55.65 °F | 43.70 °F | 62.60 °F | 46.91 °F | 32.00 °F | 1.46 in | 0.04 in | — | — |
| February | 95.00 °F | 66.61 °F | 47.48 °F | 78.80 °F | 56.97 °F | 42.44 °F | 70.70 °F | 47.56 °F | 32.00 °F | 3.30 in | 0.03 in | — | — |
| March | 102.02 °F | 72.30 °F | 53.60 °F | 87.62 °F | 61.14 °F | 47.66 °F | 77.00 °F | 50.60 °F | 31.82 °F | 1.27 in | 0.01 in | — | — |
| April | 116.96 °F | 79.68 °F | 60.80 °F | 89.60 °F | 67.62 °F | 53.24 °F | 79.88 °F | 55.96 °F | 32.00 °F | 0.38 in | 0.00 in | — | — |
| May | 114.80 °F | 86.80 °F | 66.02 °F | 99.68 °F | 74.30 °F | 55.76 °F | 91.04 °F | 62.35 °F | 44.60 °F | 4.88 in | 0.01 in | — | — |
| June | 120.20 °F | 92.10 °F | 73.04 °F | 107.42 °F | 79.67 °F | 63.86 °F | 88.70 °F | 67.17 °F | 48.92 °F | 0.20 in | 0.00 in | — | — |
| July | 120.38 °F | 91.68 °F | 78.98 °F | 96.98 °F | 80.74 °F | 70.88 °F | 89.96 °F | 69.17 °F | 49.64 °F | 0.18 in | 0.00 in | — | — |
| August | 114.08 °F | 92.68 °F | 82.04 °F | 98.19 °F | 81.73 °F | 69.26 °F | 86.90 °F | 70.12 °F | 50.00 °F | 0.07 in | 0.00 in | — | — |
| September | 113.36 °F | 91.02 °F | 77.00 °F | 97.52 °F | 79.70 °F | 67.46 °F | 87.80 °F | 68.07 °F | 48.20 °F | 0.50 in | 0.00 in | — | — |
| October | 118.76 °F | 84.96 °F | 67.10 °F | 91.71 °F | 73.98 °F | 60.98 °F | 80.96 °F | 63.11 °F | 37.40 °F | 2.53 in | 0.01 in | — | — |
| November | 106.88 °F | 76.22 °F | 59.25 °F | 82.76 °F | 65.53 °F | 52.52 °F | 81.50 °F | 56.01 °F | 32.00 °F | 1.68 in | 0.02 in | — | — |
| December | 87.98 °F | 67.36 °F | 53.24 °F | 76.28 °F | 58.26 °F | 47.30 °F | 67.82 °F | 49.72 °F | 32.00 °F | 12.99 in | 0.06 in | — | — |
Data Visualisations
Remove WatermarksCurrent Year Climate Trends vs Historical


Max Temperature this Year | 1 of 6
Climate 12-Month Moving Averages
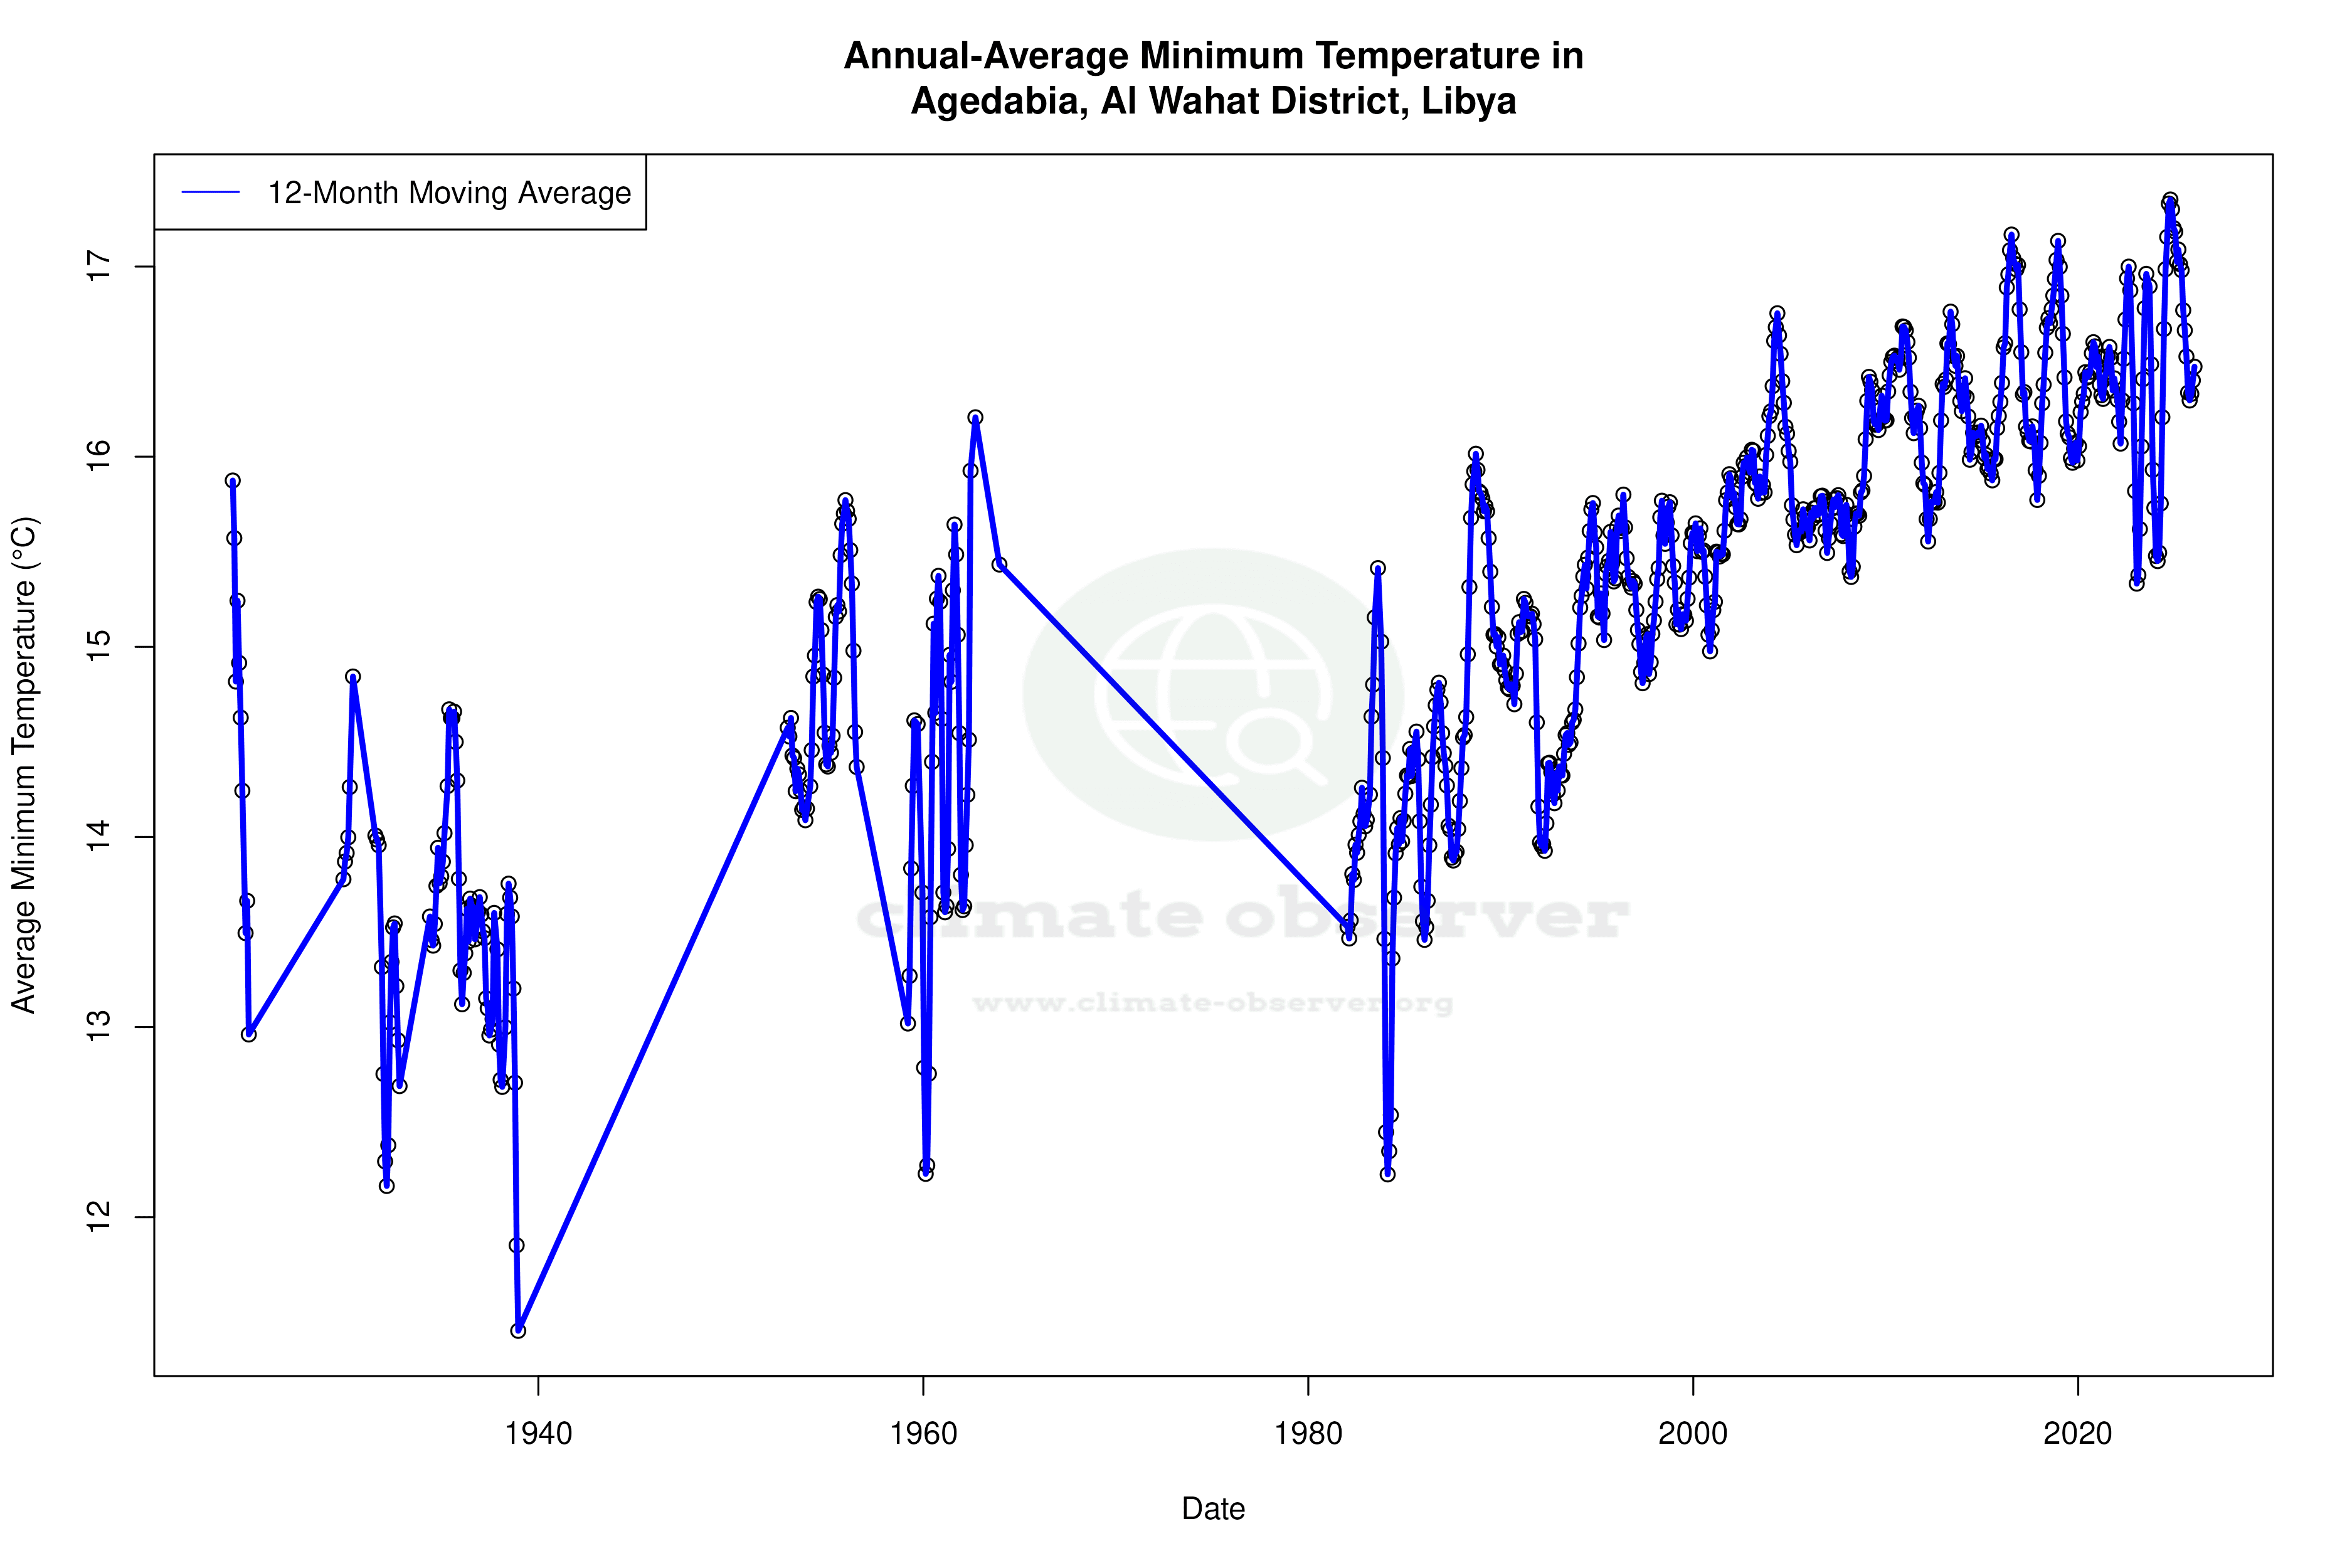
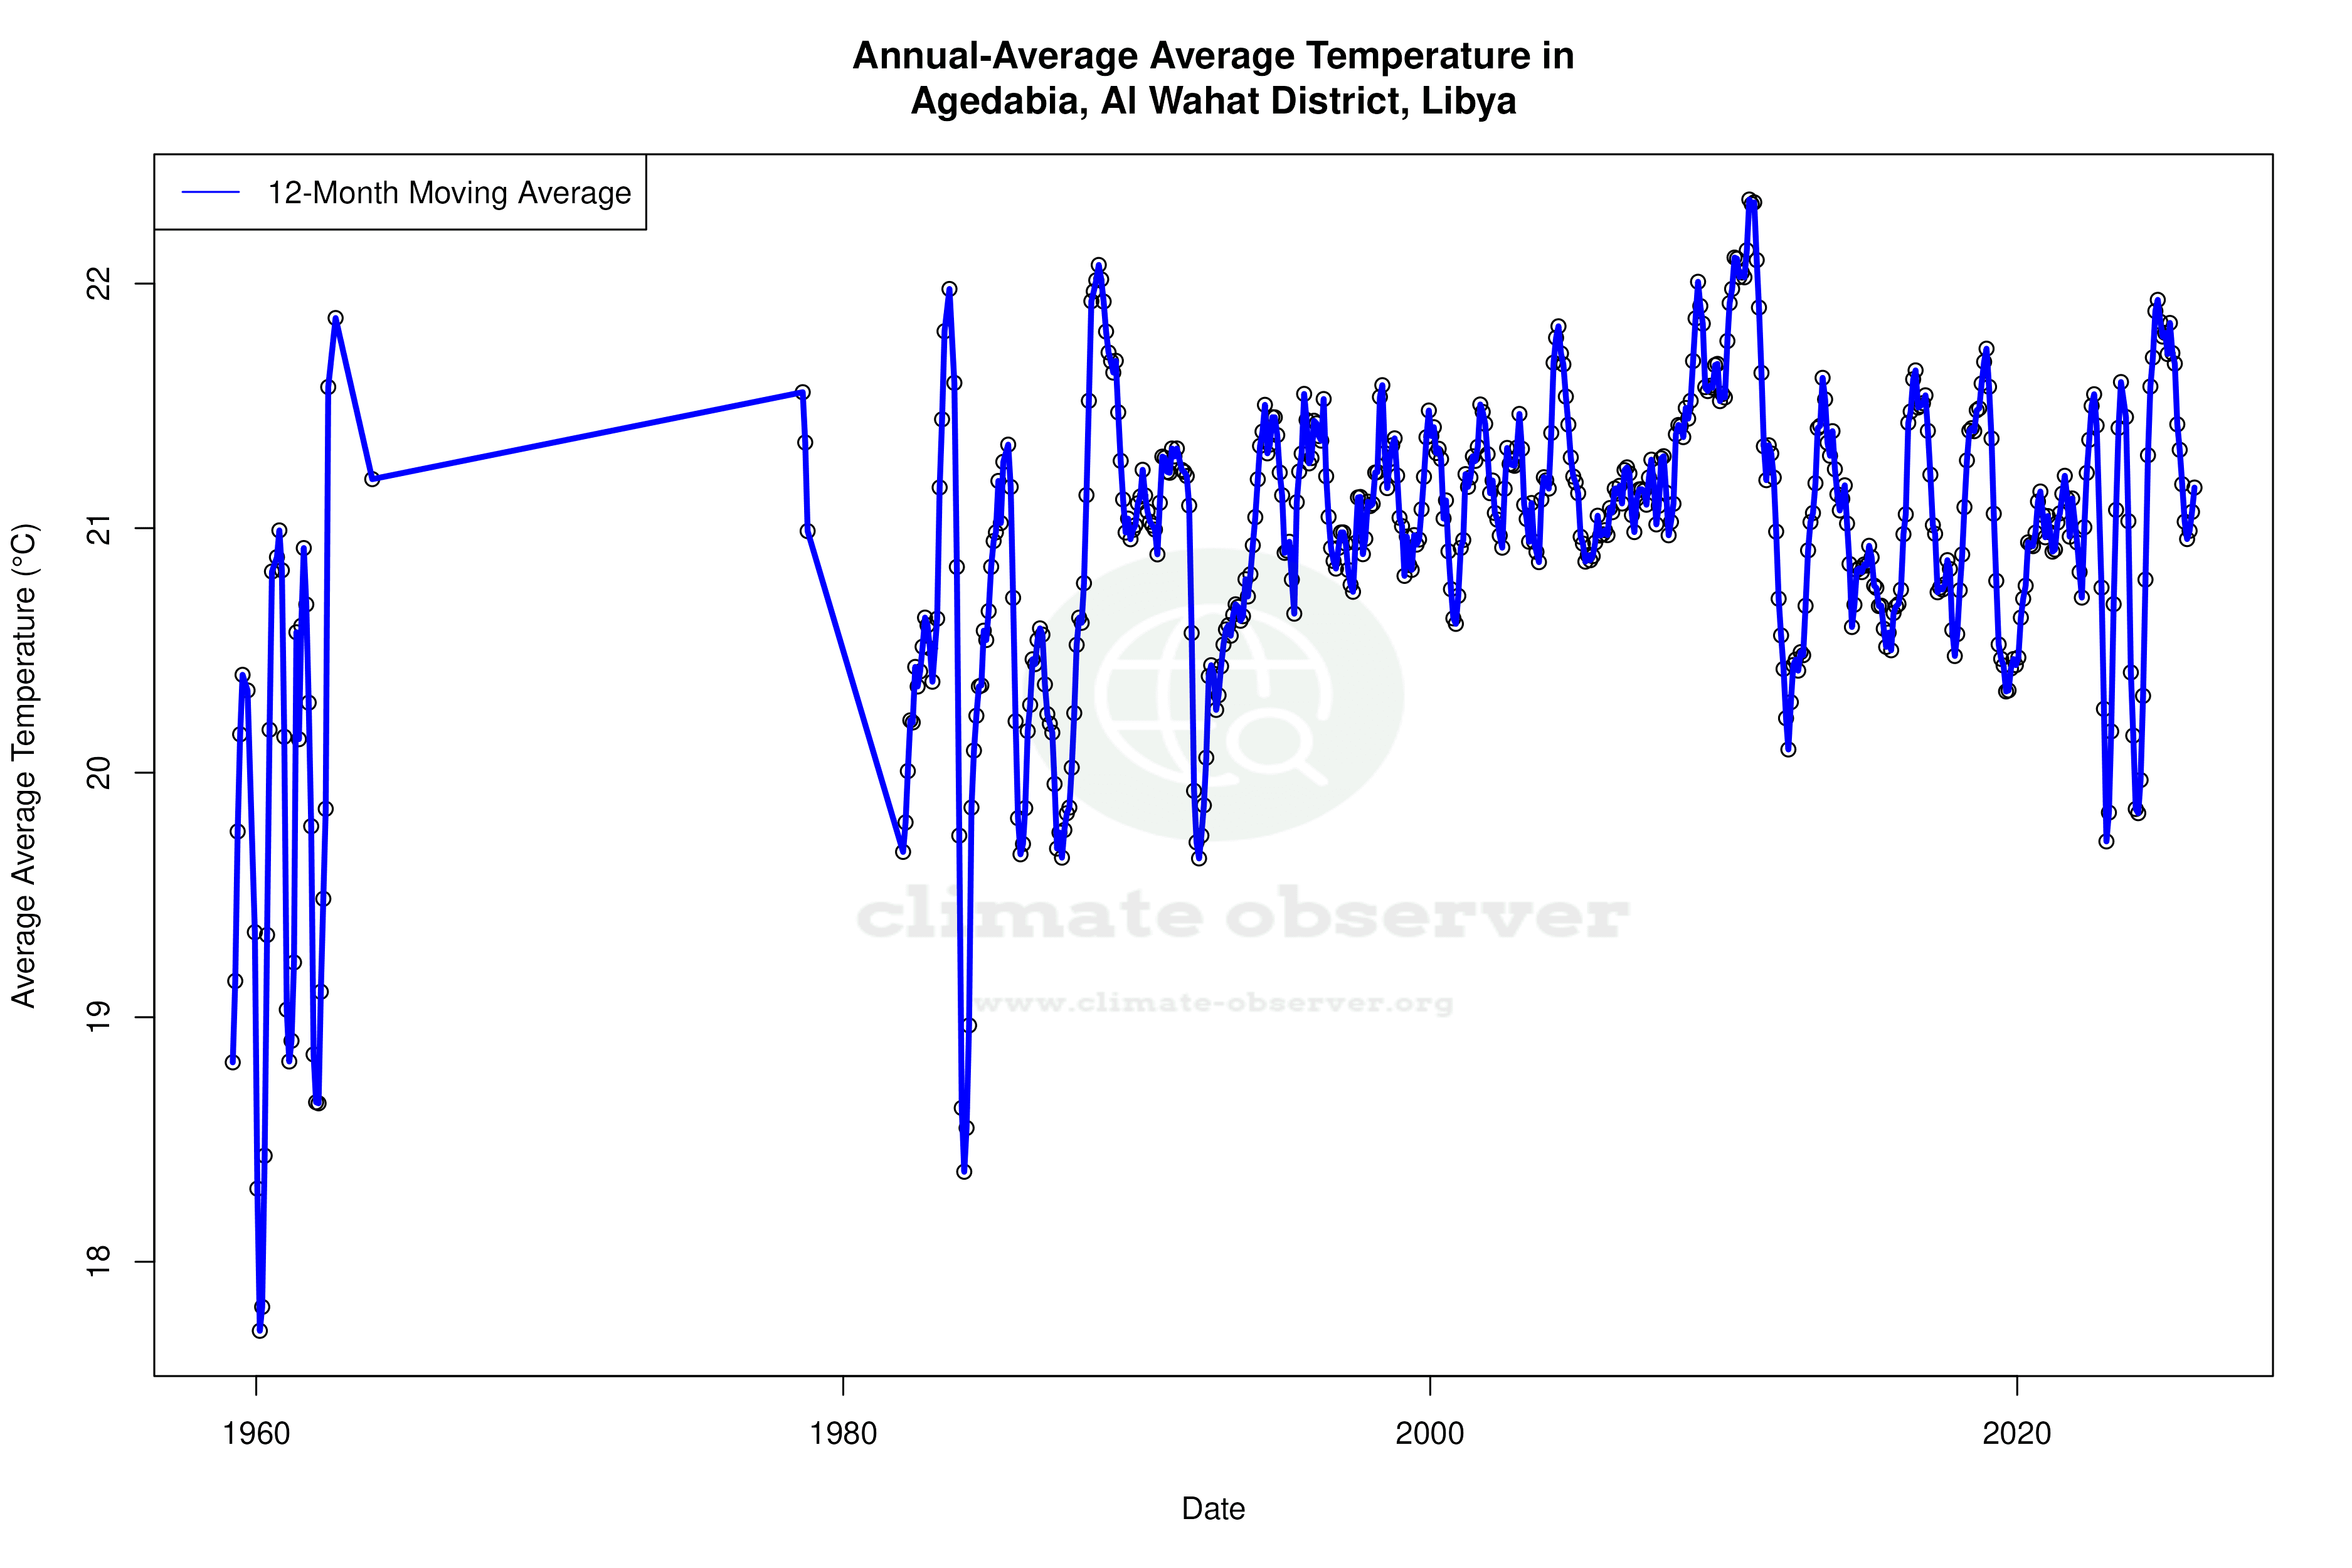


Max Temperature 12-Month MA | 1 of 6
Daily Data Points and Averages Throughout the Year

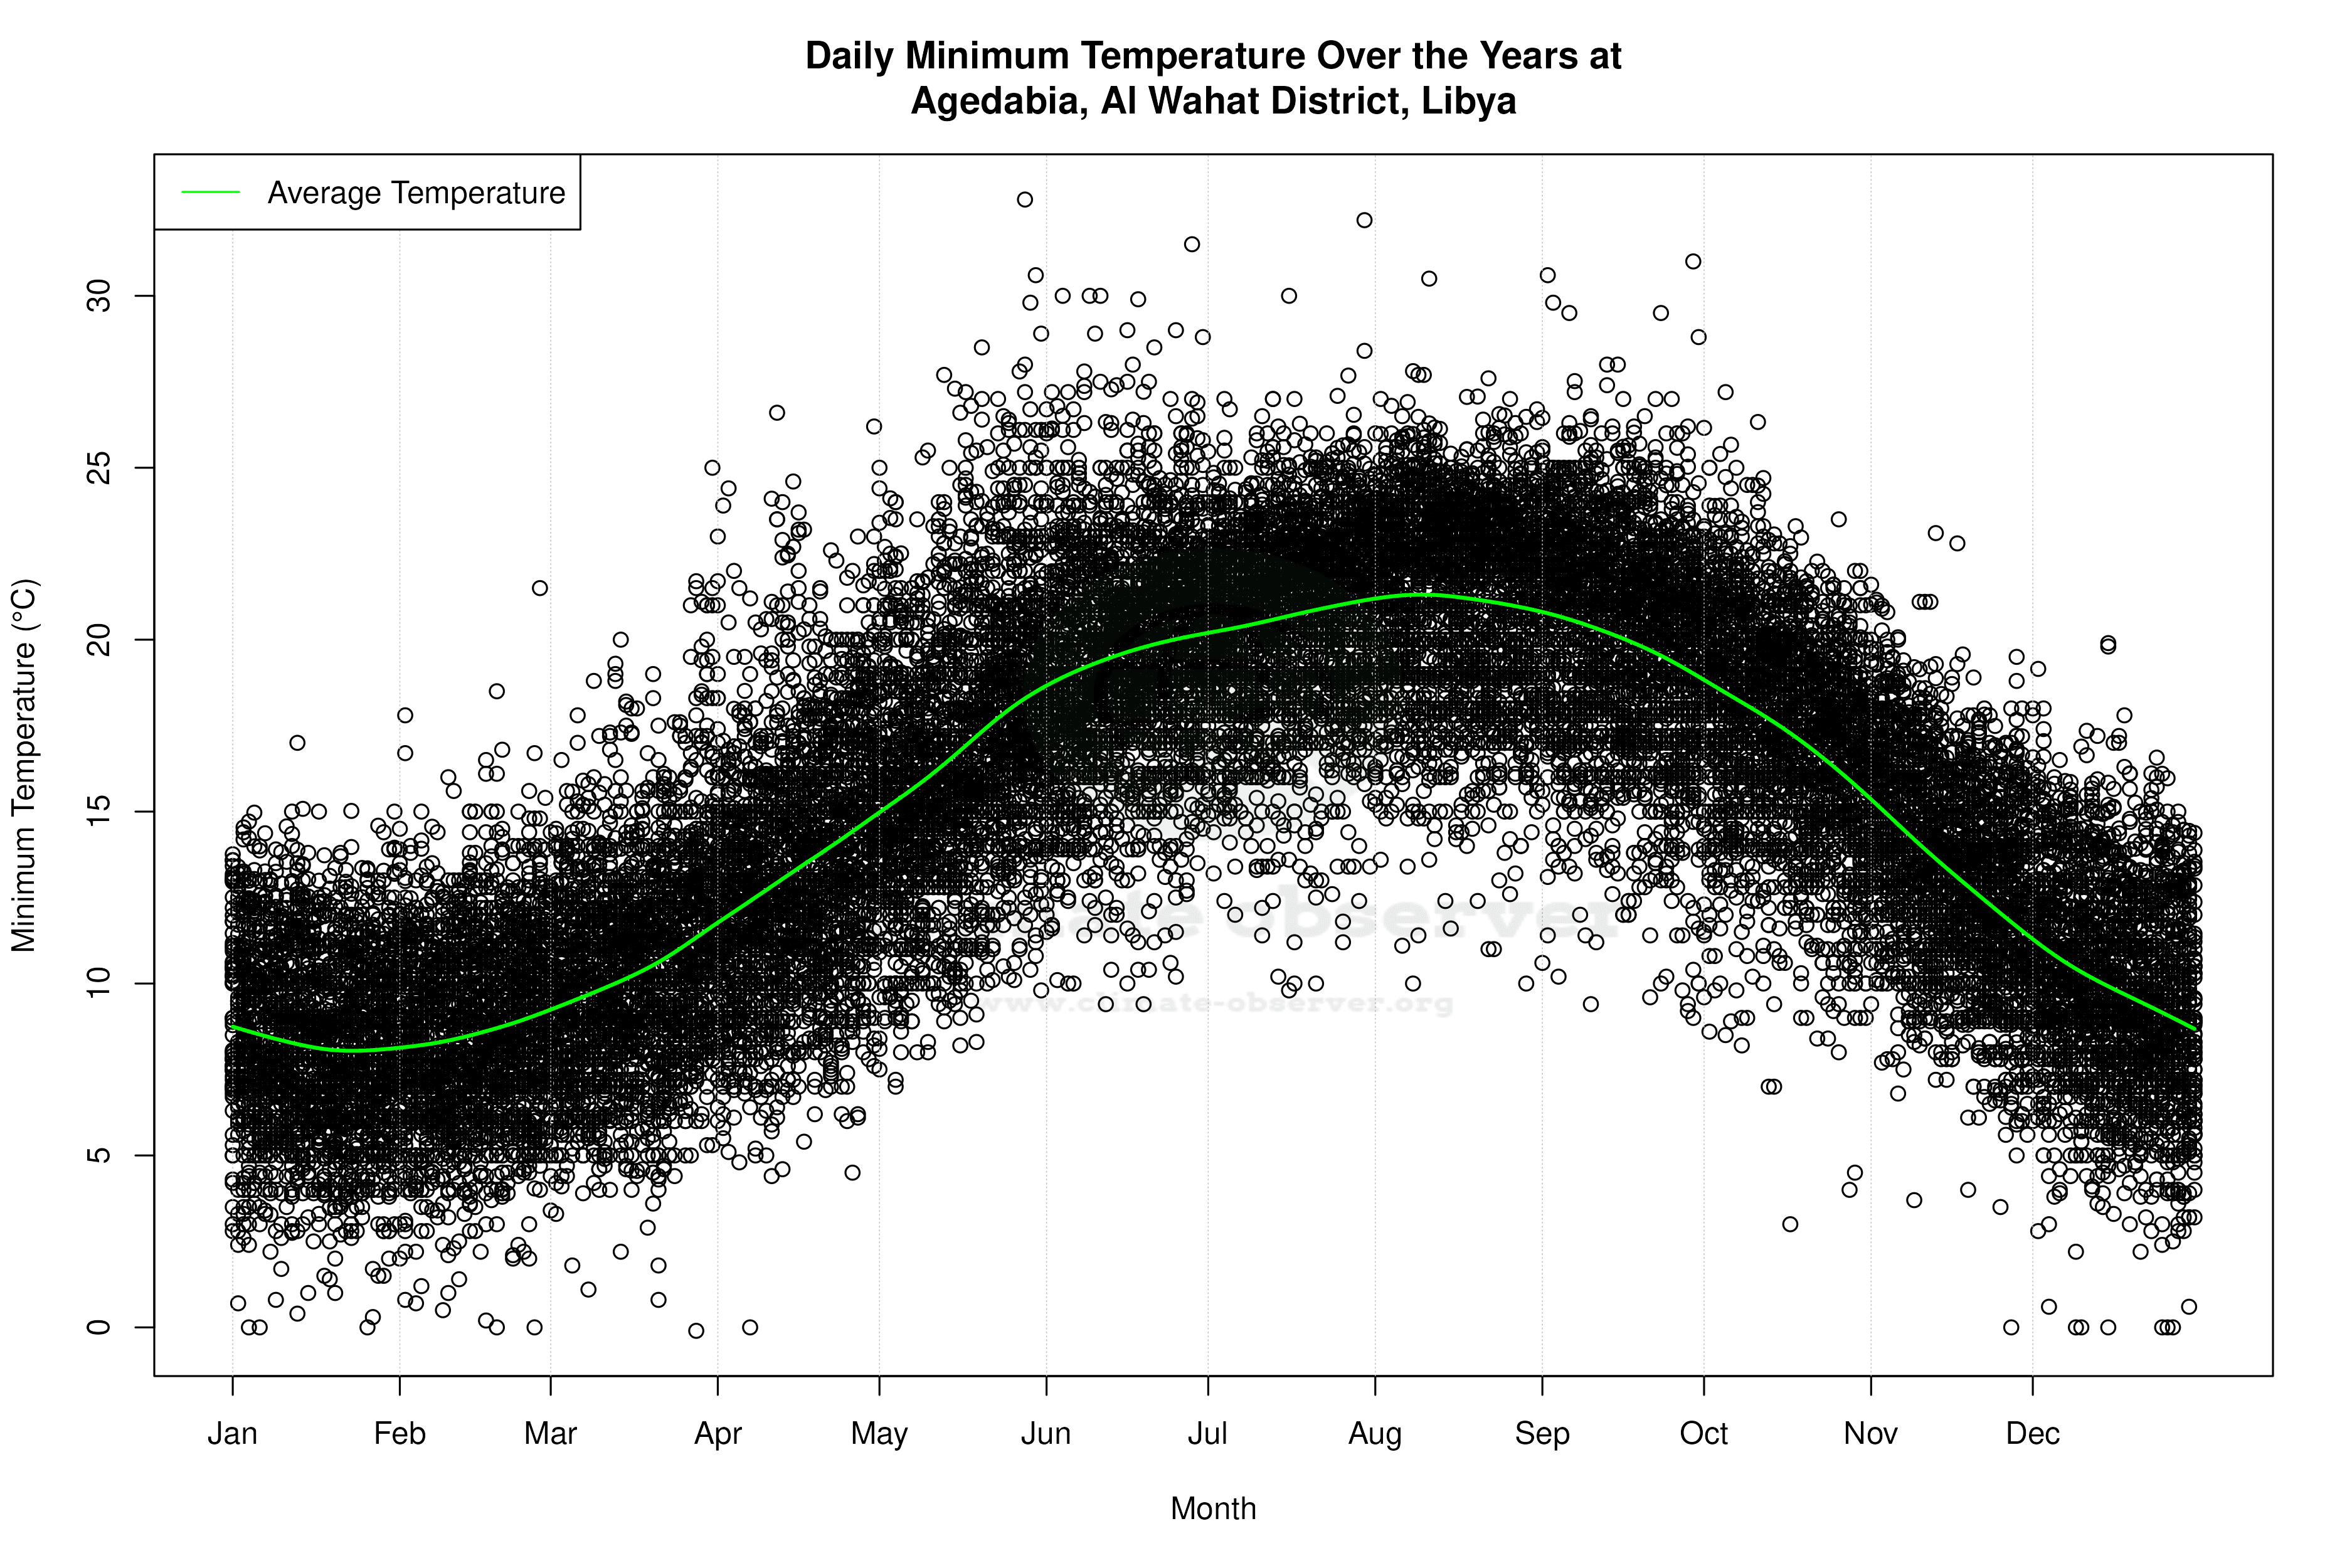
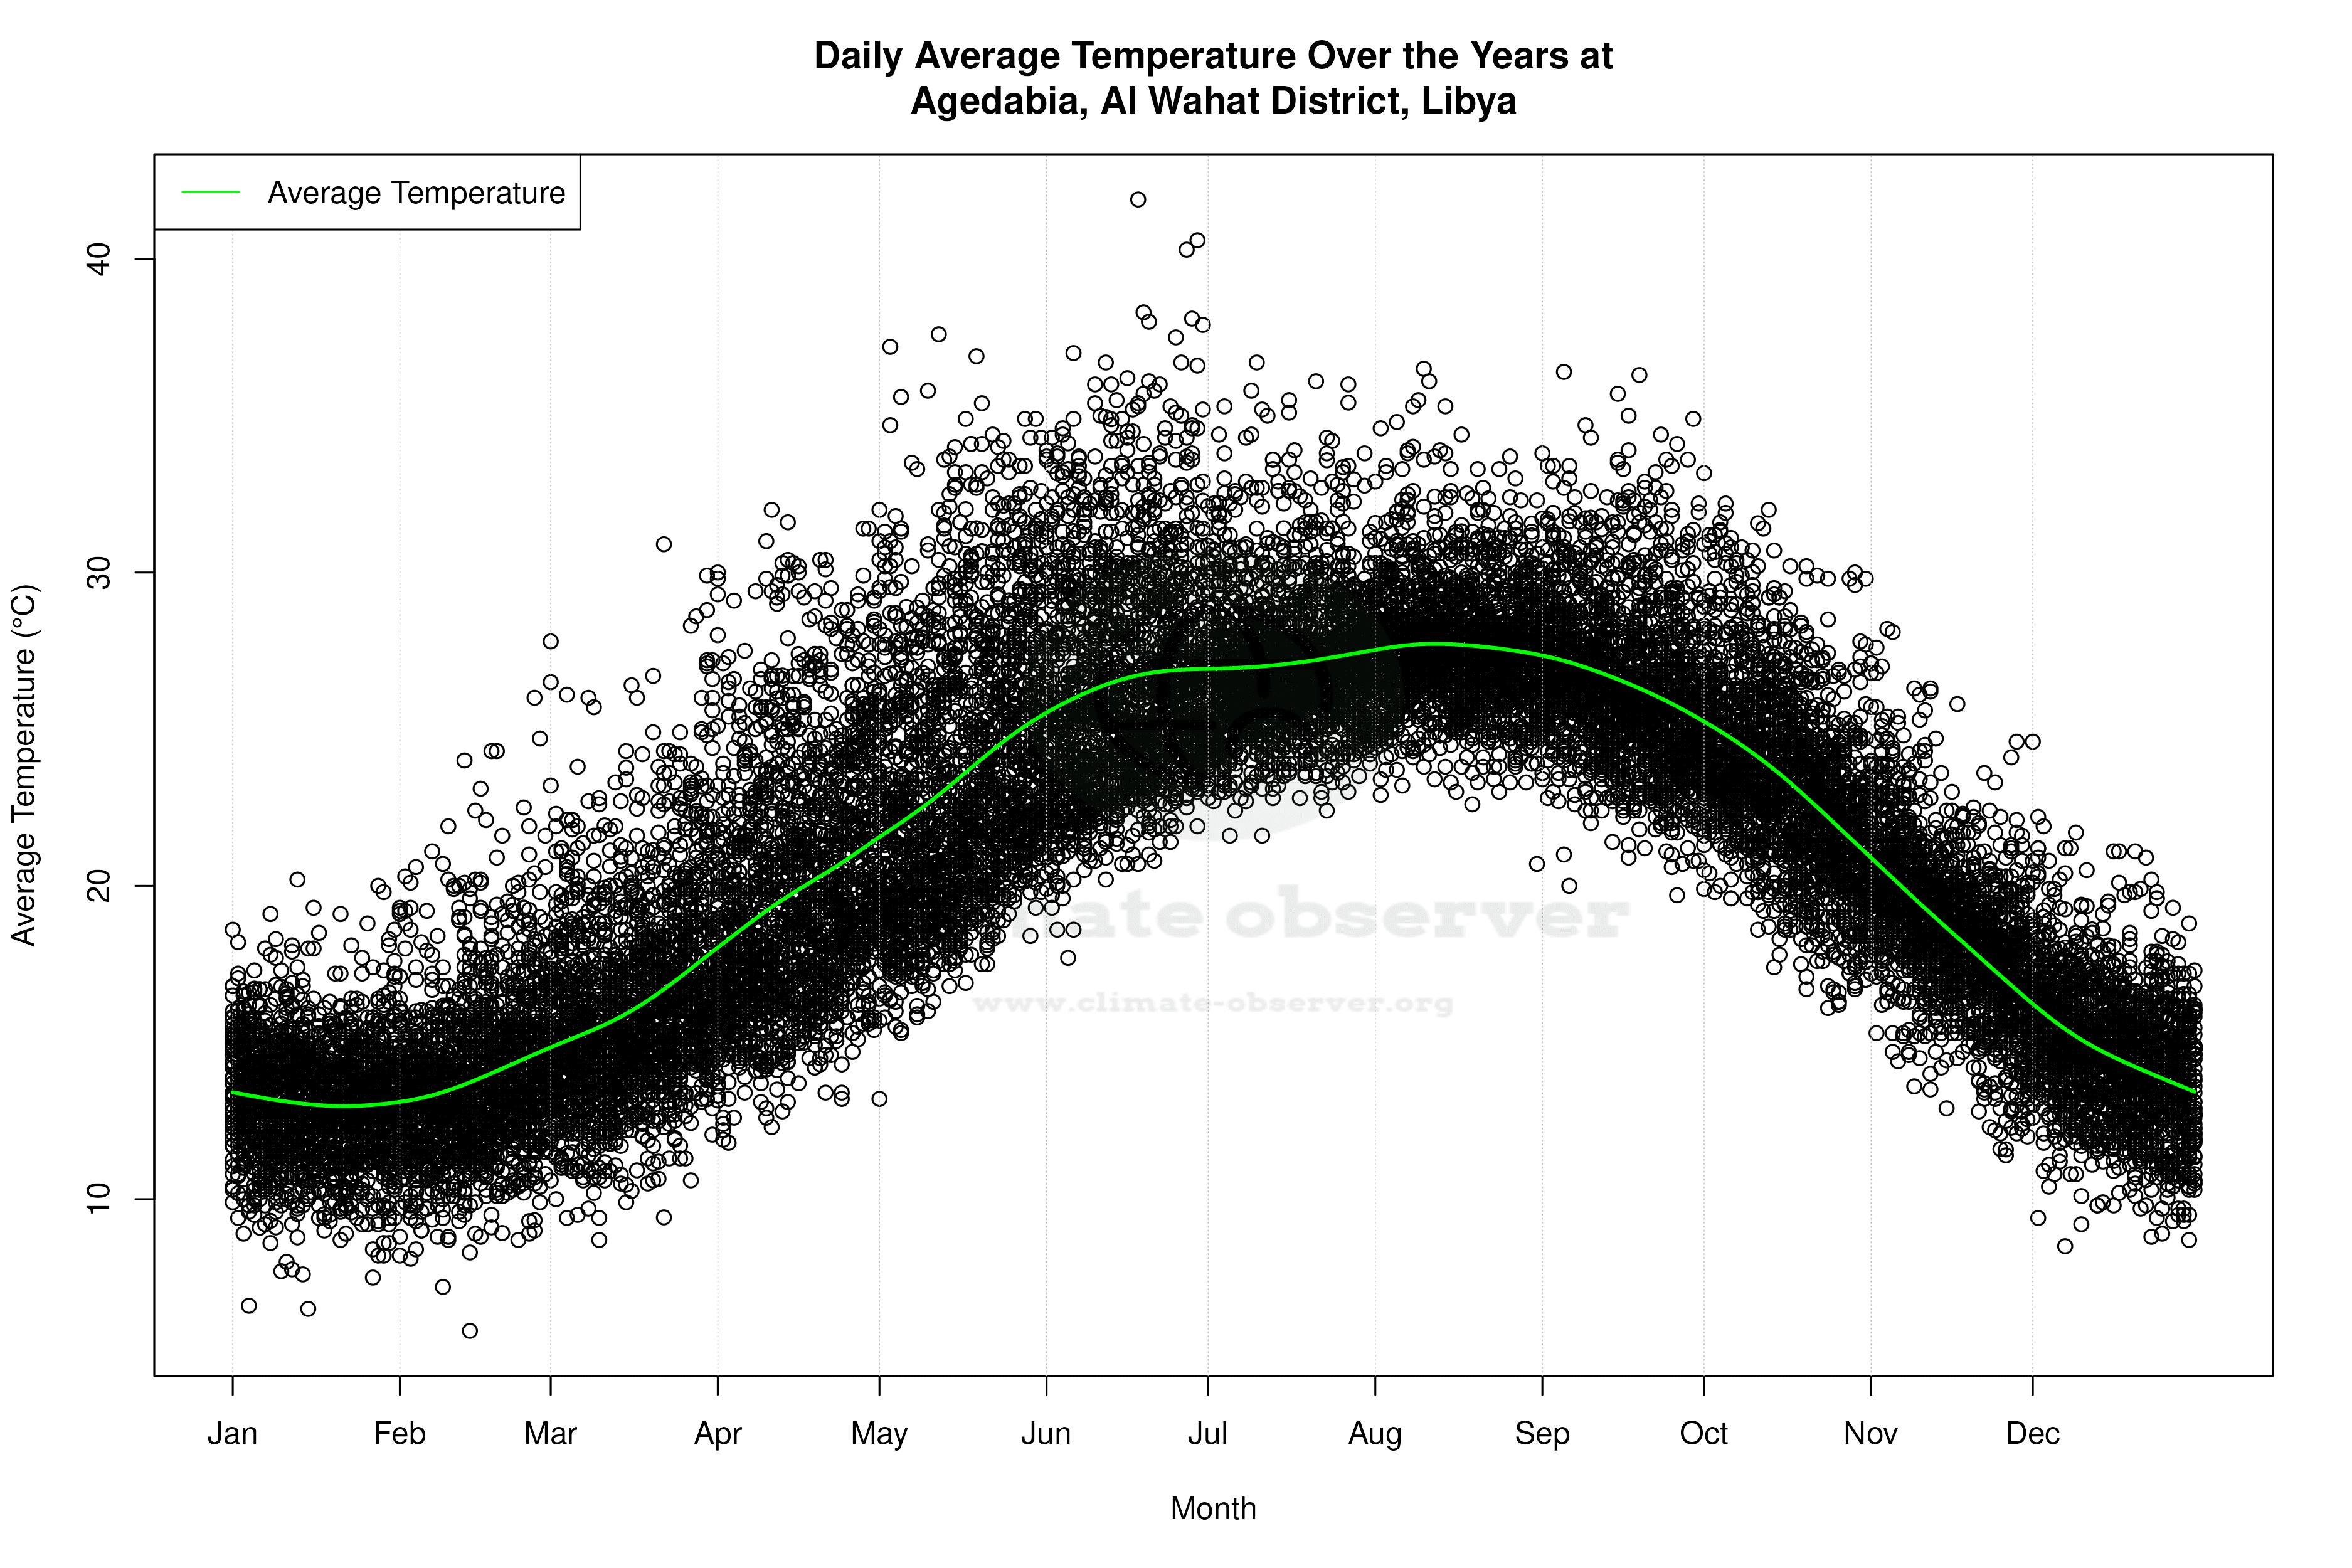
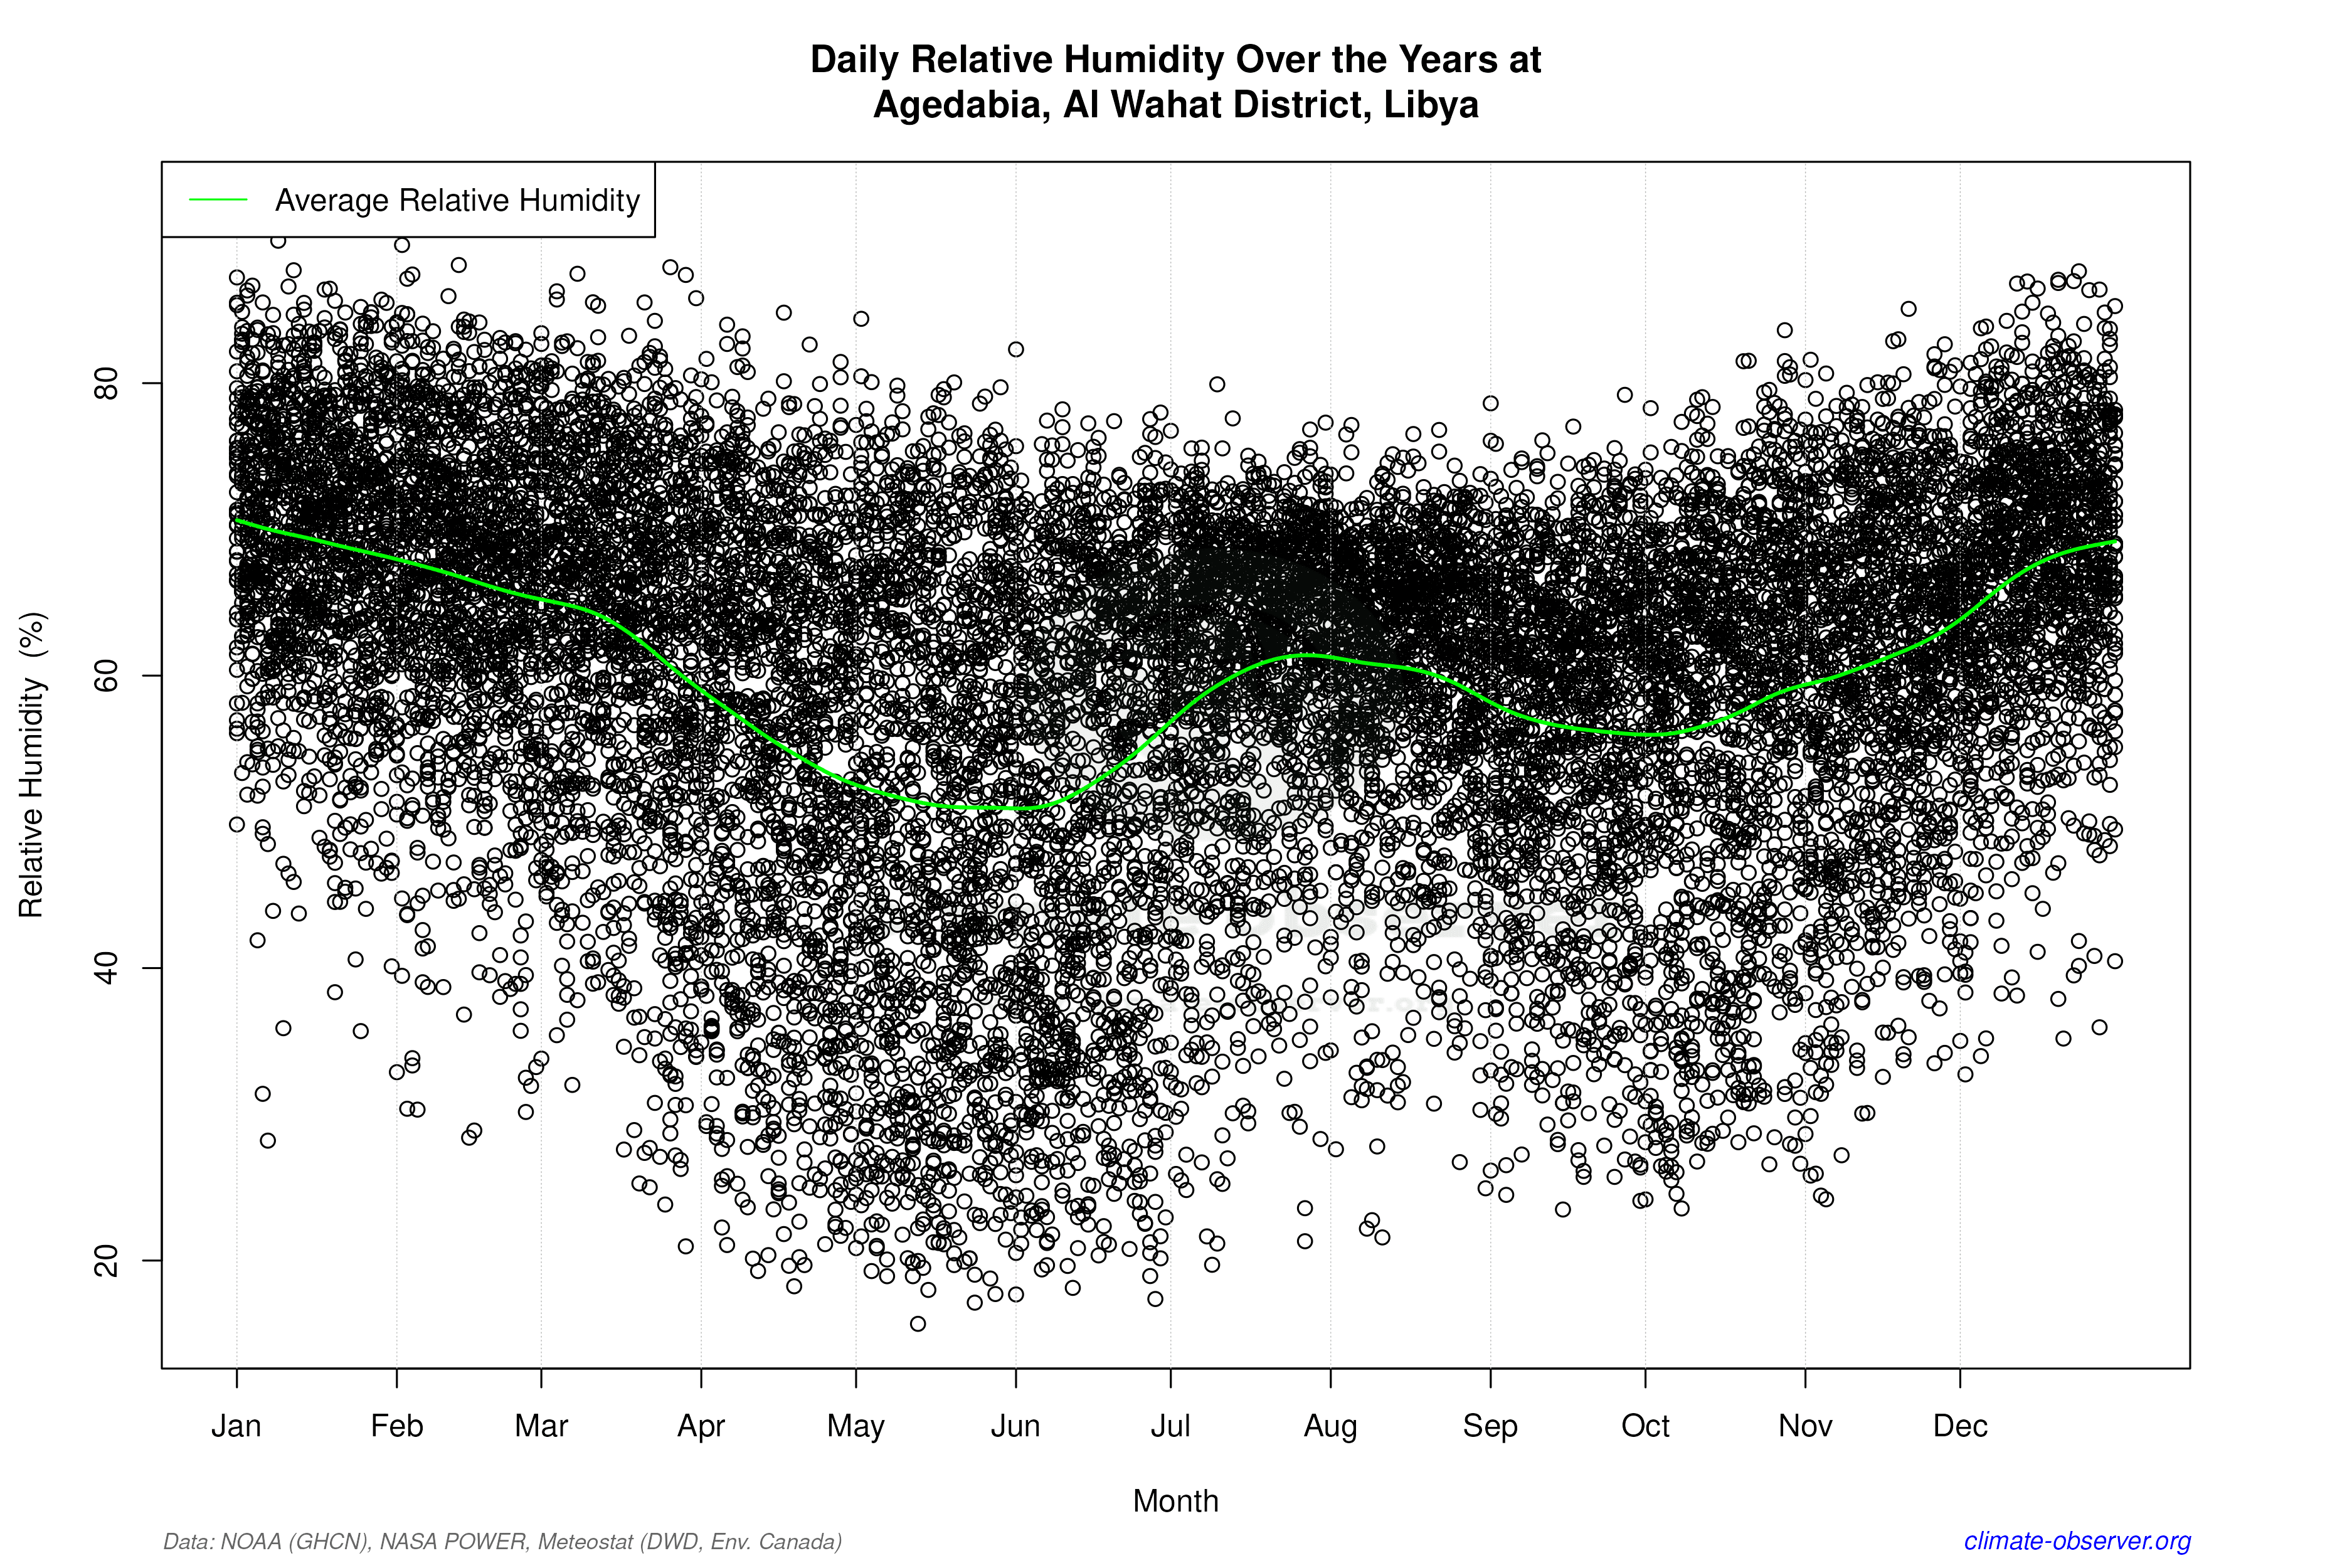

Average Max Temperature Throughout Year | 1 of 5
