Climate for Station: Yefren, Al Jabal al Gharbi District, Libya
Loading live weather...
Climate Analysis & Overview
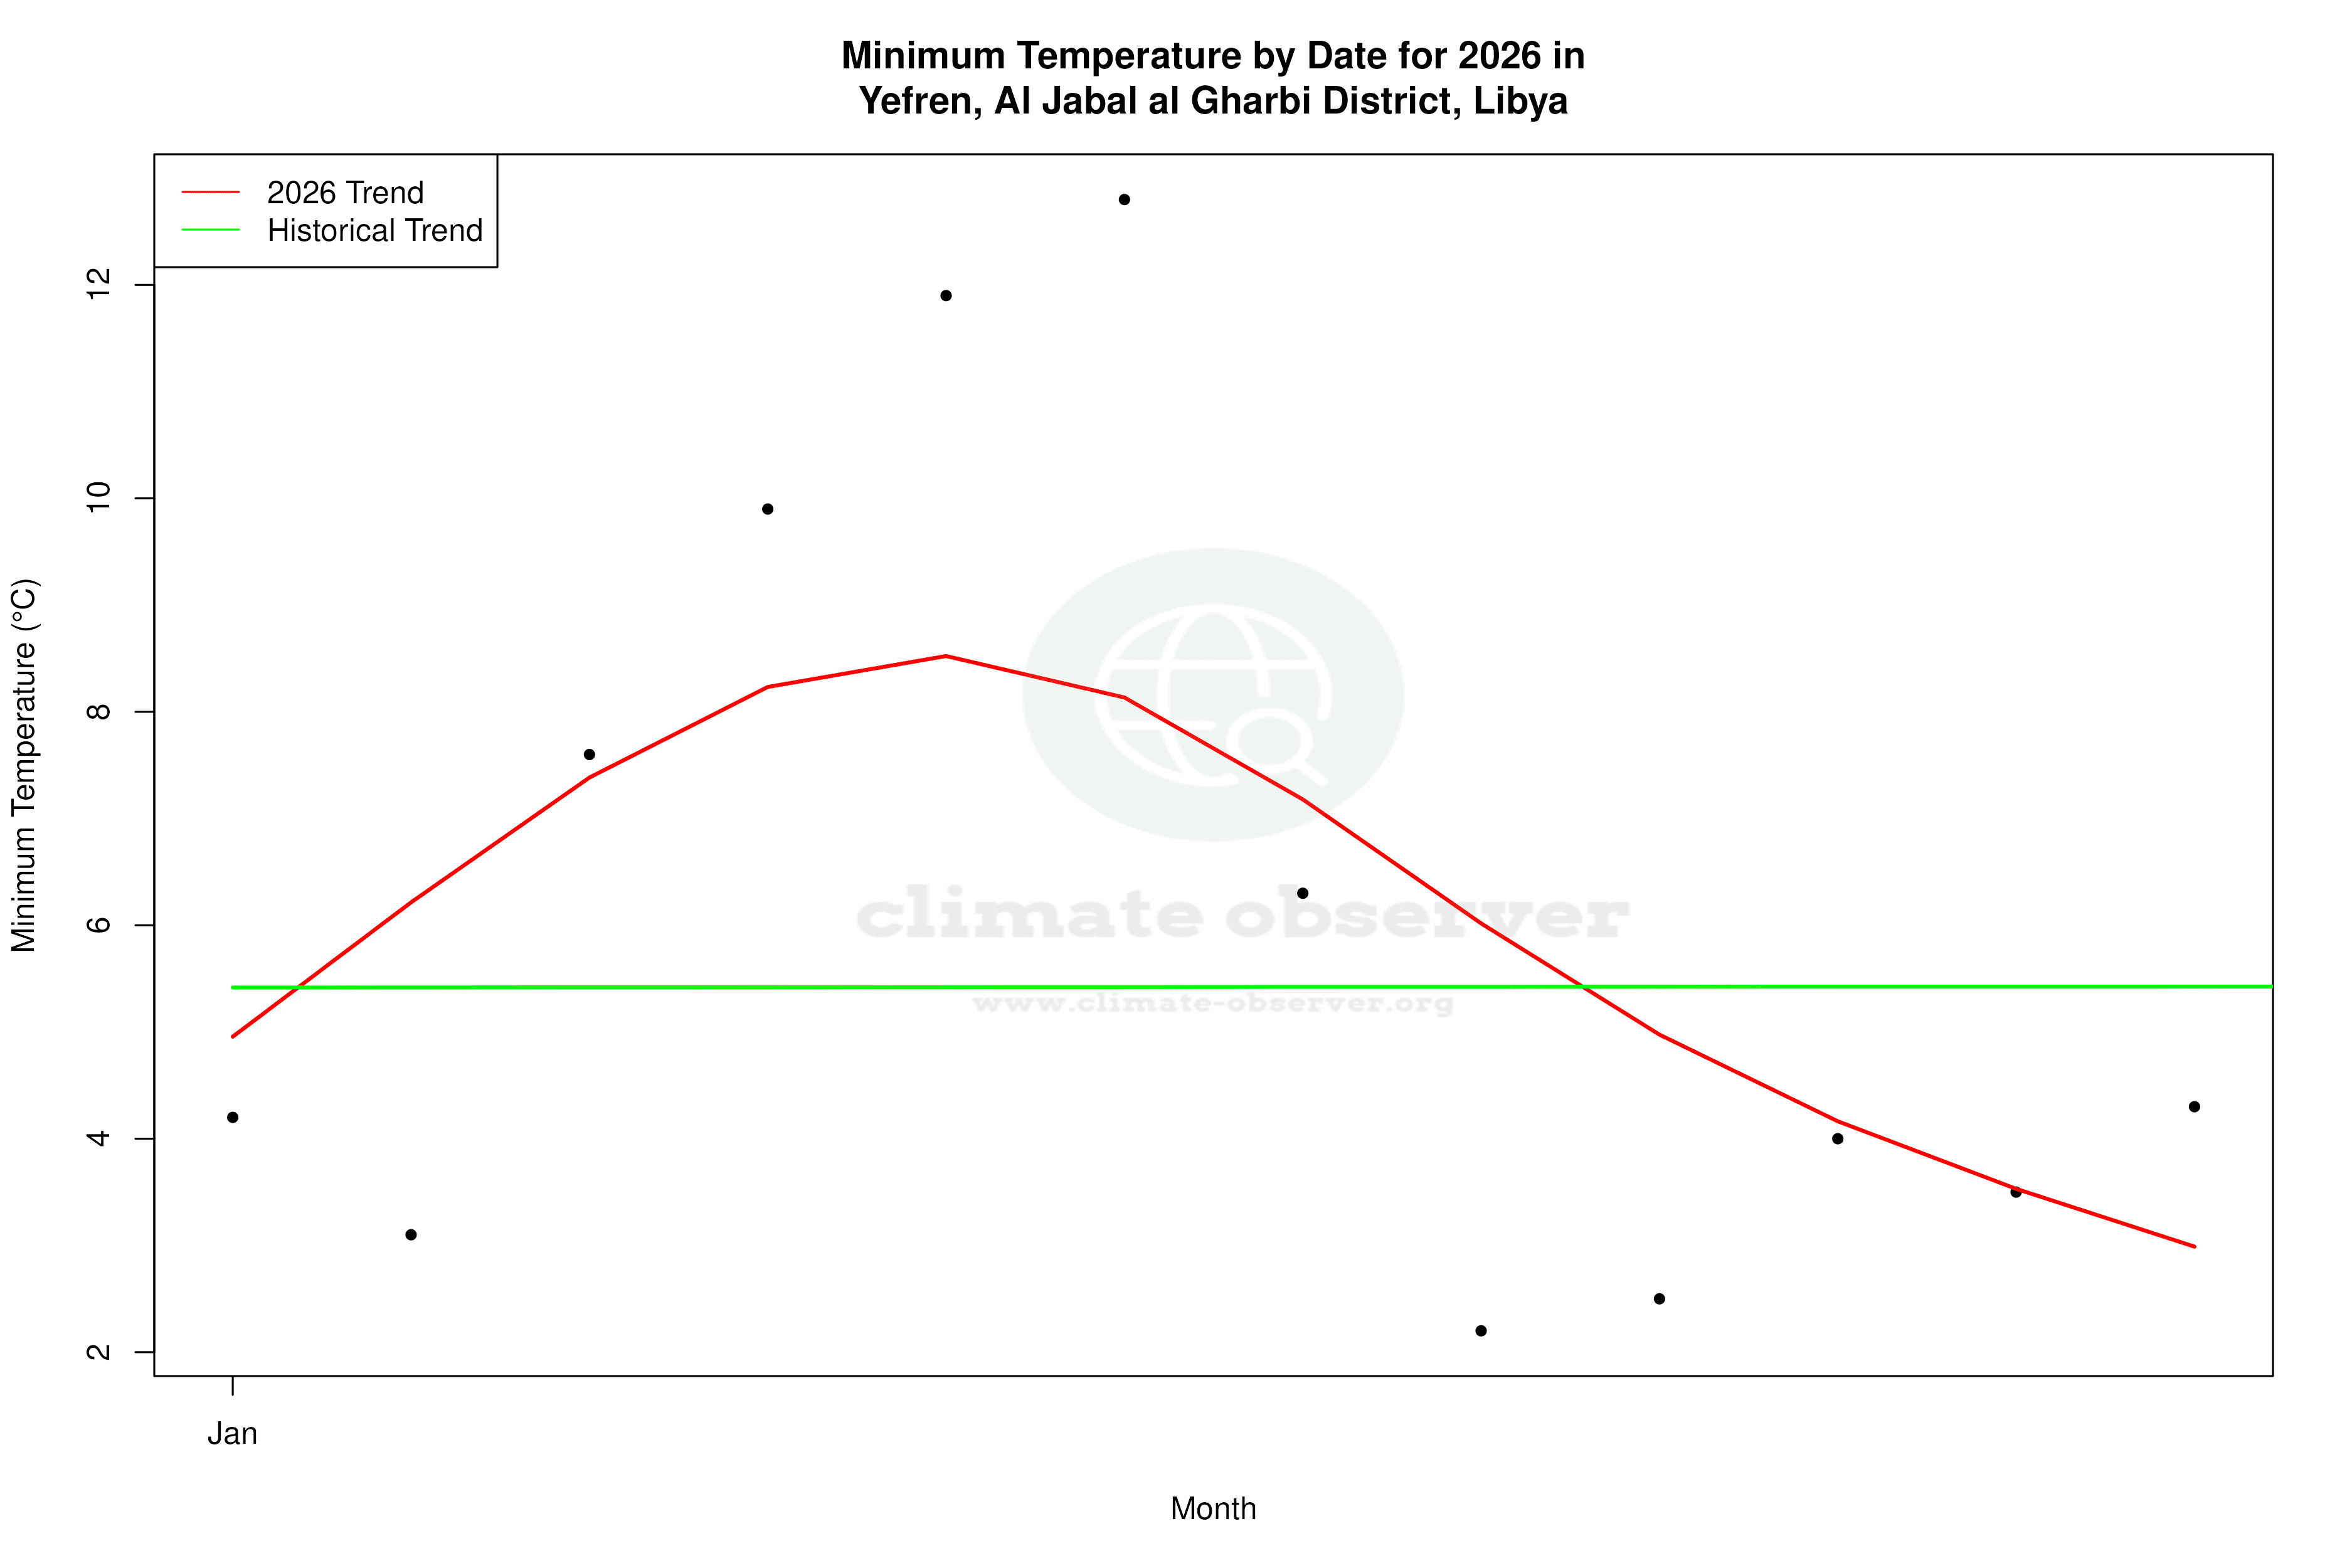
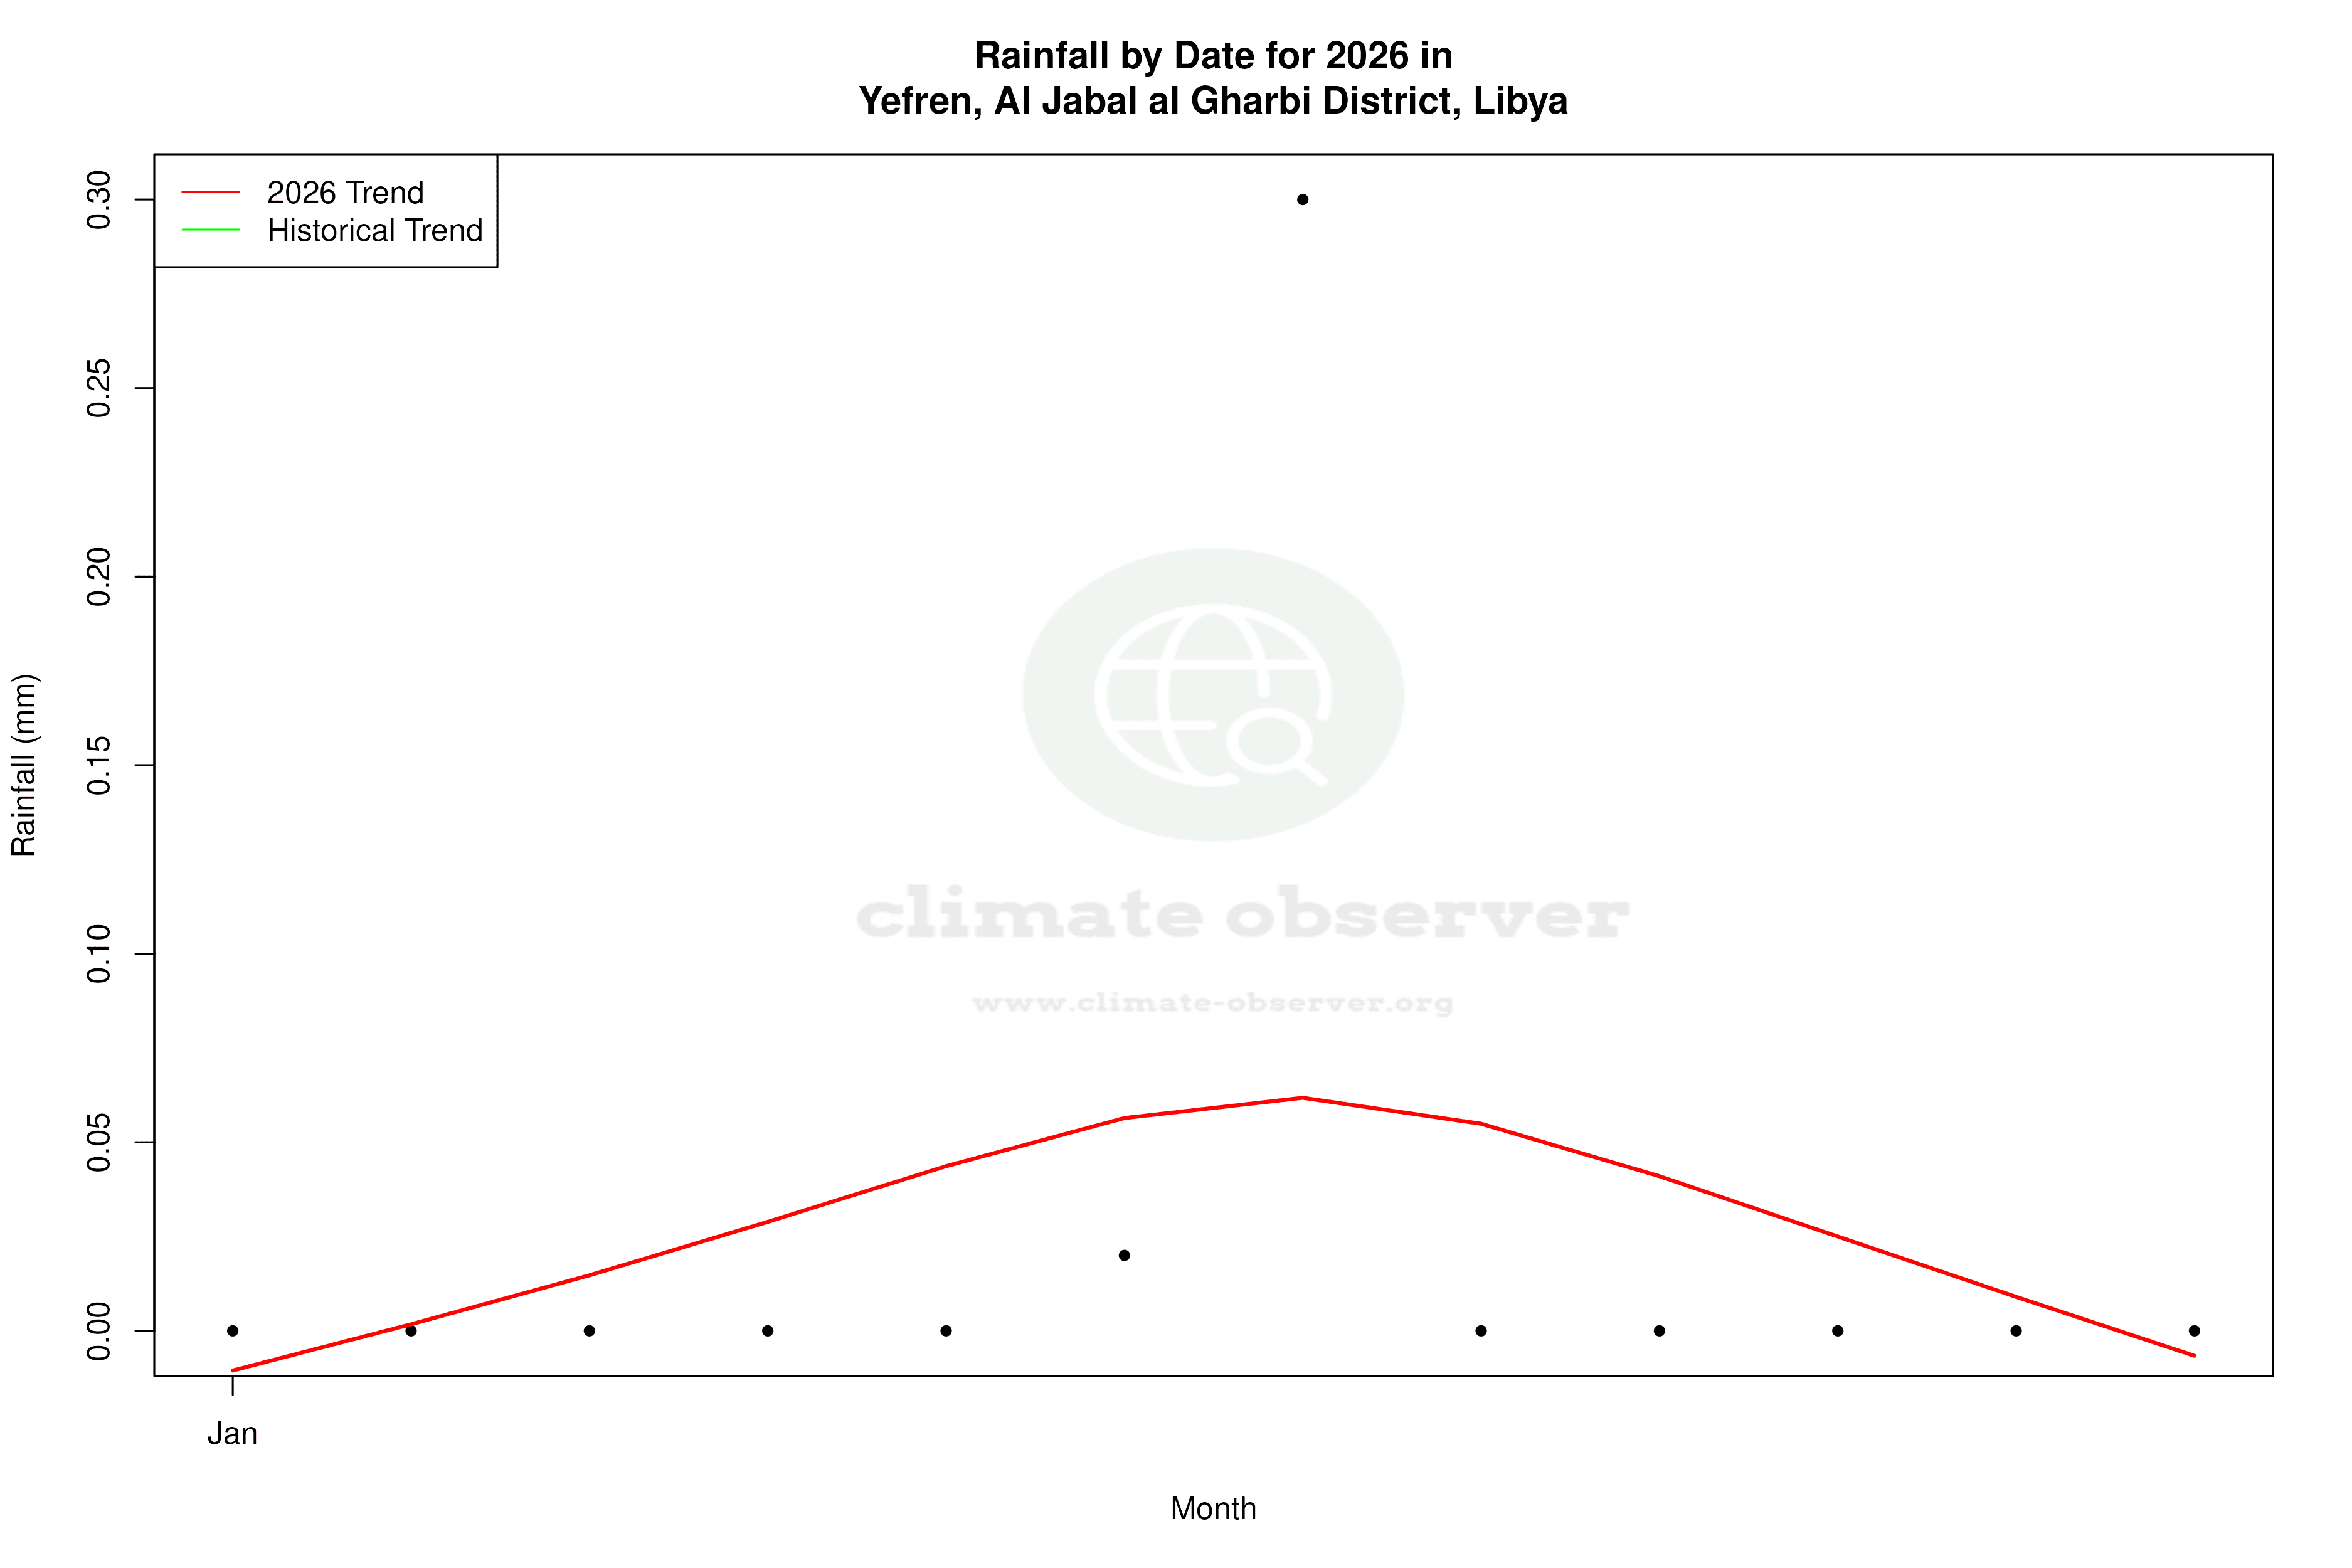
Yefren's climate is marked by a complex interplay of cooling and warming trends. While high temperatures have shown a 0.07°C (0.13°F) fall over the long term, low temperatures have risen by 0.51°C (0.92°F), indicating a warming trend. The Precipitation Concentration Index (PCI) has decreased, suggesting a more even distribution of rainfall events.
Desert Climate Dynamics
Yefren, located in the Nafusa Mountains of Libya, falls under the BSh category of the Köppen climate classification, indicating a hot semi-arid climate. The mountainous terrain influences local weather patterns, often moderating extreme temperatures typical of the surrounding desert regions. Over the past decade, the region has experienced a cooling of high temperatures by 0.63°C (1.13°F), while low temperatures have increased by 2.17°C (3.91°F). This divergence suggests a more pronounced warming of nighttime temperatures, which could be attributed to changes in atmospheric circulation or increased cloud cover at night.
Temperature Extremes and Records
Yefren has recorded temperature extremes with an all-time high of 46.24°C (115.23°F) and a low of -6.00°C (21.2°F). These records highlight the variability and range of temperatures that the region can experience. The slight long-term cooling of high temperatures by 0.07°C (0.13°F) contrasts with the warming trend in low temperatures, reflecting a complex thermal dynamic possibly influenced by both local geography and broader climatic changes.
Precipitation Patterns and Distribution
The Precipitation Concentration Index (PCI) for Yefren has shown a decrease from a baseline of 23.60 to a current value of 19.58. This shift indicates a more even distribution of rainfall events, moving away from highly concentrated precipitation patterns. Such a change can have significant implications for agriculture and water resource management, as more evenly distributed rainfall can reduce the risk of droughts and improve crop yields.
Regional Climate Context
Libya's climate goals focus on adapting to and mitigating the impacts of climate change, particularly in regions like Yefren that are susceptible to temperature extremes and variable precipitation. Recent weather events have underscored the importance of understanding local climate dynamics, as shifts in temperature and precipitation patterns can have profound effects on both the environment and human activities. The warming trend in low temperatures, coupled with a more even distribution of rainfall, suggests potential shifts in the region's agricultural viability and water resource management strategies.
Station Statistics
10-Year Trend
High: -1.03 °F/decade
Low: +3.65 °F/decade
Rain: -0.004 in/decade
25-Year Trend
High: +0.09 °F/decade
Low: +0.62 °F/decade
Rain: -0.000 in/decade
50-Year Trend
High: -0.12 °F/decade
Low: +0.92 °F/decade
Rain: -0.001 in/decade
All-Time Trend
High: -0.12 °F/decade
Low: +0.92 °F/decade
Rain: -0.001 in/decade
Percentage Above-Average Days
Last 12 Months: 52.8%
This Year: 66.4%
Precipitation Concentration Index (PCI) ℹ️
Last 12 Months: 27.0
Historical Average: 23.5
Percentile Rank of Last 12 Months ℹ️
High: 45th percentile
Low: 87th percentile
Rain: 25th percentile
Change in Variance ℹ️
High: -2.8%
Low: -2.0%
Intraday: -18.5%
Data Coverage
100.0%
First Year of Data
1981
Station Location
Historical Weather Records
| Max High | Avg High | Min High | Max Avg | Avg Avg | Min Avg | Max Low | Avg Low | Min Low | Max Precipitation | Avg Precipitation | Max Snow | Avg Snow | |
|---|---|---|---|---|---|---|---|---|---|---|---|---|---|
| Record | 115.23 °F | — | 38.48 °F | 101.48 °F | — | 30.87 °F | 91.04 °F | — | 21.20 °F | 2.51 in | — | — | — |
| January | 84.20 °F | 57.48 °F | 39.04 °F | 72.86 °F | 49.16 °F | 30.87 °F | 64.58 °F | 41.92 °F | 22.62 °F | 1.89 in | 0.05 in | — | — |
| February | 87.26 °F | 60.47 °F | 38.48 °F | 78.44 °F | 51.64 °F | 33.62 °F | 68.90 °F | 43.24 °F | 27.25 °F | 1.42 in | 0.04 in | — | — |
| March | 100.04 °F | 67.51 °F | 44.60 °F | 81.32 °F | 57.52 °F | 40.82 °F | 71.78 °F | 48.01 °F | 32.07 °F | 2.27 in | 0.04 in | — | — |
| April | 102.34 °F | 76.50 °F | 49.50 °F | 89.06 °F | 64.95 °F | 42.26 °F | 77.00 °F | 53.75 °F | 33.98 °F | 1.08 in | 0.01 in | — | — |
| May | 109.72 °F | 84.46 °F | 52.70 °F | 98.96 °F | 72.72 °F | 51.62 °F | 84.20 °F | 61.29 °F | 33.80 °F | 1.70 in | 0.01 in | — | — |
| June | 111.94 °F | 92.47 °F | 62.96 °F | 101.48 °F | 80.26 °F | 58.82 °F | 89.60 °F | 68.51 °F | 50.90 °F | 0.61 in | 0.00 in | — | — |
| July | 115.23 °F | 95.78 °F | 71.06 °F | 100.94 °F | 83.35 °F | 65.66 °F | 90.32 °F | 71.67 °F | 58.10 °F | 0.29 in | 0.00 in | — | — |
| August | 112.91 °F | 95.45 °F | 76.46 °F | 100.40 °F | 83.38 °F | 68.36 °F | 91.04 °F | 72.27 °F | 56.48 °F | 0.53 in | 0.00 in | — | — |
| September | 108.07 °F | 90.16 °F | 67.64 °F | 95.54 °F | 78.85 °F | 59.54 °F | 87.80 °F | 68.99 °F | 51.80 °F | 1.99 in | 0.02 in | — | — |
| October | 104.49 °F | 80.77 °F | 57.74 °F | 88.68 °F | 71.03 °F | 52.16 °F | 79.70 °F | 62.44 °F | 44.60 °F | 1.48 in | 0.03 in | — | — |
| November | 93.31 °F | 68.95 °F | 46.40 °F | 81.50 °F | 60.42 °F | 41.54 °F | 75.56 °F | 52.85 °F | 37.04 °F | 2.51 in | 0.04 in | — | — |
| December | 81.48 °F | 59.68 °F | 39.74 °F | 72.32 °F | 51.75 °F | 36.27 °F | 66.92 °F | 44.75 °F | 21.20 °F | 1.79 in | 0.06 in | — | — |
Data Visualisations
Remove WatermarksCurrent Year Climate Trends vs Historical
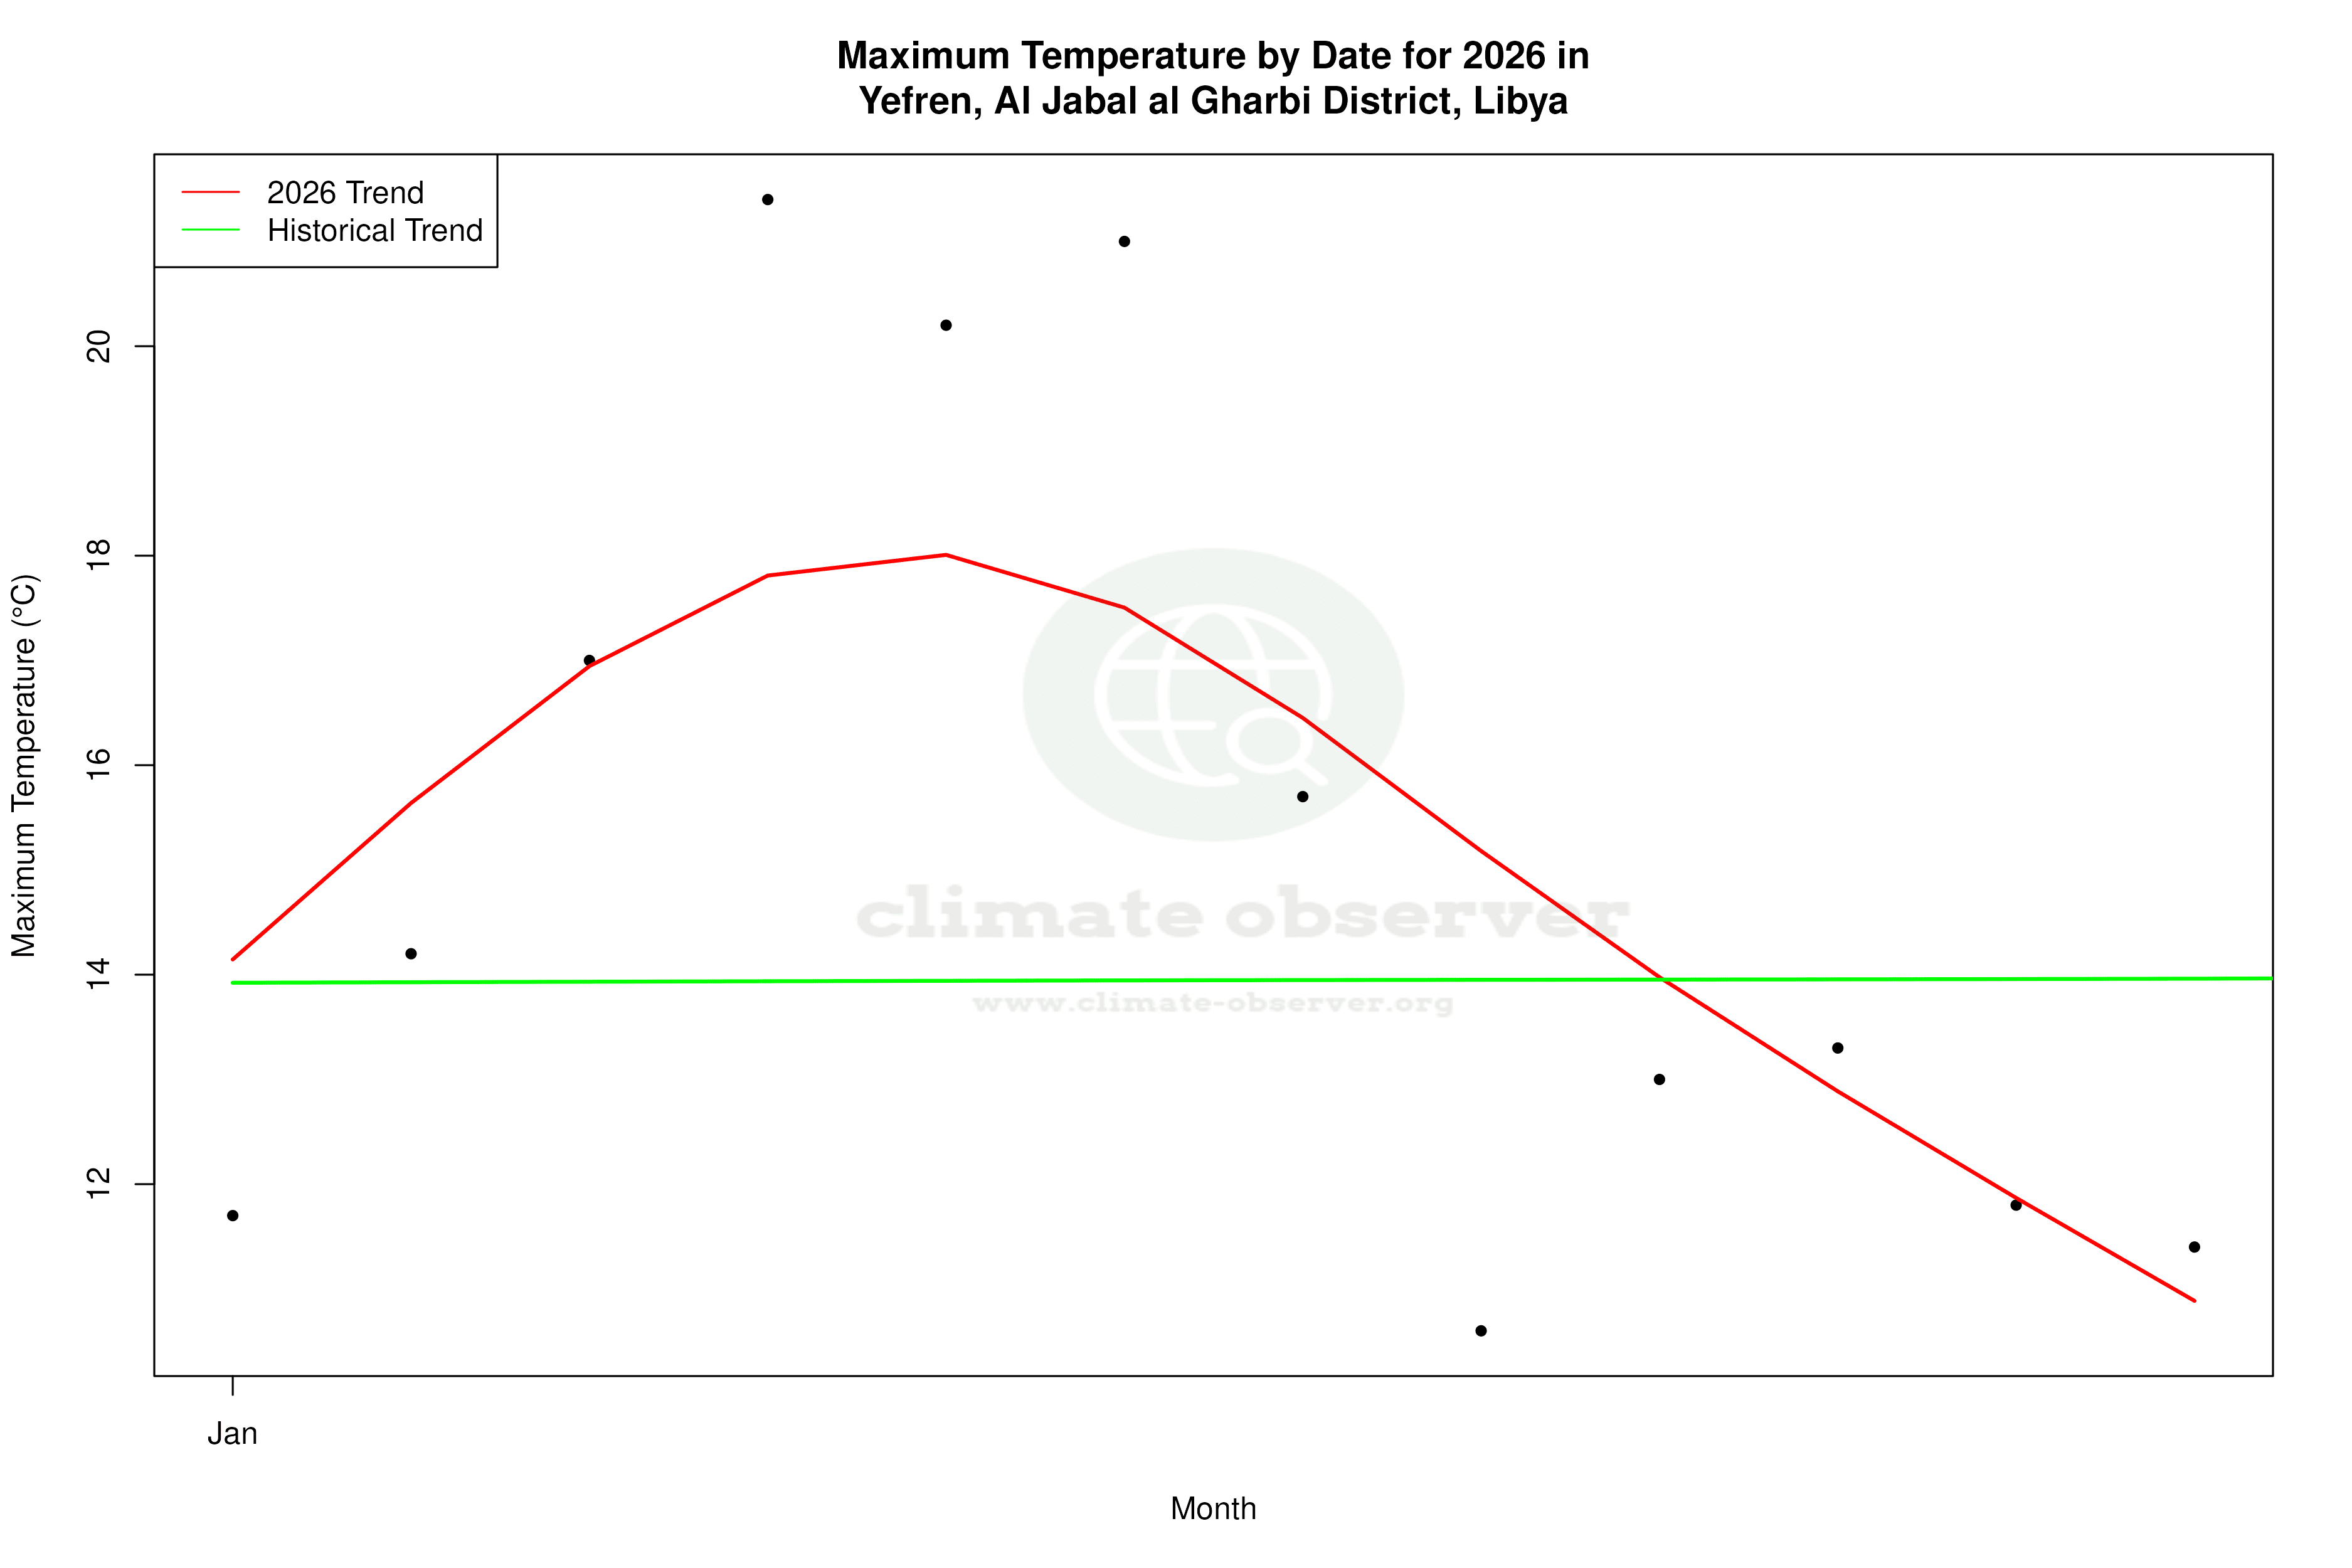


Max Temperature this Year | 1 of 6
Climate 12-Month Moving Averages


Max Temperature 12-Month MA | 1 of 6
Daily Data Points and Averages Throughout the Year


Average Max Temperature Throughout Year | 1 of 5
