Climate for Station: Jalo, Al Wahat District, Libya
Loading live weather...
Climate Analysis & Overview
Jalo, Libya is experiencing a notable warming trend, with significant increases in both high and low temperatures over the past decade. The region's precipitation pattern has become more evenly distributed, suggesting shifts in local climate dynamics. These changes align with broader regional climate goals aimed at understanding and mitigating climate impacts.
Desert Climate Dynamics
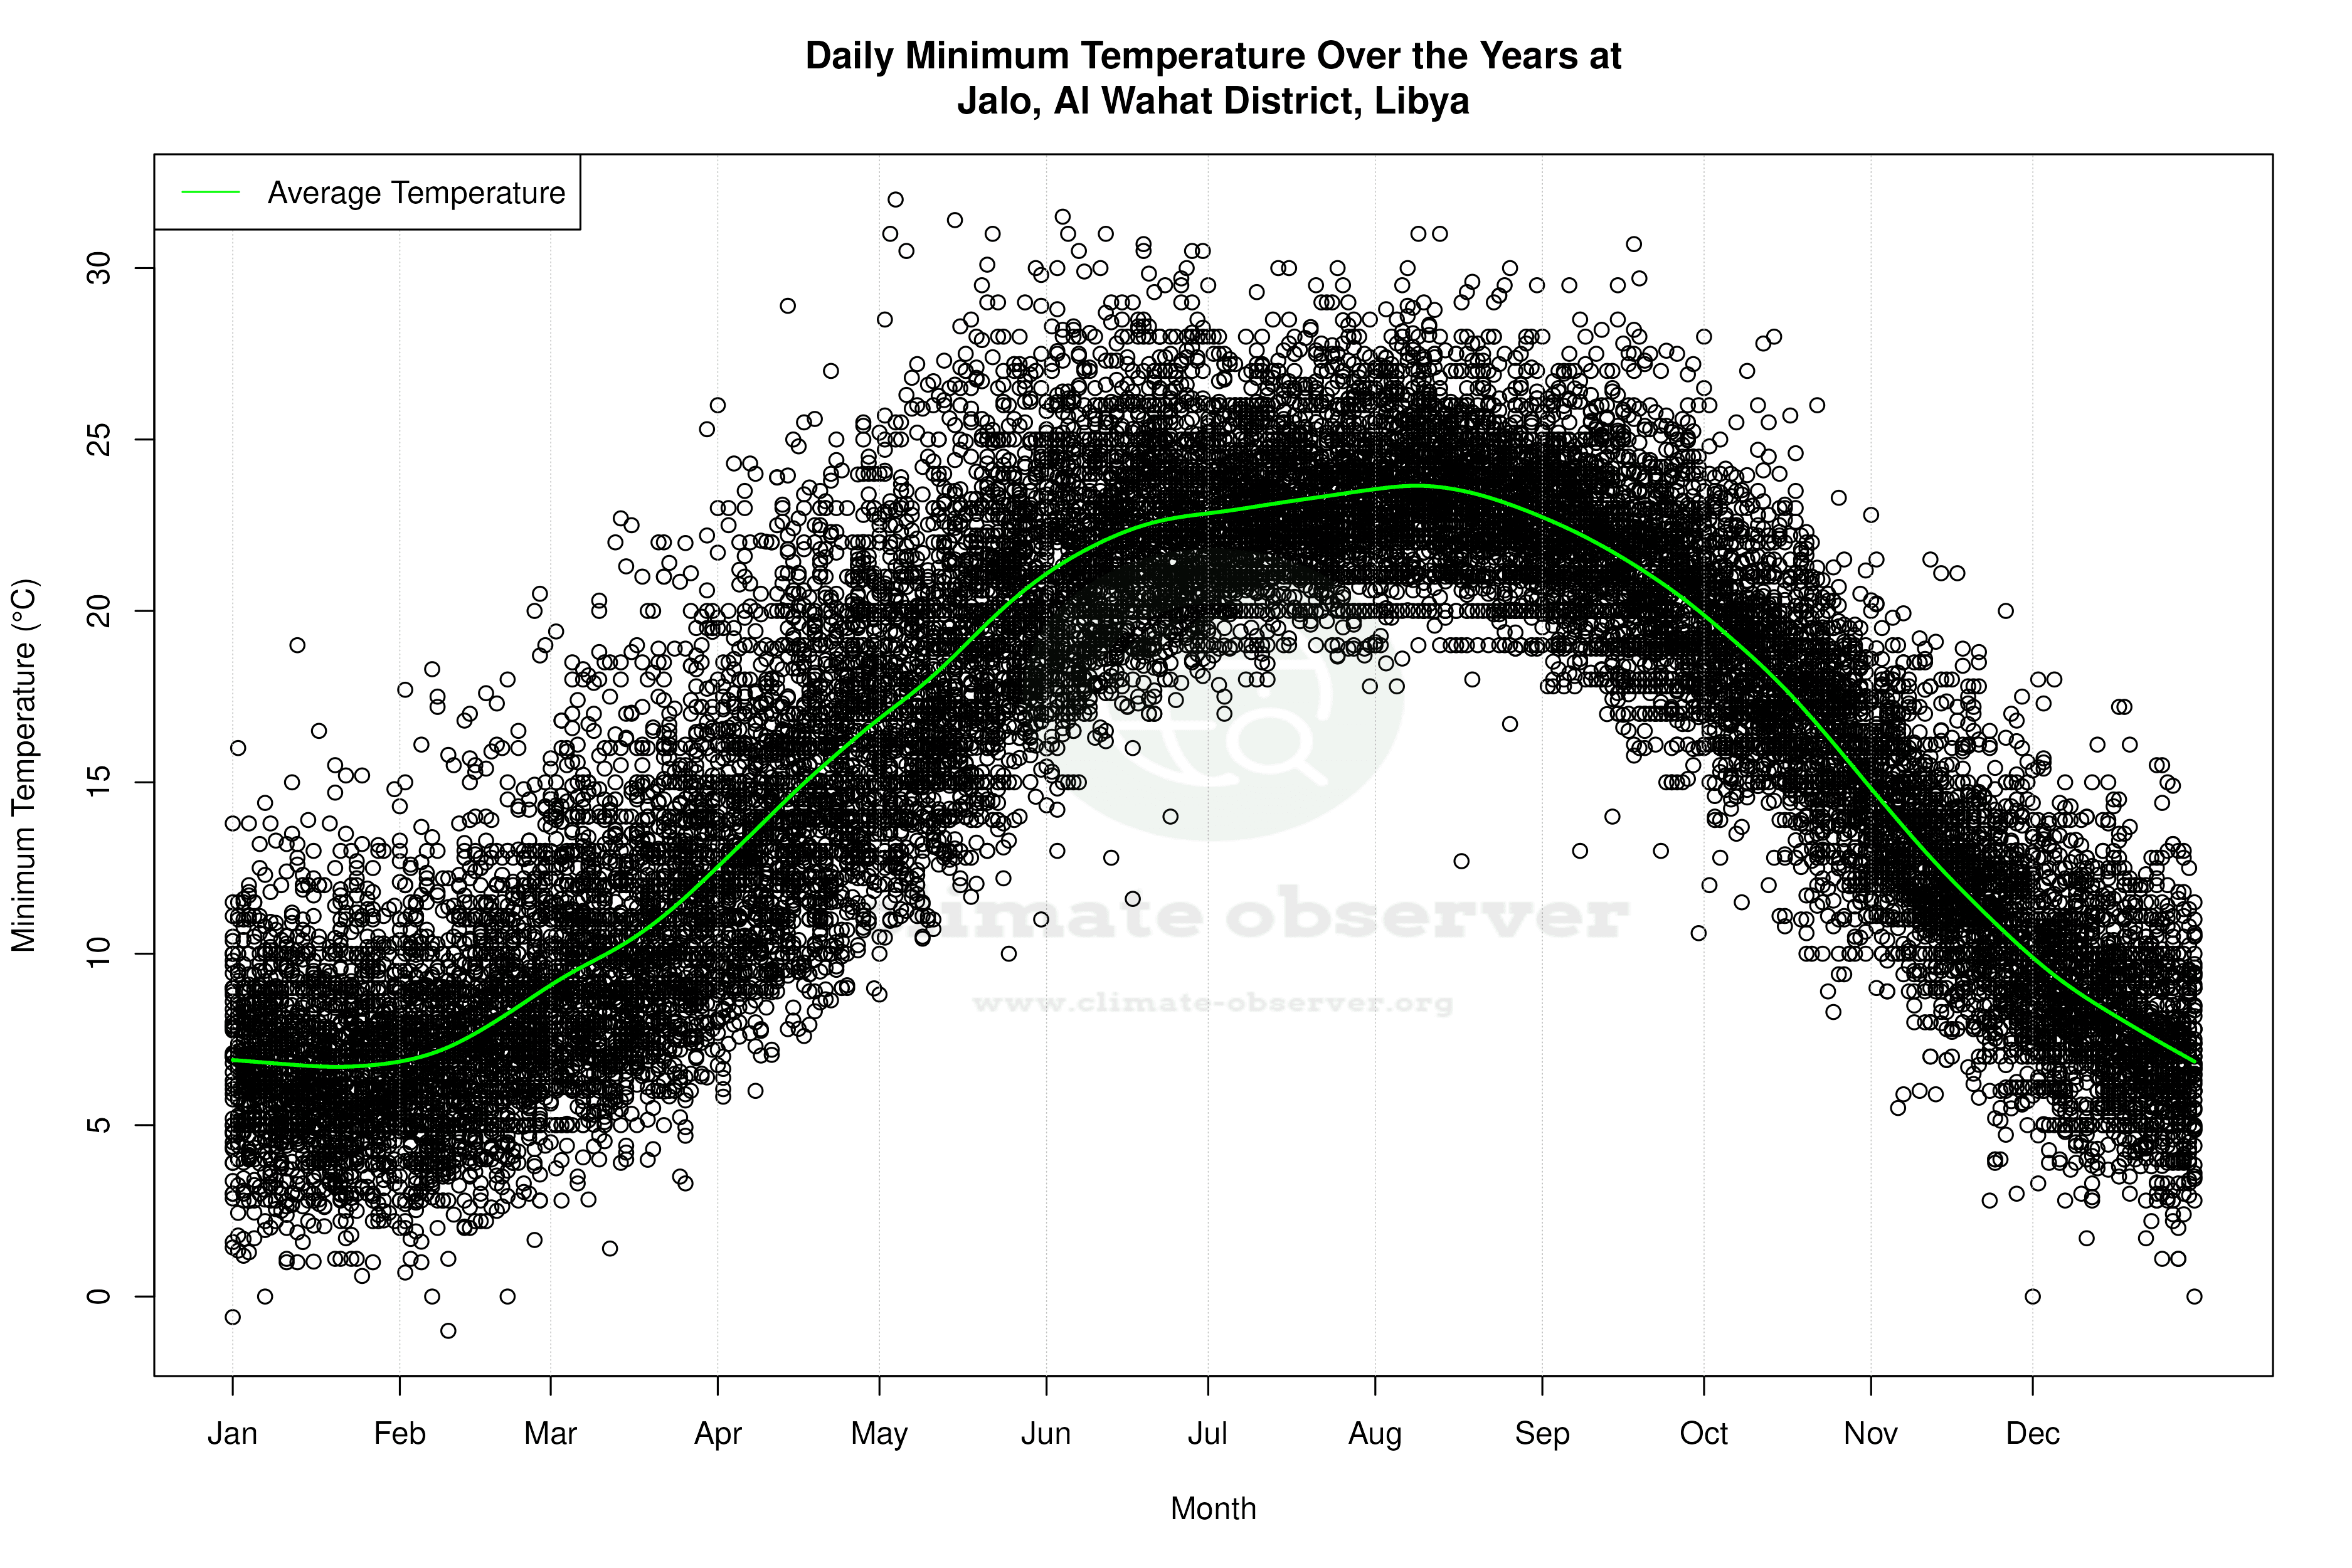
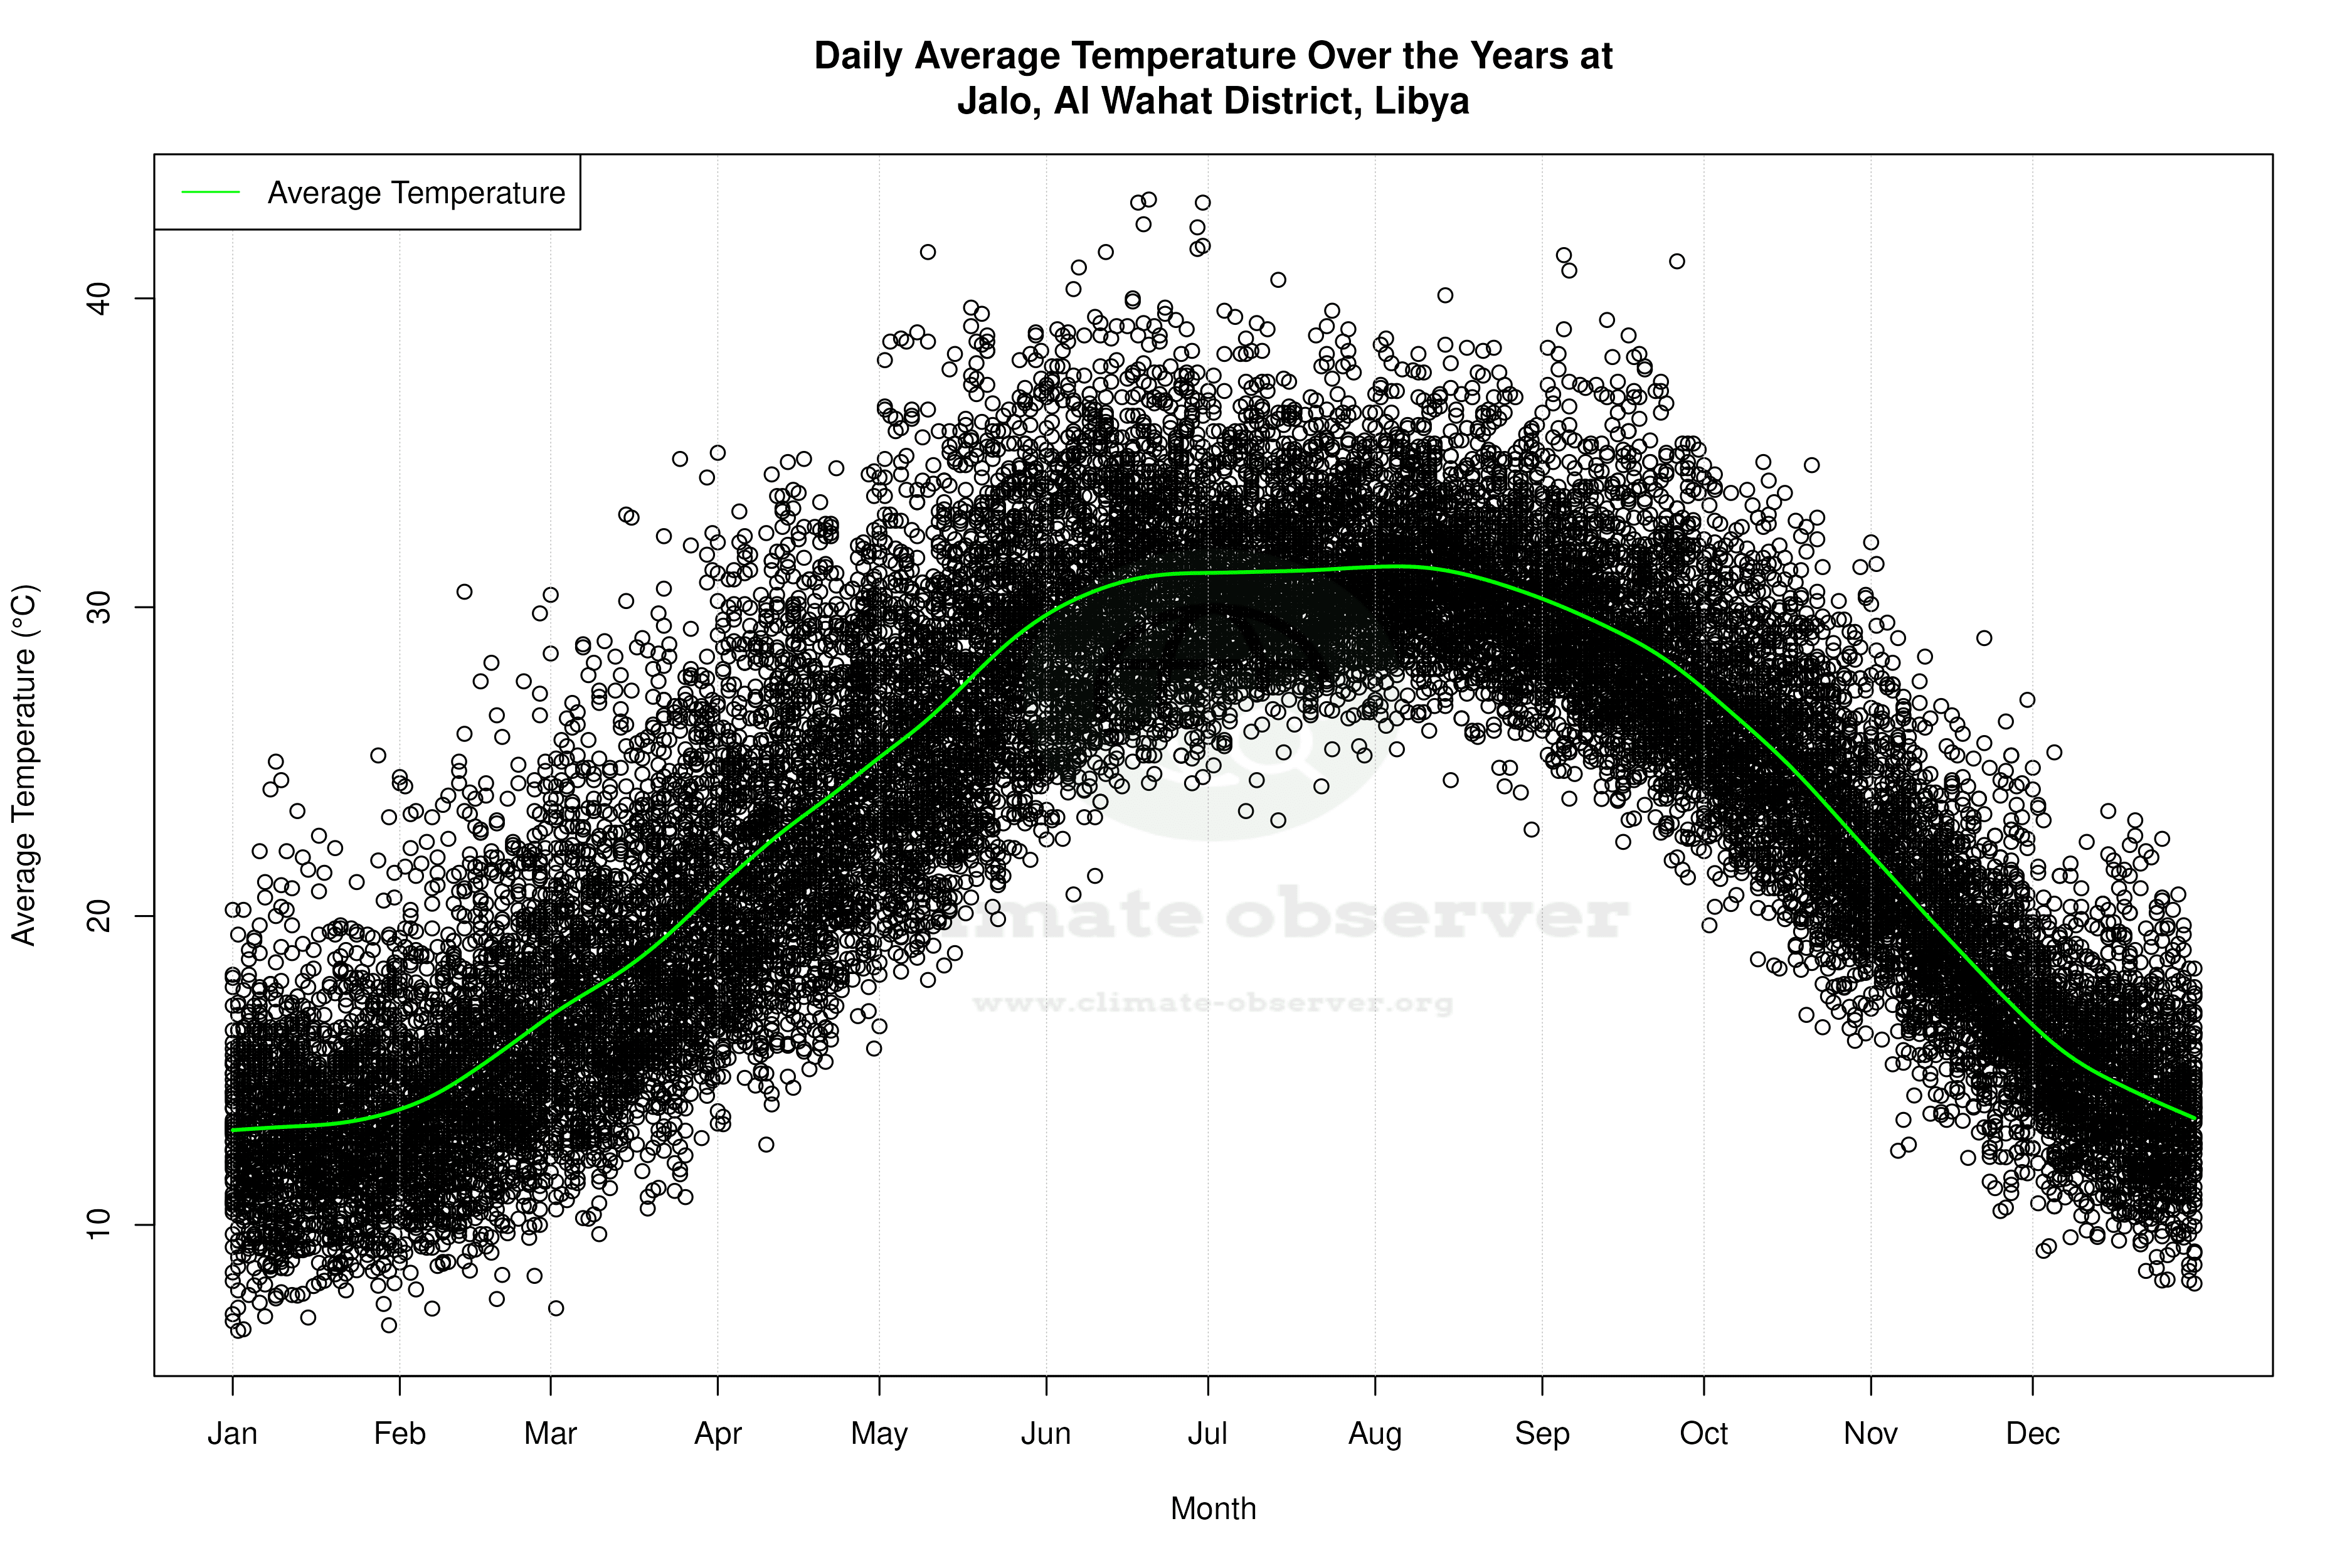
Jalo is situated in the heart of Libya's desert region, classified under the BWh category of the Köppen climate classification. This denotes a hot desert climate, characterised by extreme temperature variations and minimal precipitation. The geography, dominated by arid landscapes and vast stretches of sand, plays a pivotal role in shaping the local climate. The all-time temperature trends in Jalo indicate a warming pattern, with highs increasing by 0.21°C (0.38°F) and lows by 0.44°C (0.79°F). These figures, though modest, highlight a gradual rise in temperatures over the years.
Recent Temperature Surge
In the last decade, Jalo has experienced a more pronounced warming trend. High temperatures have risen by 1.76°C (3.17°F), while low temperatures have surged by 2.13°C (3.83°F). This sharp increase in temperature extremes suggests a shift towards hotter conditions, potentially impacting local ecosystems and human activities. The record temperatures further underscore this trend, with a maximum recorded high of 48.9°C (120.0°F) and a minimum of -1.0°C (30.2°F), illustrating the region's capacity for extreme thermal fluctuations.
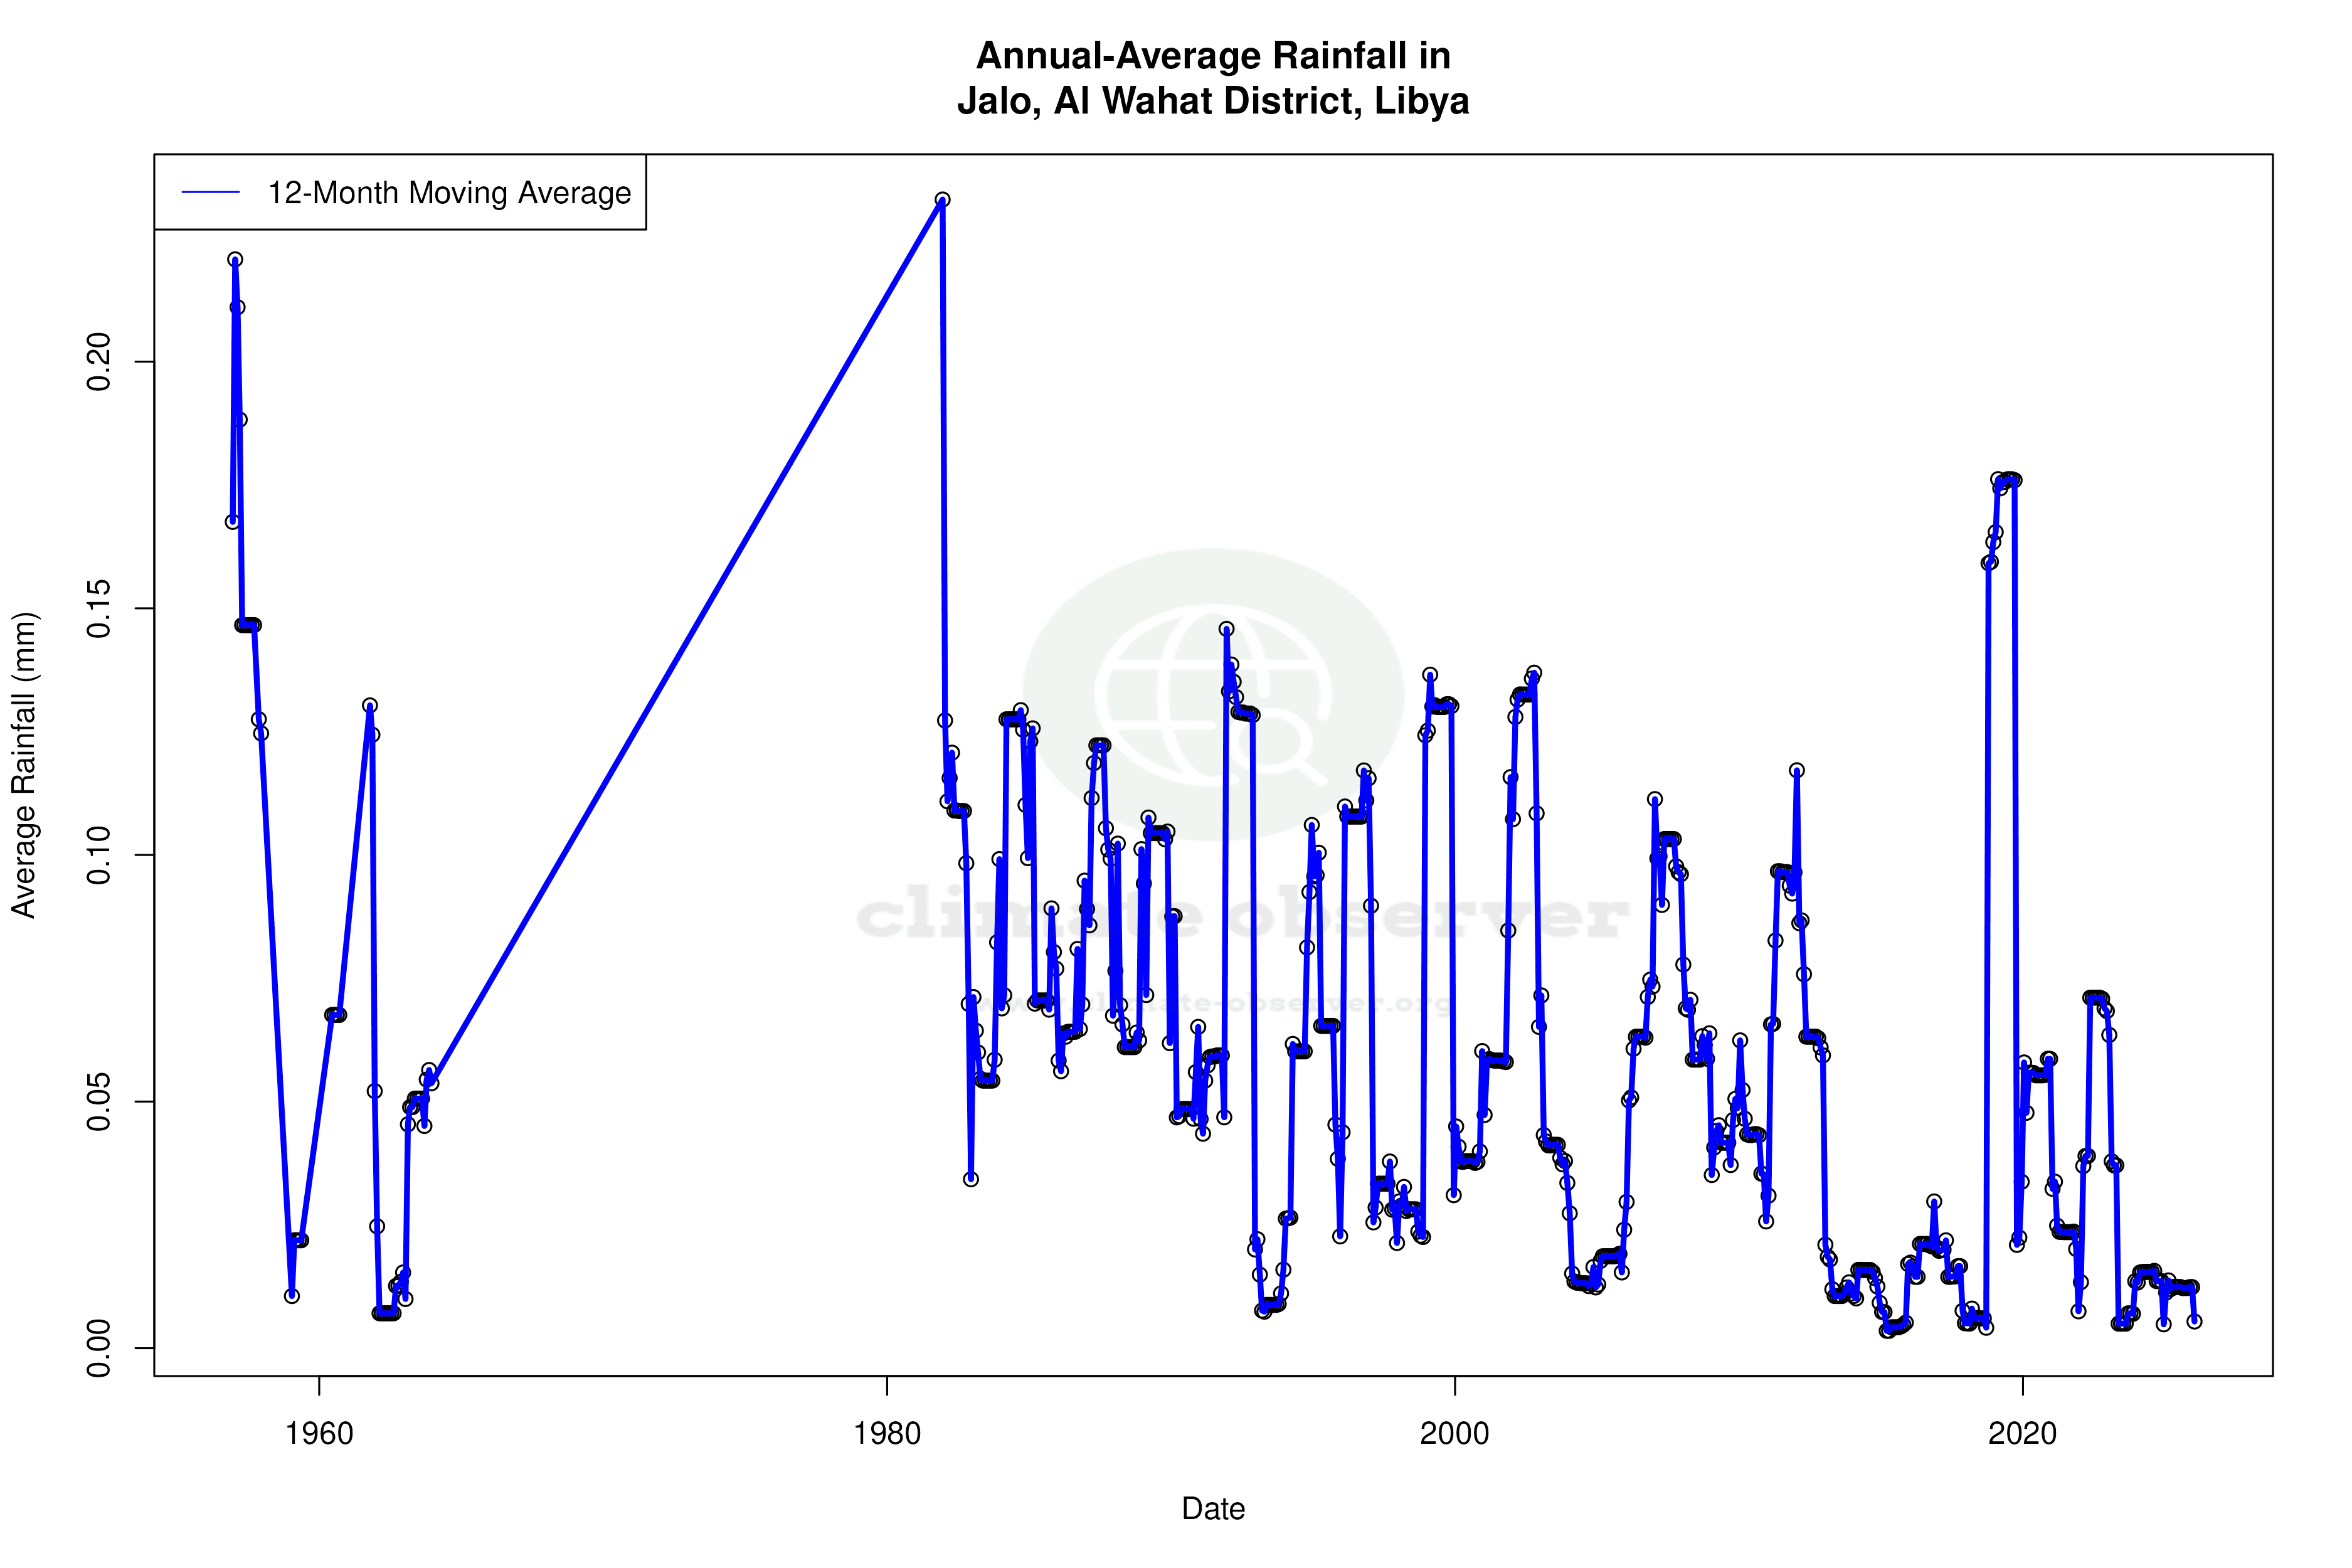
Evolving Precipitation Patterns
The Precipitation Concentration Index (PCI) for Jalo has decreased from a baseline of 36.0 to a current value of 27.3. This reduction indicates that precipitation events are now more evenly distributed throughout the year, as opposed to being concentrated in fewer, intense events. While the PCI remains high, suggesting that precipitation is still relatively concentrated, this shift towards more even distribution could have implications for water resource management and agricultural practices in the region.
Regional Climate Implications
The climatic changes observed in Jalo are reflective of broader regional trends in North Africa, where rising temperatures and shifting precipitation patterns are common. Libya's climate goals, which focus on enhancing resilience and adaptive capacity, are crucial in addressing these challenges. The warming trends and changes in precipitation distribution in Jalo provide valuable insights into the ongoing climate dynamics, informing both local and national strategies for sustainable development and climate adaptation.
Station Statistics
10-Year Trend
High: +2.79 °F/decade
Low: +4.09 °F/decade
Rain: -0.002 in/decade
25-Year Trend
High: +0.80 °F/decade
Low: +1.49 °F/decade
Rain: -0.001 in/decade
50-Year Trend
High: +0.84 °F/decade
Low: +1.12 °F/decade
Rain: -0.001 in/decade
All-Time Trend
High: +0.38 °F/decade
Low: +0.80 °F/decade
Rain: -0.000 in/decade
Percentage Above-Average Days
Last 12 Months: 51.0%
This Year: 50.0%
Precipitation Concentration Index (PCI) ℹ️
Last 12 Months: 62.1
Historical Average: 36.3
Percentile Rank of Last 12 Months ℹ️
High: 81st percentile
Low: 99th percentile
Rain: 12th percentile
Change in Variance ℹ️
High: -0.1%
Low: +9.4%
Intraday: +5.5%
Data Coverage
80.1%
First Year of Data
1956
Station Location
Historical Weather Records
| Max High | Avg High | Min High | Max Avg | Avg Avg | Min Avg | Max Low | Avg Low | Min Low | Max Precipitation | Avg Precipitation | Max Snow | Avg Snow | |
|---|---|---|---|---|---|---|---|---|---|---|---|---|---|
| Record | 120.02 °F | — | 50.00 °F | 109.76 °F | — | 43.83 °F | 91.40 °F | — | 30.20 °F | 1.56 in | — | — | — |
| January | 89.24 °F | 66.52 °F | 51.78 °F | 77.36 °F | 56.00 °F | 43.83 °F | 66.20 °F | 44.38 °F | 30.92 °F | 0.39 in | 0.01 in | — | — |
| February | 101.30 °F | 69.90 °F | 50.00 °F | 86.90 °F | 59.16 °F | 45.12 °F | 69.08 °F | 46.08 °F | 30.20 °F | 0.61 in | 0.00 in | — | — |
| March | 109.04 °F | 77.08 °F | 59.00 °F | 94.64 °F | 65.45 °F | 45.14 °F | 77.54 °F | 51.14 °F | 34.52 °F | 0.74 in | 0.00 in | — | — |
| April | 112.64 °F | 86.04 °F | 62.06 °F | 95.00 °F | 73.42 °F | 54.68 °F | 84.02 °F | 58.52 °F | 34.16 °F | 0.40 in | 0.00 in | — | — |
| May | 120.02 °F | 93.24 °F | 73.74 °F | 106.70 °F | 81.28 °F | 49.82 °F | 89.60 °F | 66.03 °F | 47.86 °F | 0.79 in | 0.00 in | — | — |
| June | 119.66 °F | 98.97 °F | 80.60 °F | 109.76 °F | 87.25 °F | 69.26 °F | 88.70 °F | 72.00 °F | 52.88 °F | 0.00 in | 0.00 in | — | — |
| July | 116.96 °F | 99.24 °F | 87.44 °F | 105.08 °F | 88.07 °F | 73.58 °F | 91.40 °F | 73.71 °F | 62.60 °F | 0.00 in | 0.00 in | — | — |
| August | 116.60 °F | 98.94 °F | 88.41 °F | 104.18 °F | 87.87 °F | 73.04 °F | 89.60 °F | 74.20 °F | 54.86 °F | 0.00 in | 0.00 in | — | — |
| September | 113.72 °F | 95.46 °F | 81.28 °F | 106.52 °F | 84.44 °F | 70.25 °F | 87.26 °F | 70.86 °F | 51.08 °F | 0.14 in | 0.00 in | — | — |
| October | 108.86 °F | 87.67 °F | 70.99 °F | 94.46 °F | 76.77 °F | 60.73 °F | 82.40 °F | 63.76 °F | 46.94 °F | 1.56 in | 0.00 in | — | — |
| November | 102.92 °F | 77.75 °F | 60.96 °F | 89.78 °F | 66.84 °F | 50.81 °F | 73.04 °F | 54.23 °F | 37.04 °F | 0.27 in | 0.00 in | — | — |
| December | 91.94 °F | 69.05 °F | 54.88 °F | 77.54 °F | 58.51 °F | 46.58 °F | 64.40 °F | 46.87 °F | 32.00 °F | 0.91 in | 0.01 in | — | — |
Data Visualisations
Remove WatermarksCurrent Year Climate Trends vs Historical


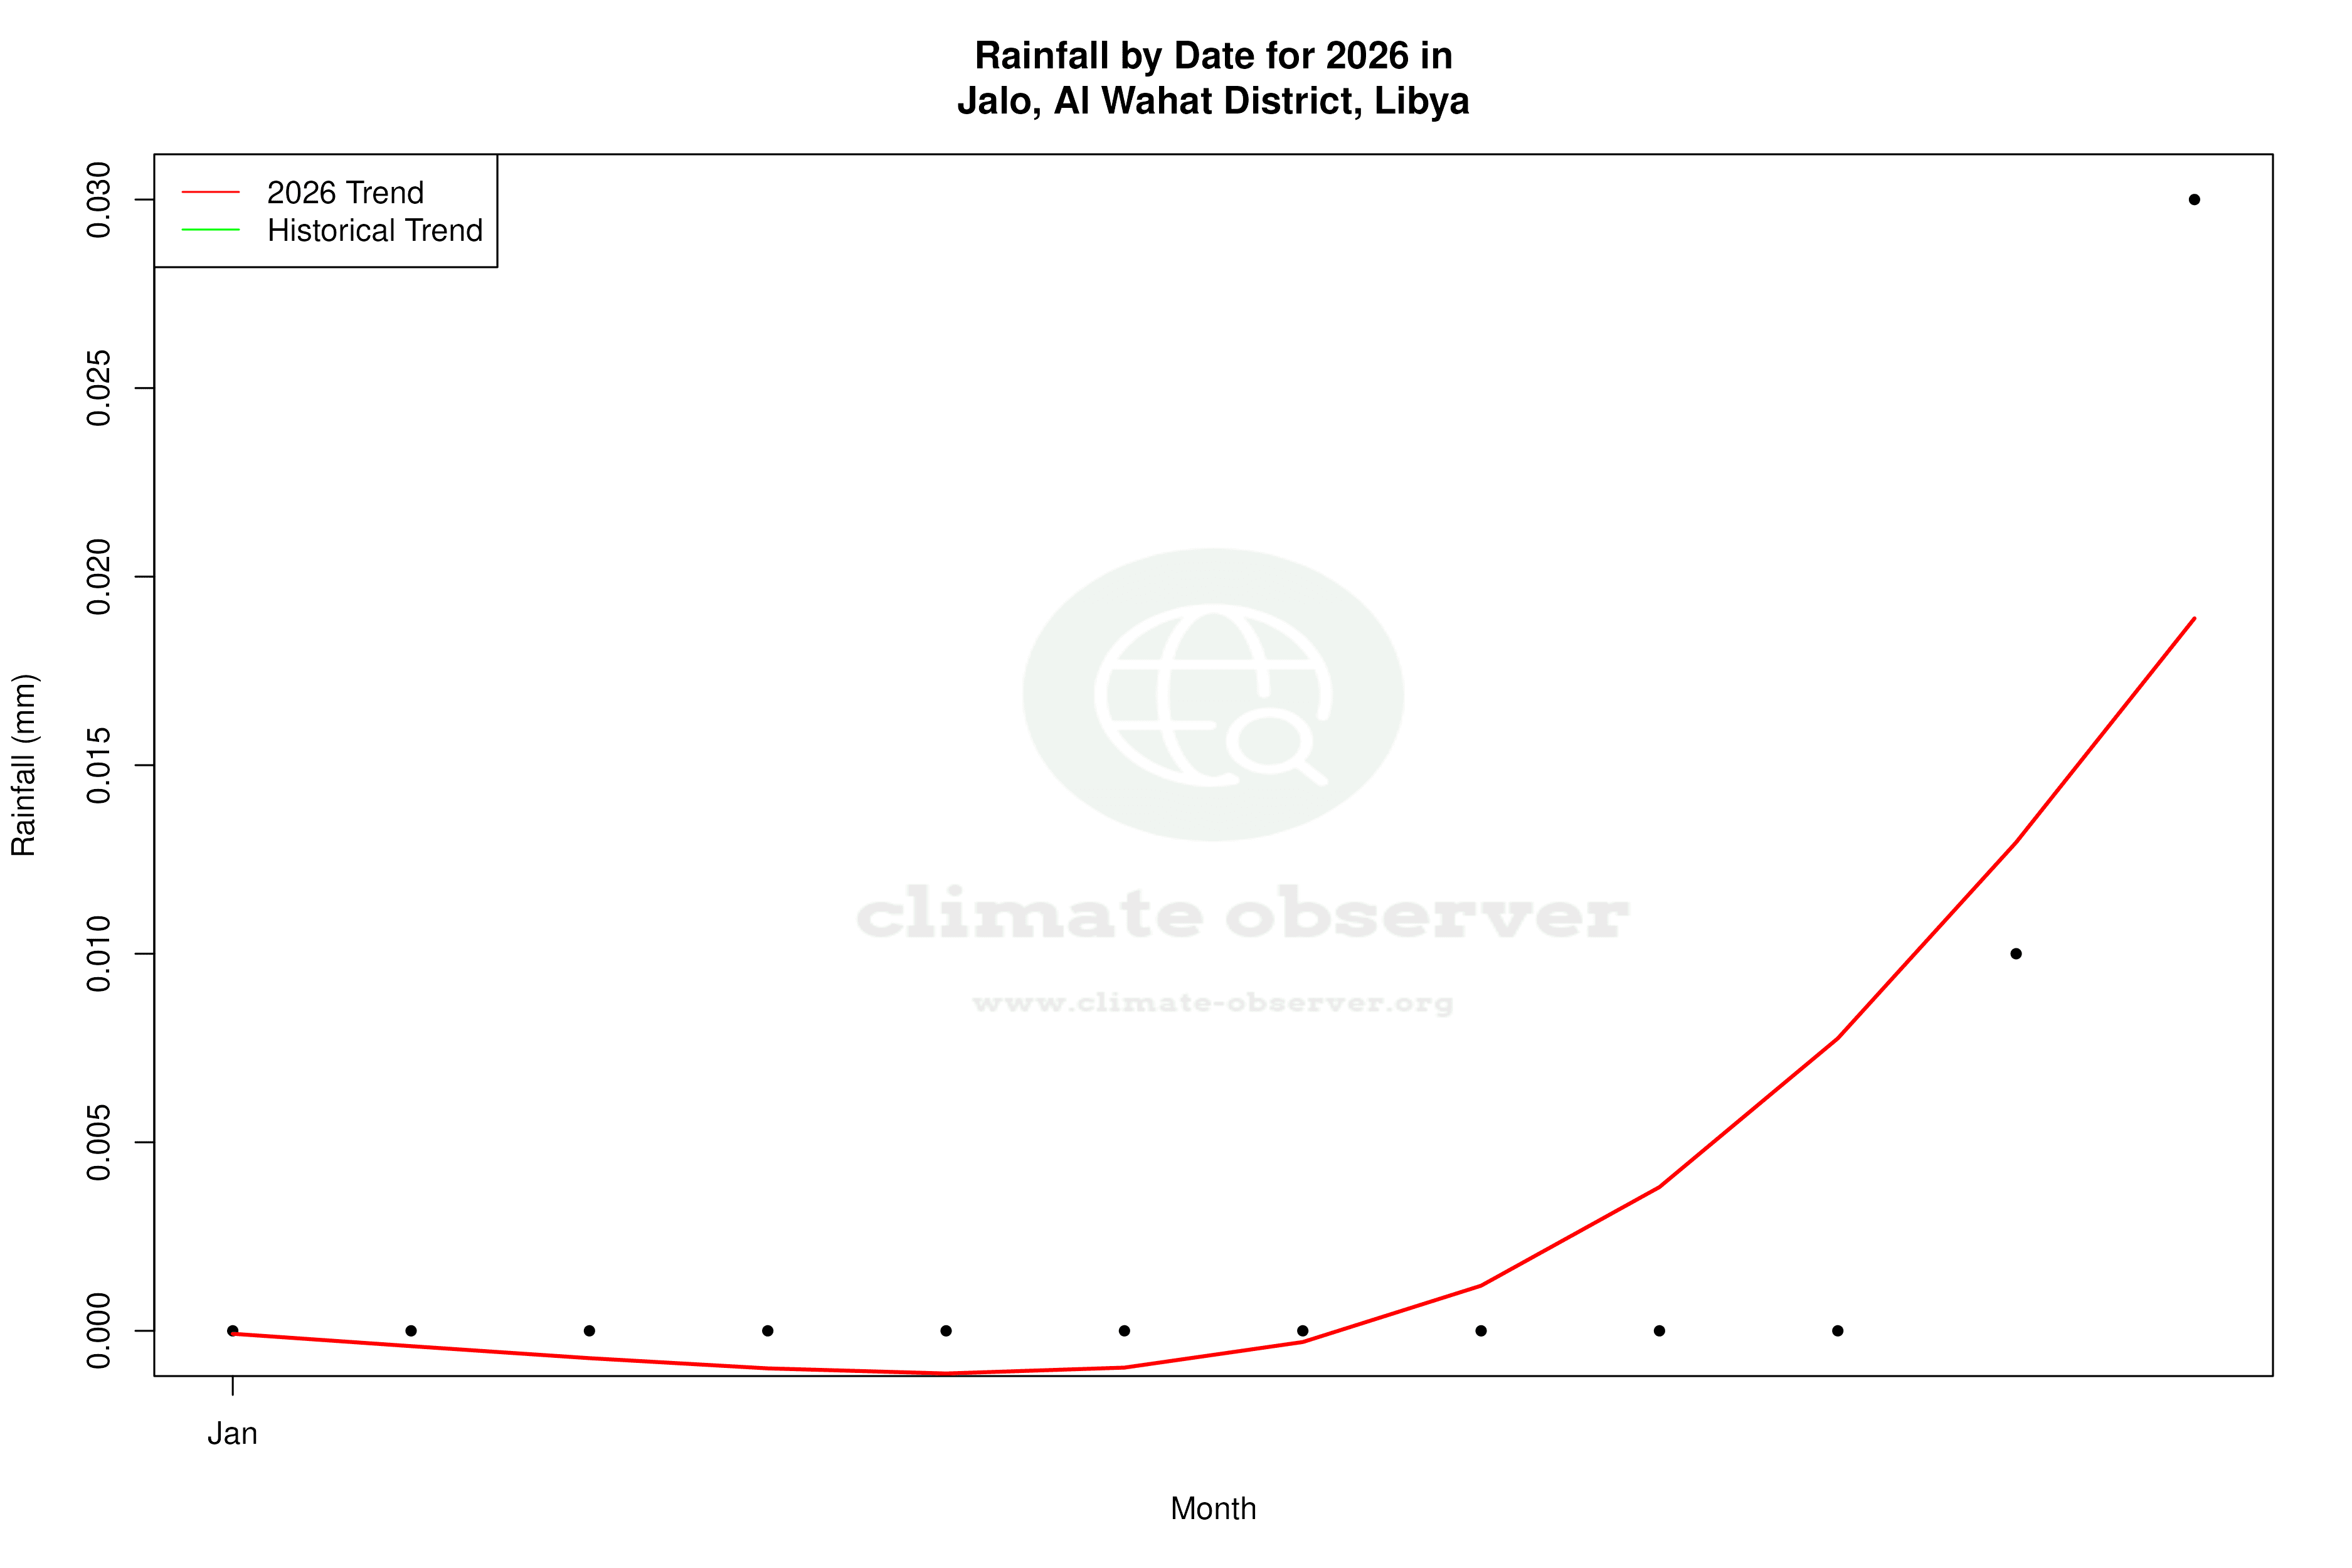


Max Temperature this Year | 1 of 6
Climate 12-Month Moving Averages
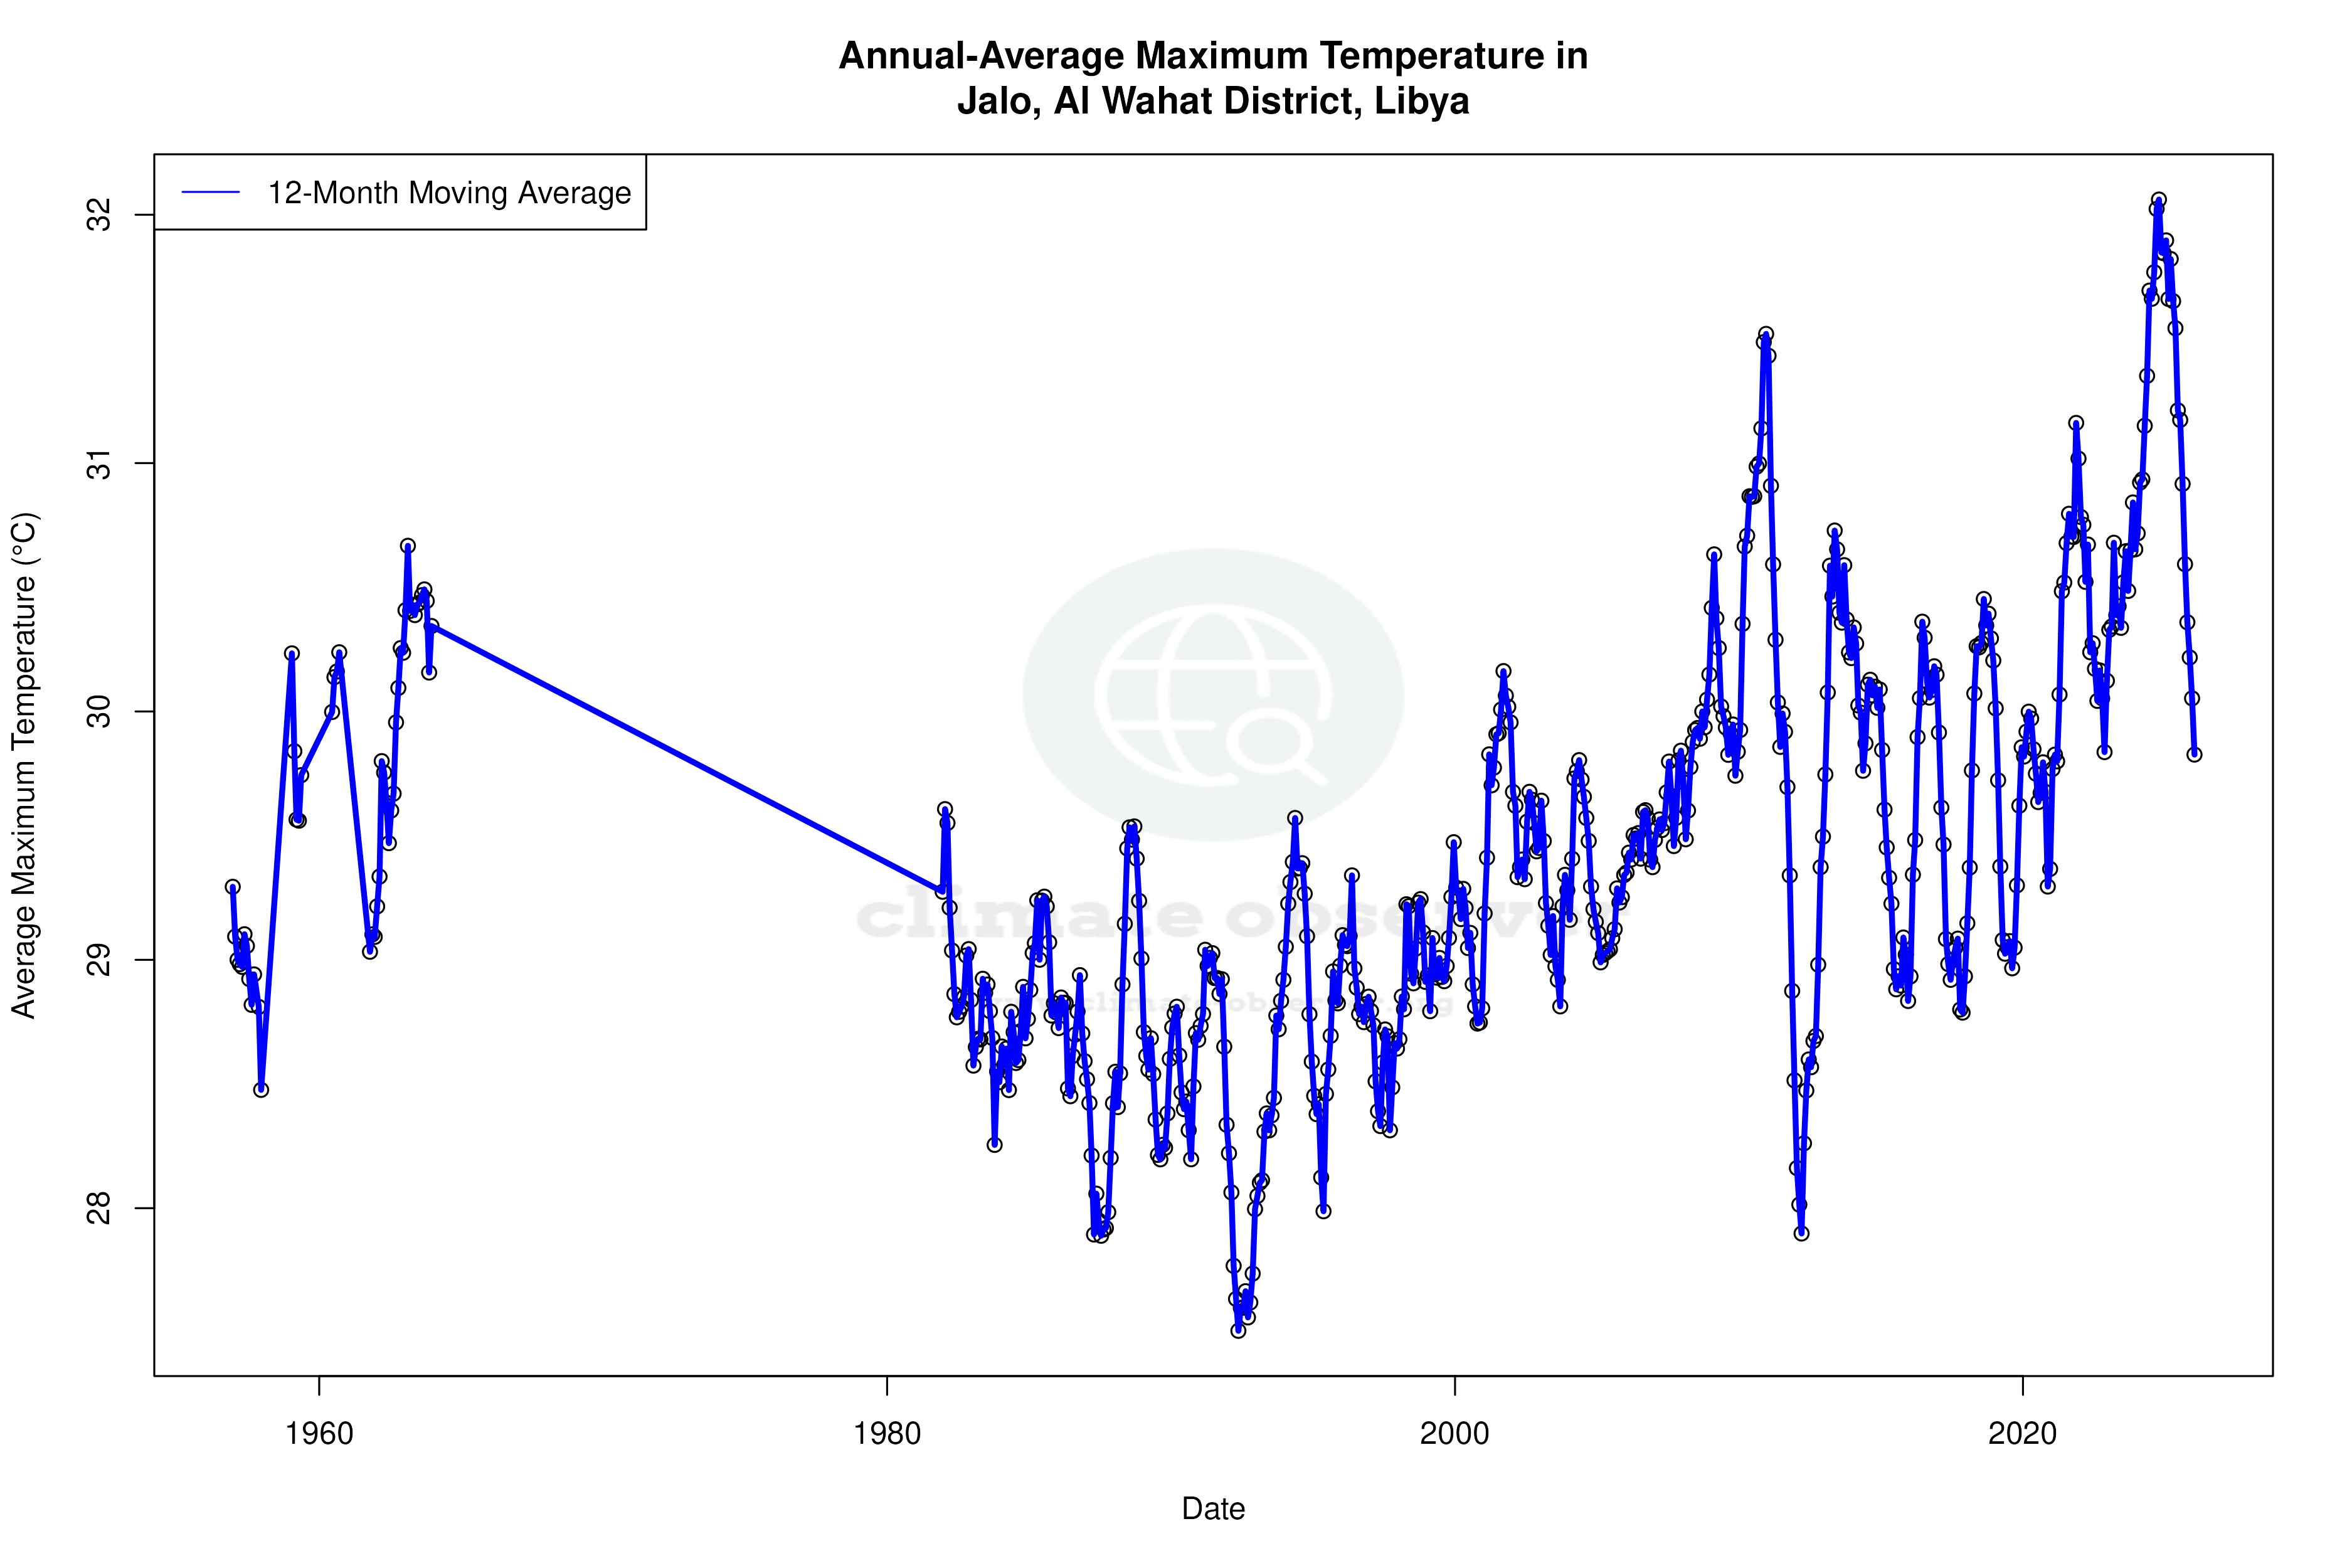
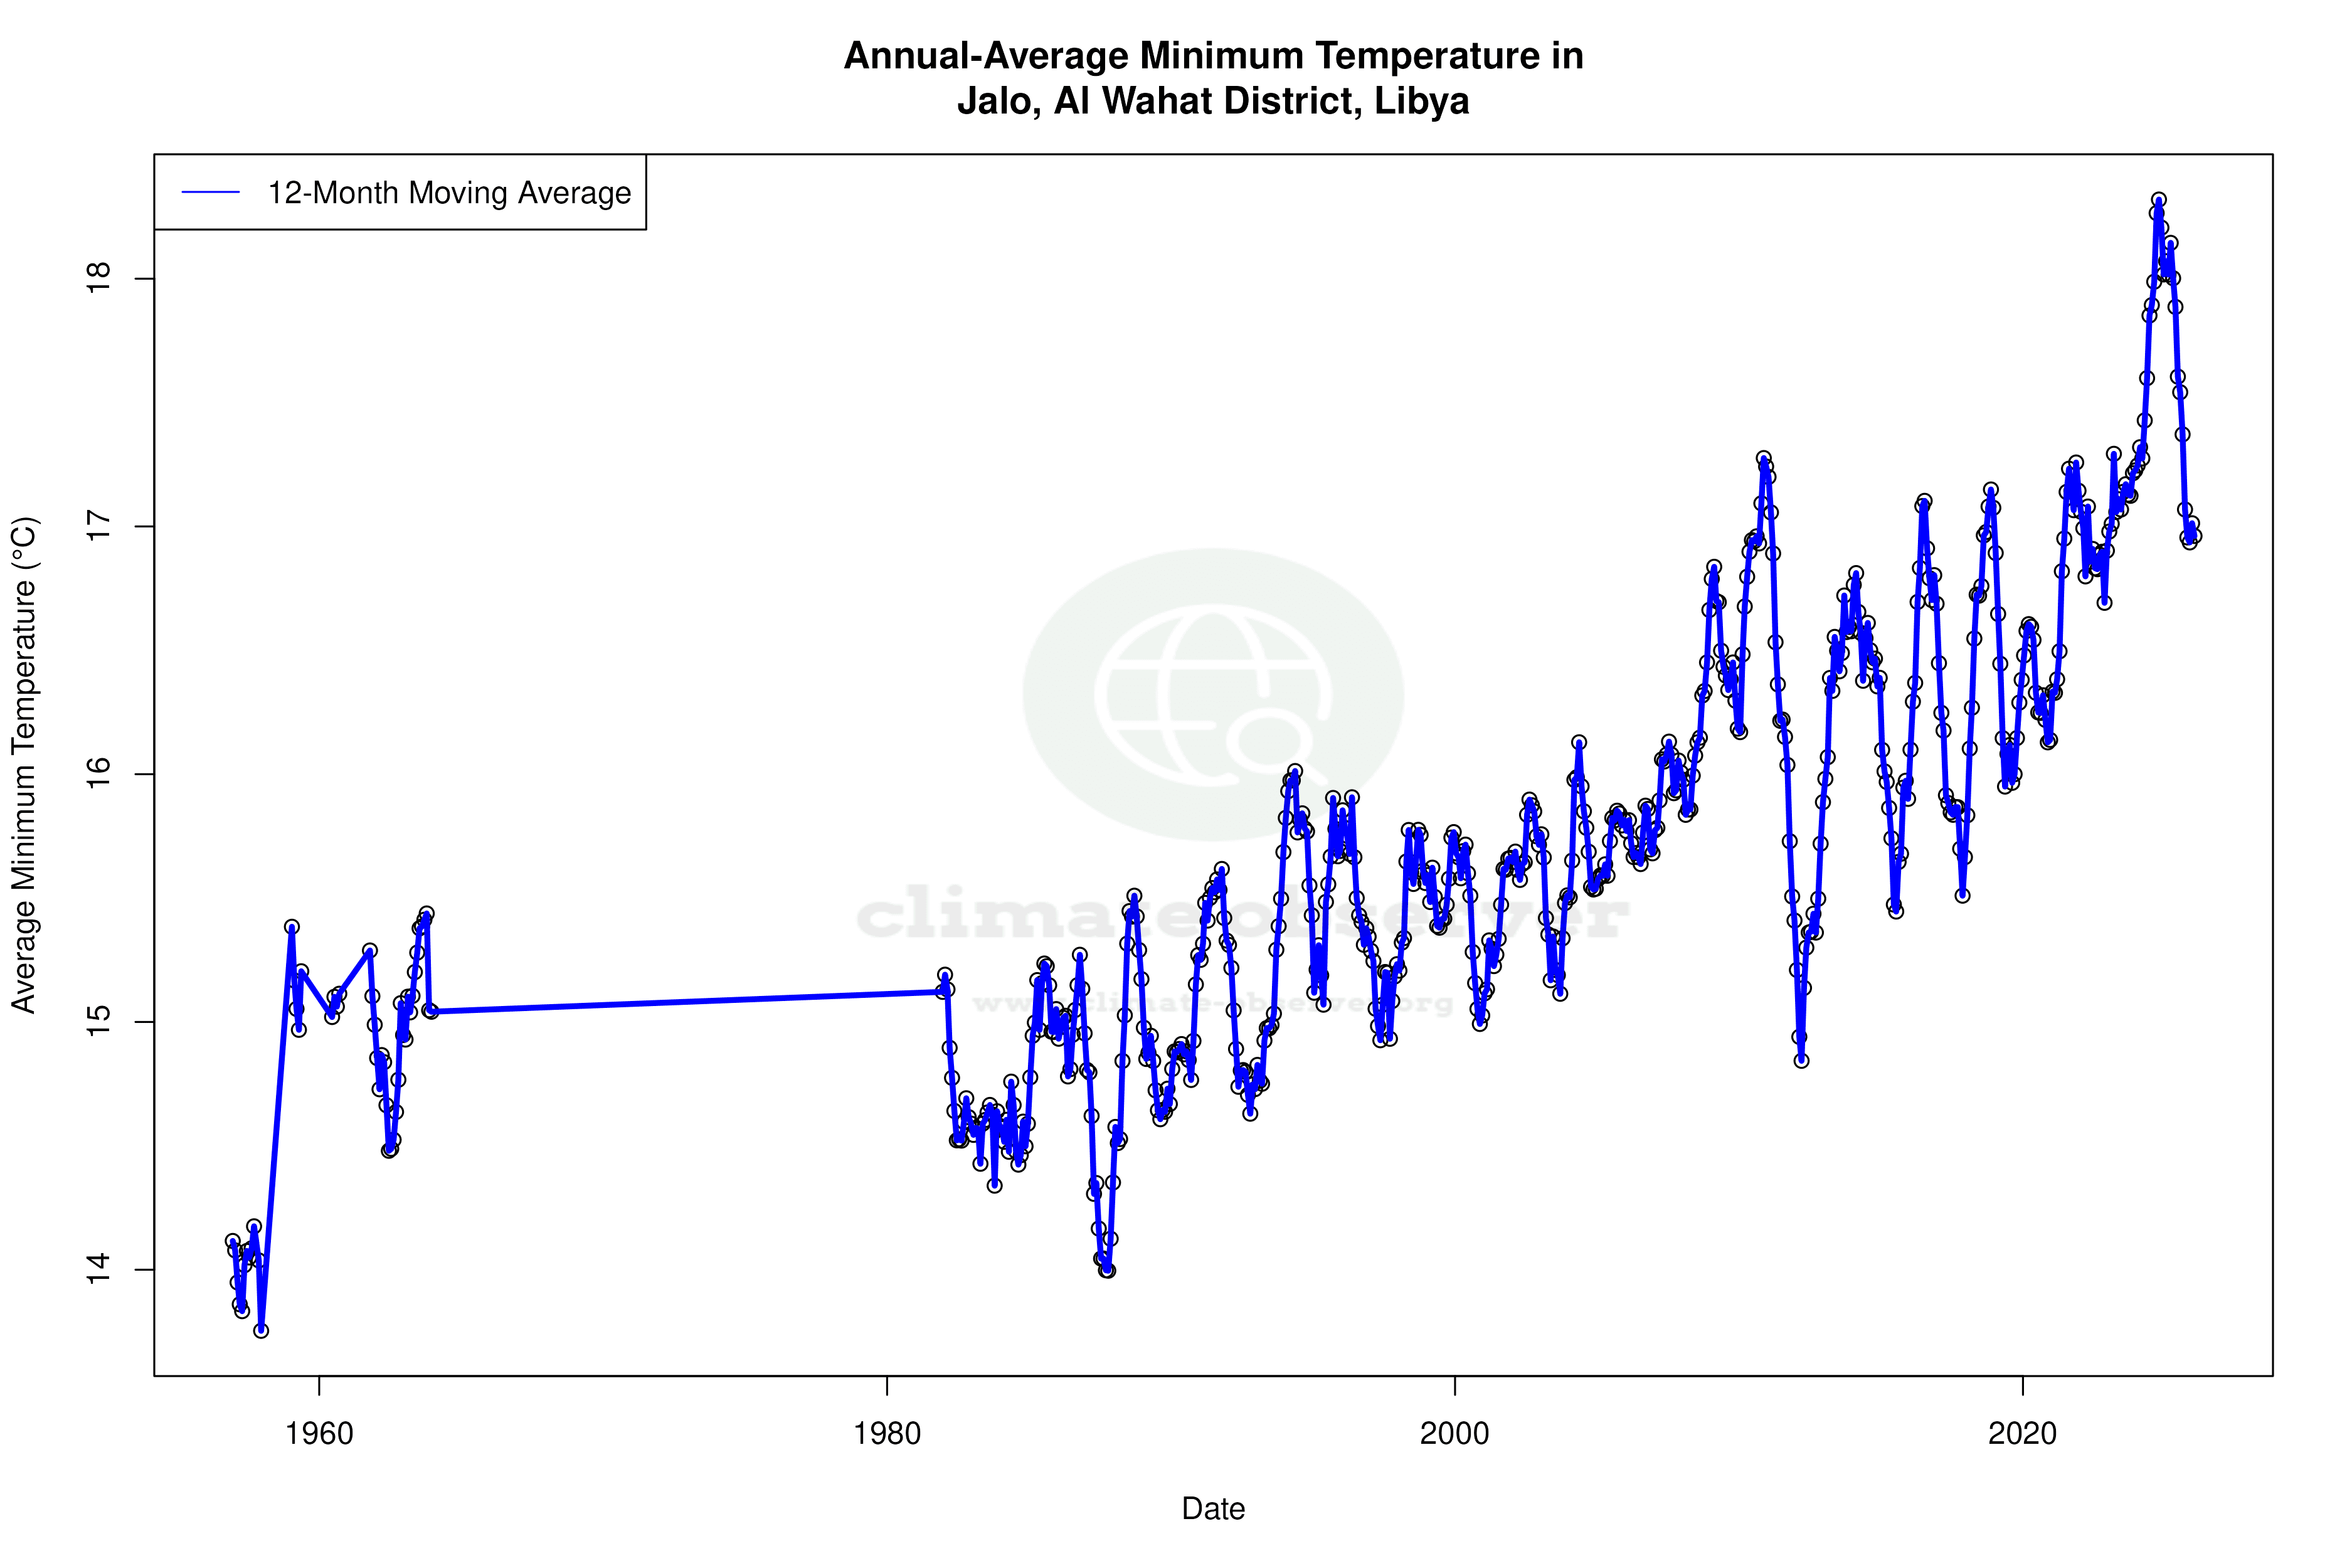
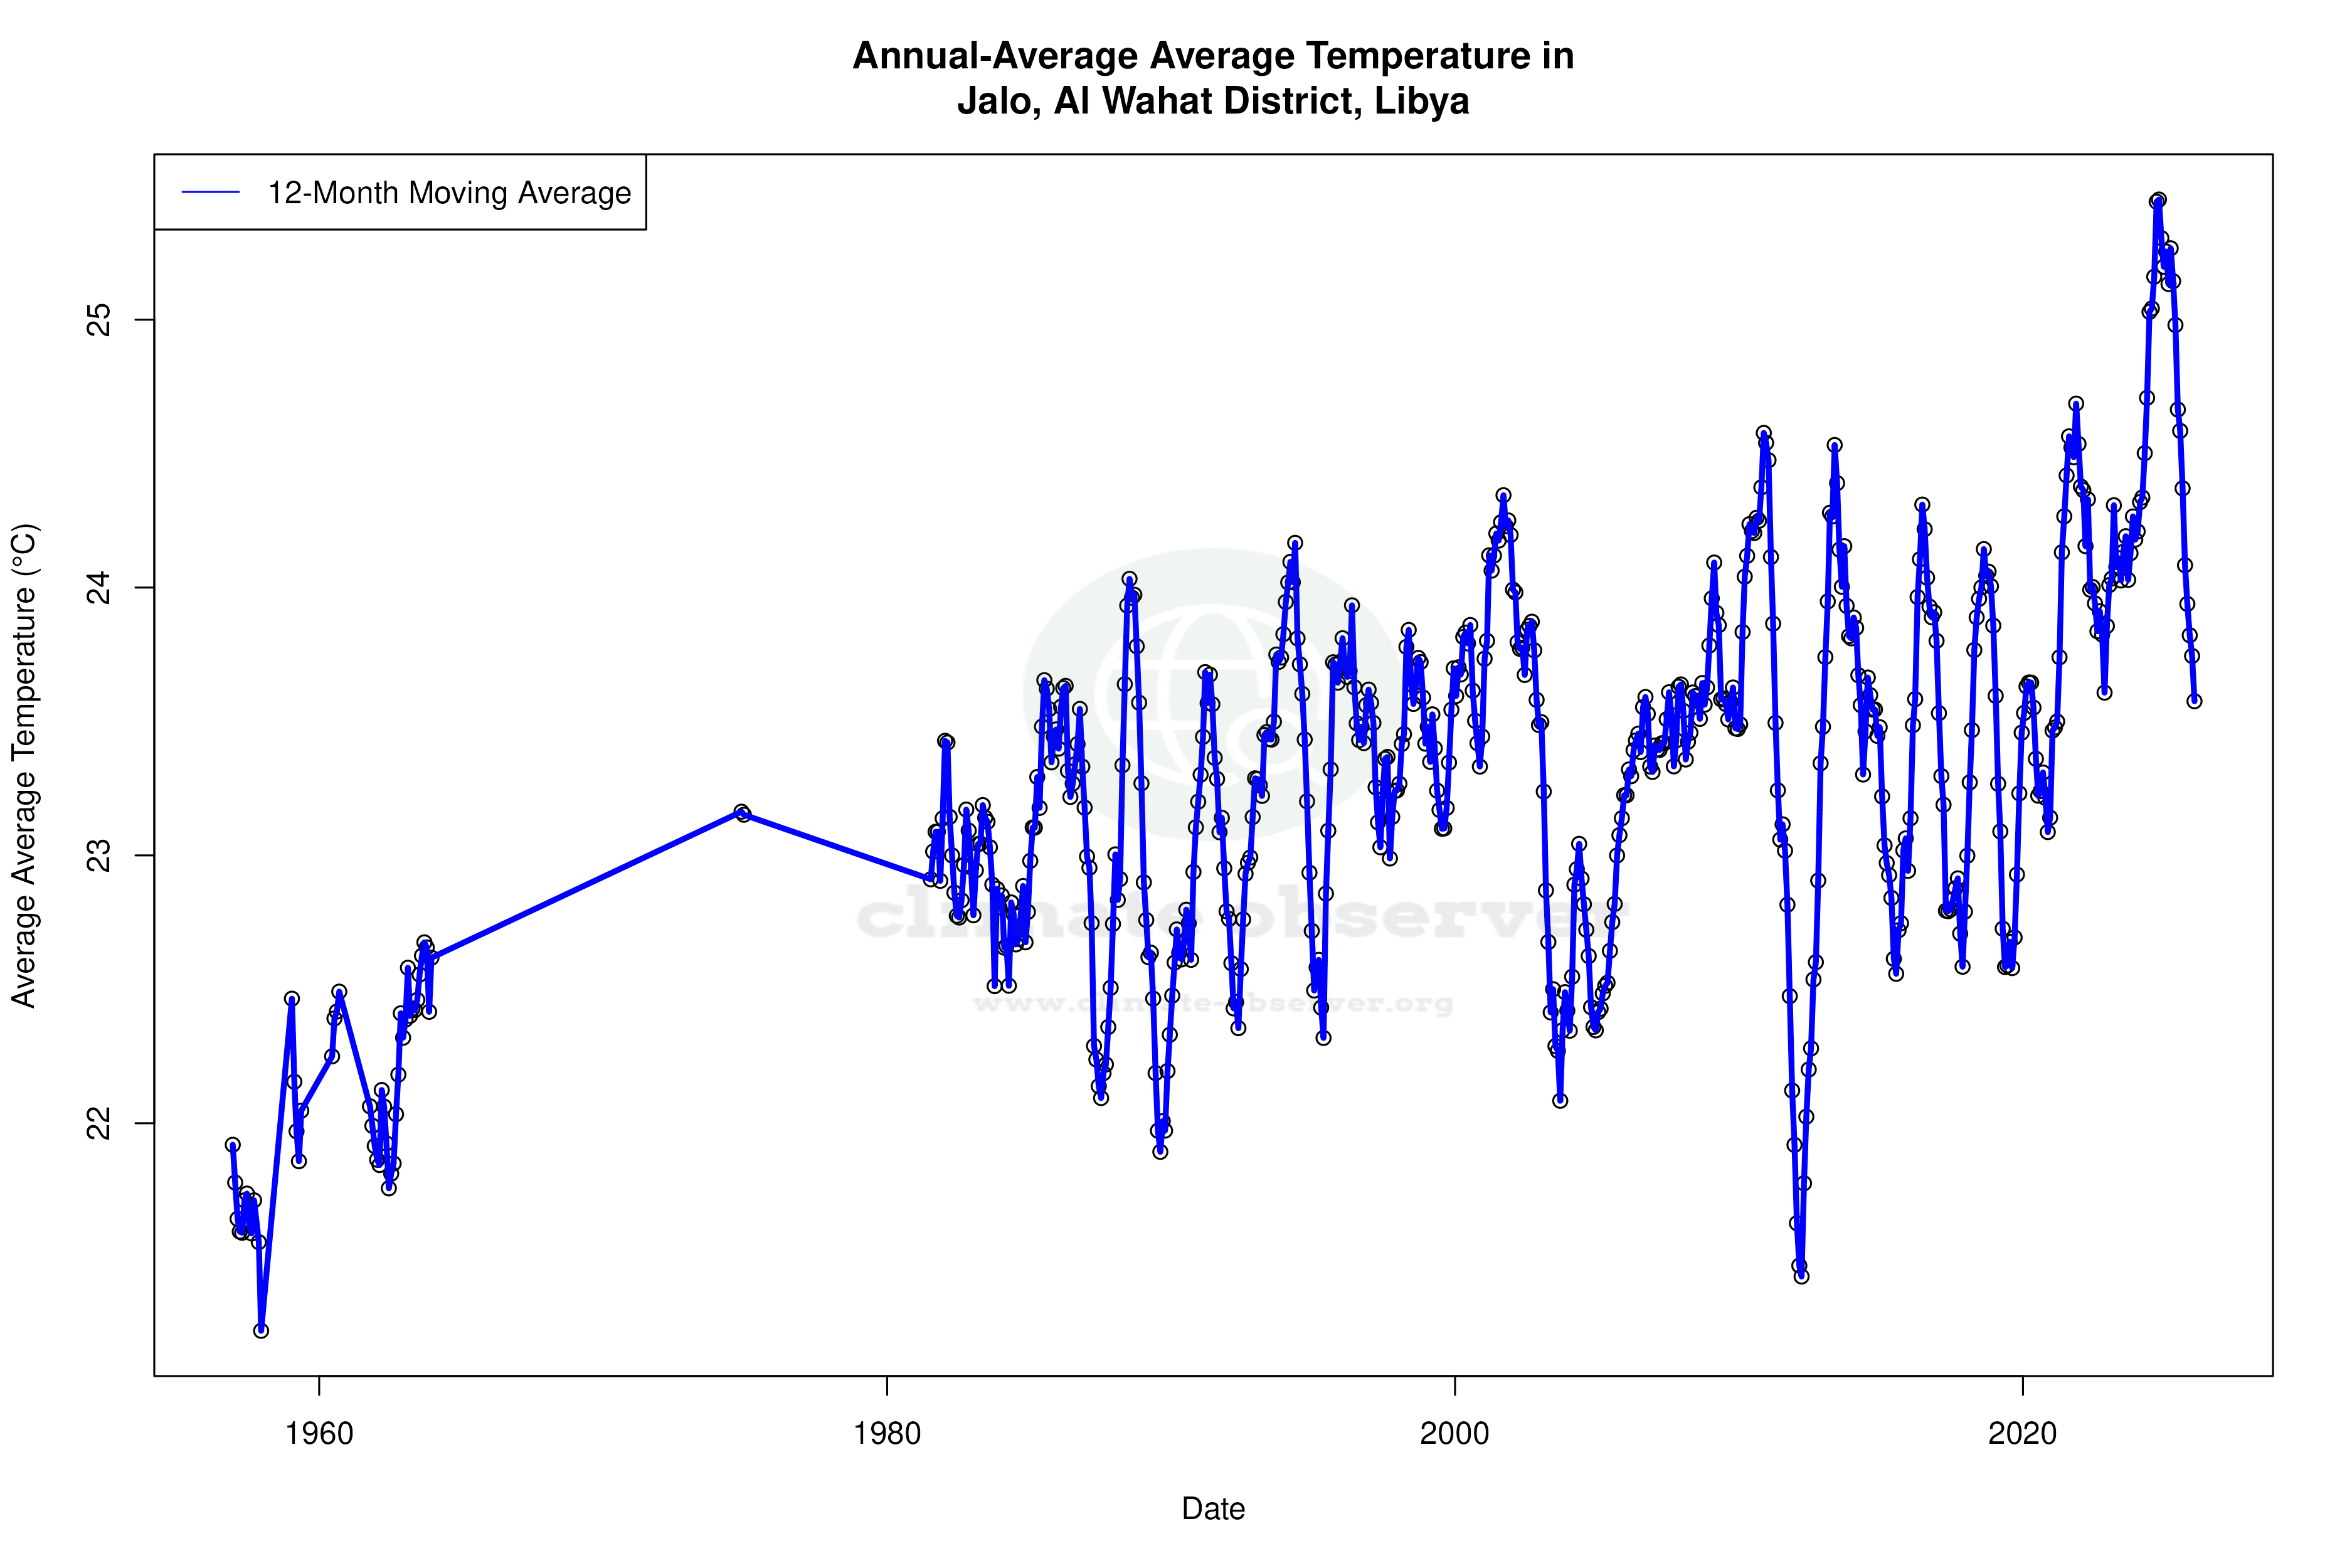


Max Temperature 12-Month MA | 1 of 6
Daily Data Points and Averages Throughout the Year


Average Max Temperature Throughout Year | 1 of 5
