Climate for Station: Gighbub, Butnan District, Libya
Loading live weather...
Climate Analysis & Overview
The climate of الجغبوب, located in the البطنان region of Libya, is experiencing a notable warming trend, with recent years showing a significant increase in temperature highs and lows. Precipitation patterns have become more concentrated, suggesting a shift towards fewer, more intense rainfall events. These changes align with broader regional climate goals to understand and adapt to evolving weather patterns.
Desert Climate Dynamics
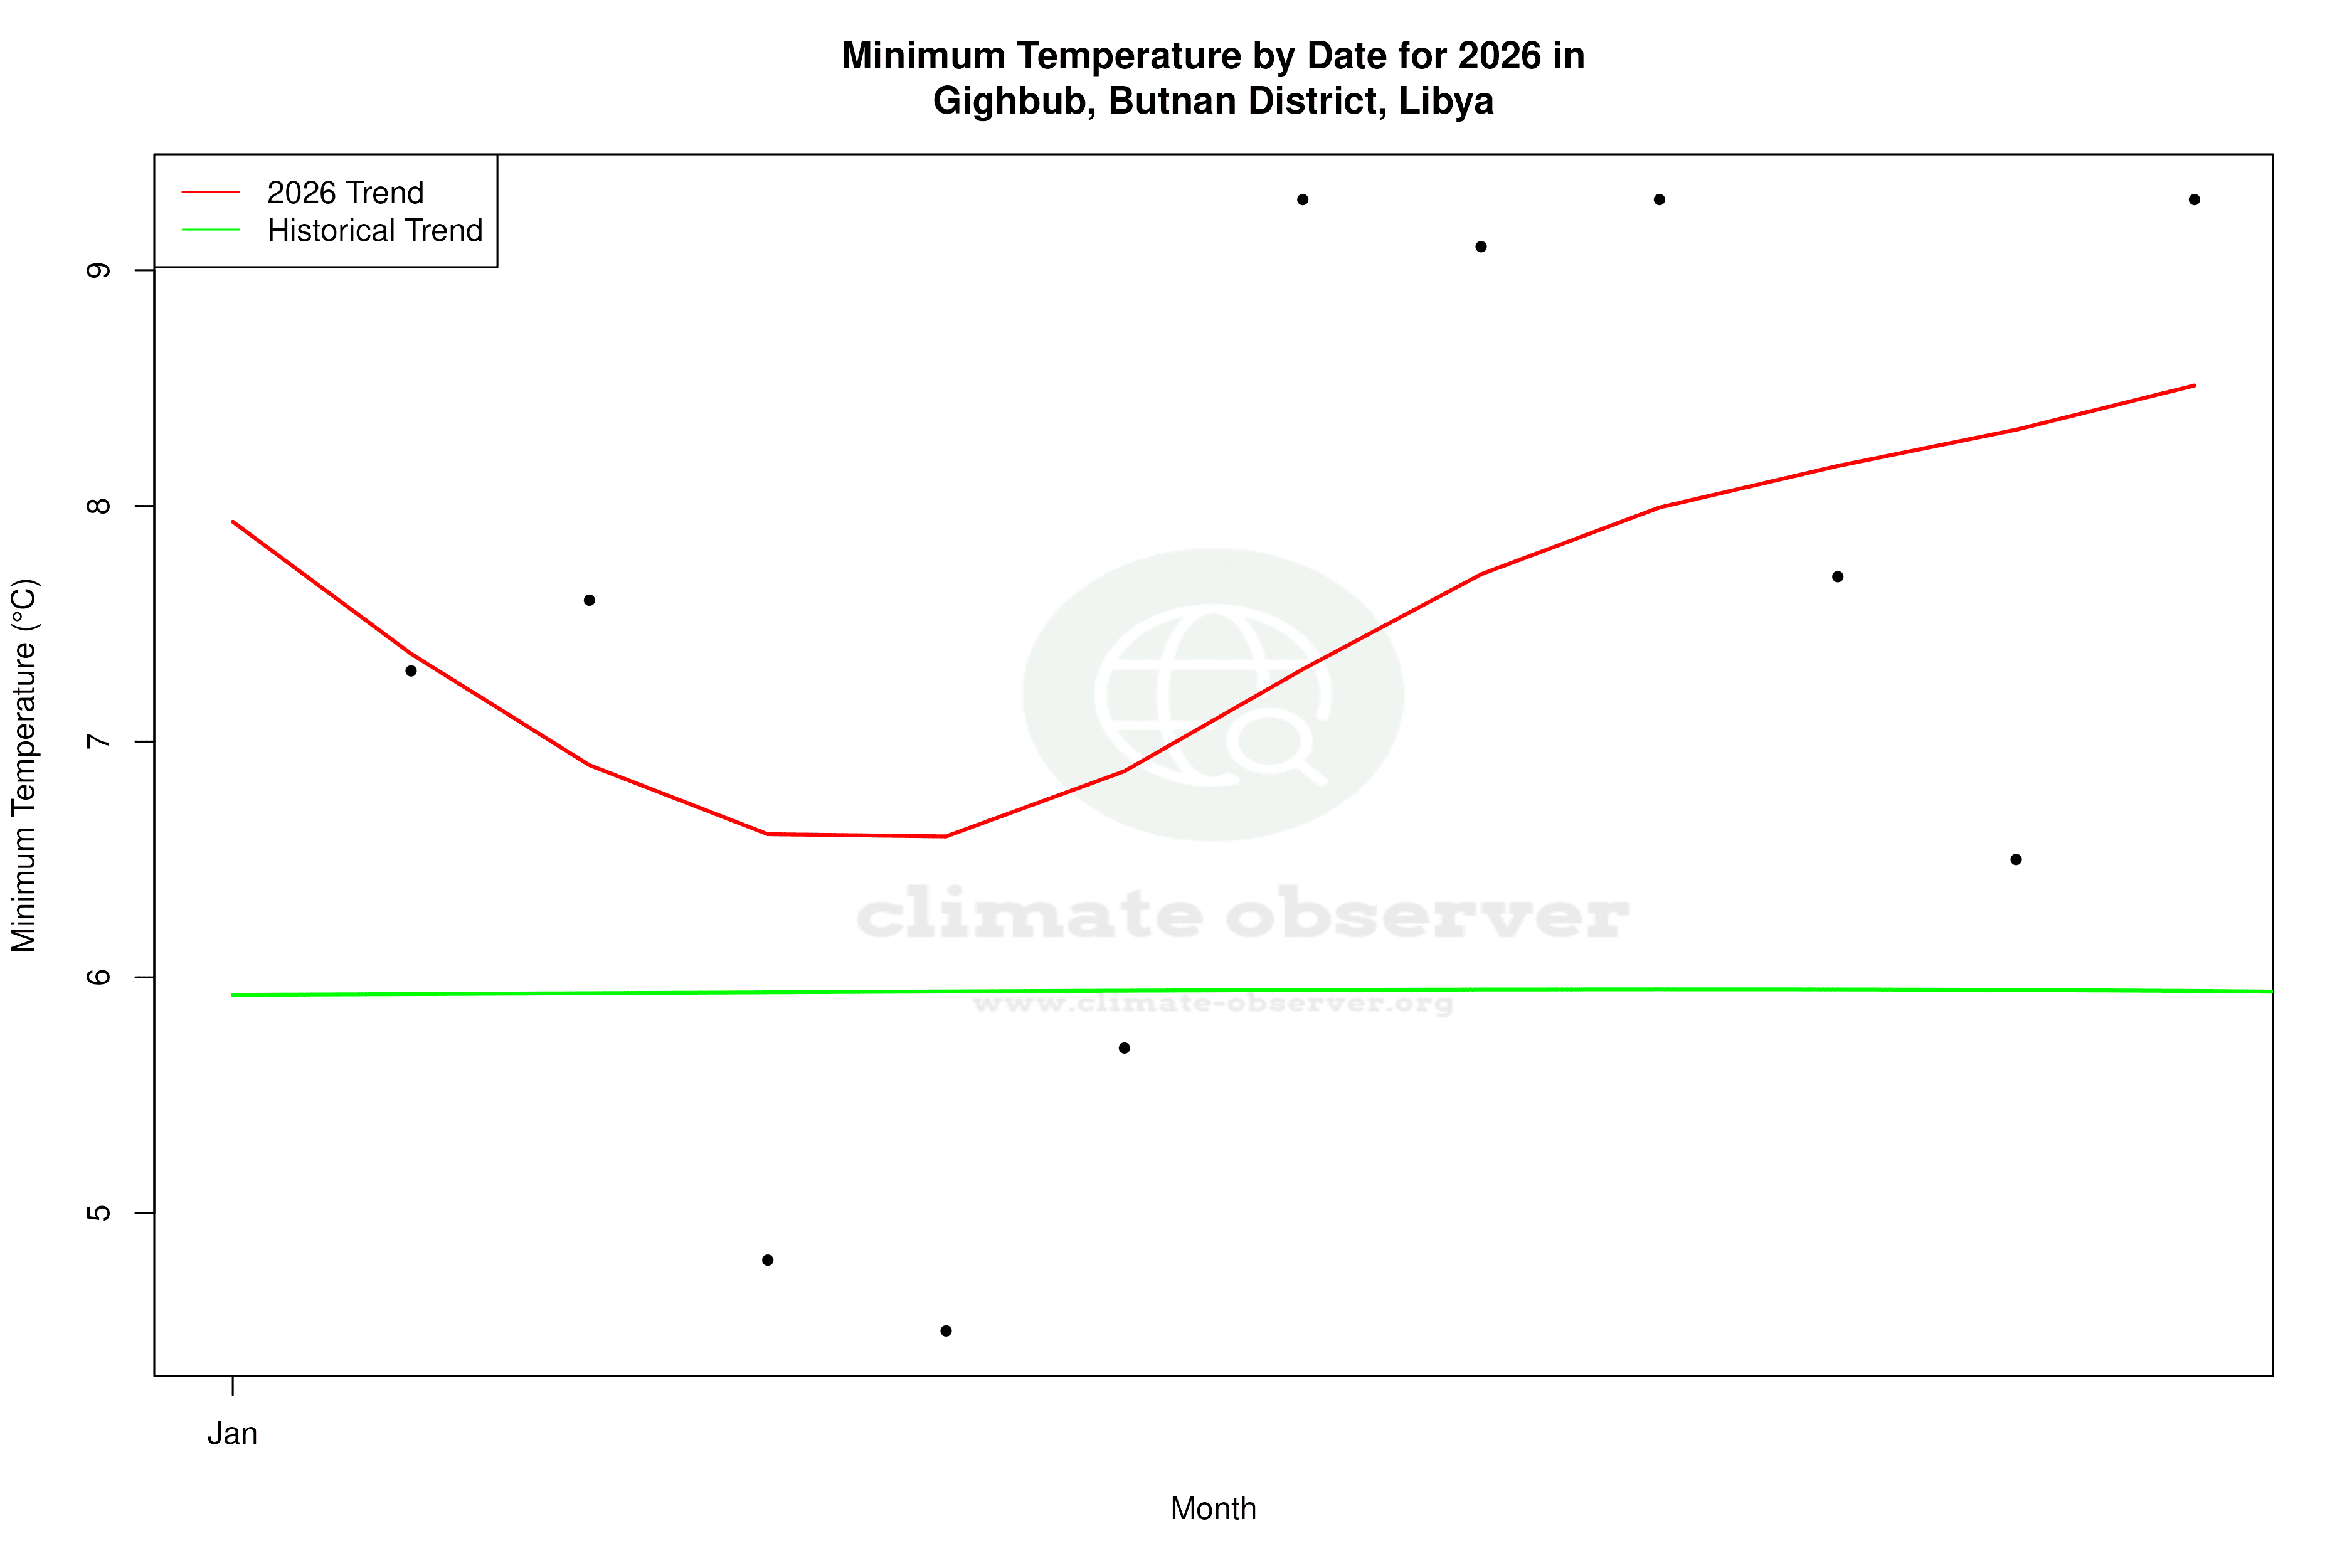
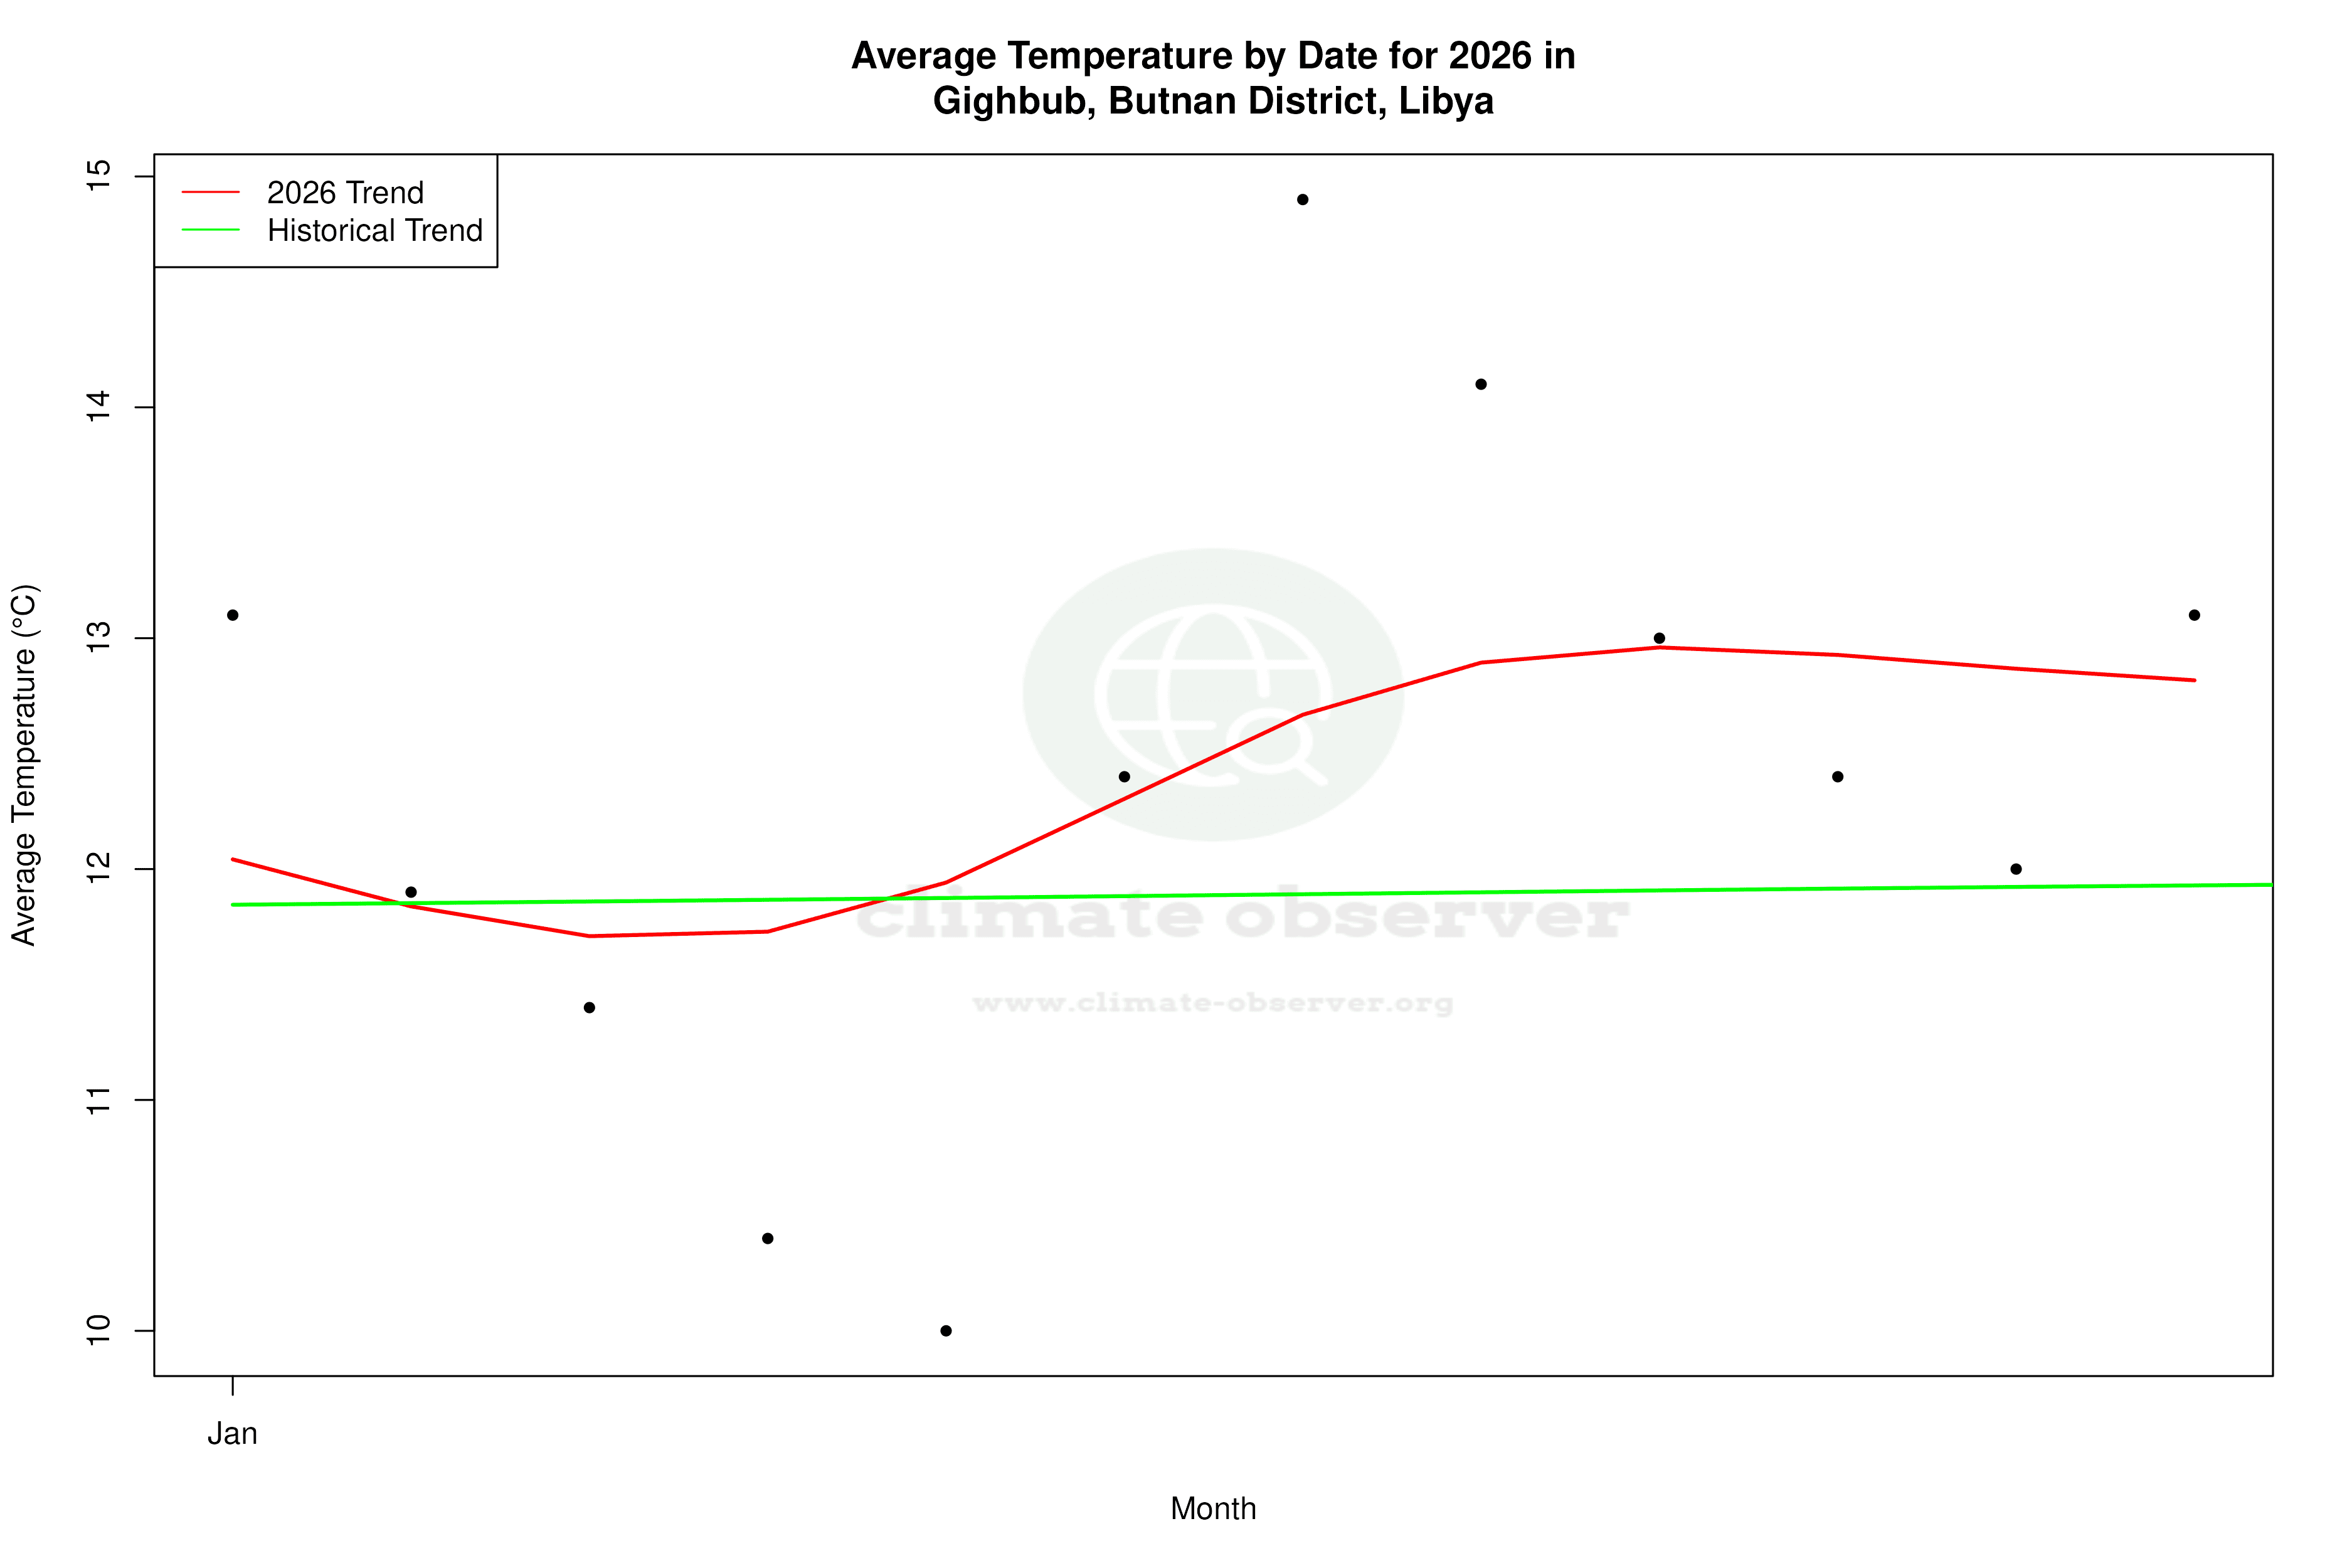
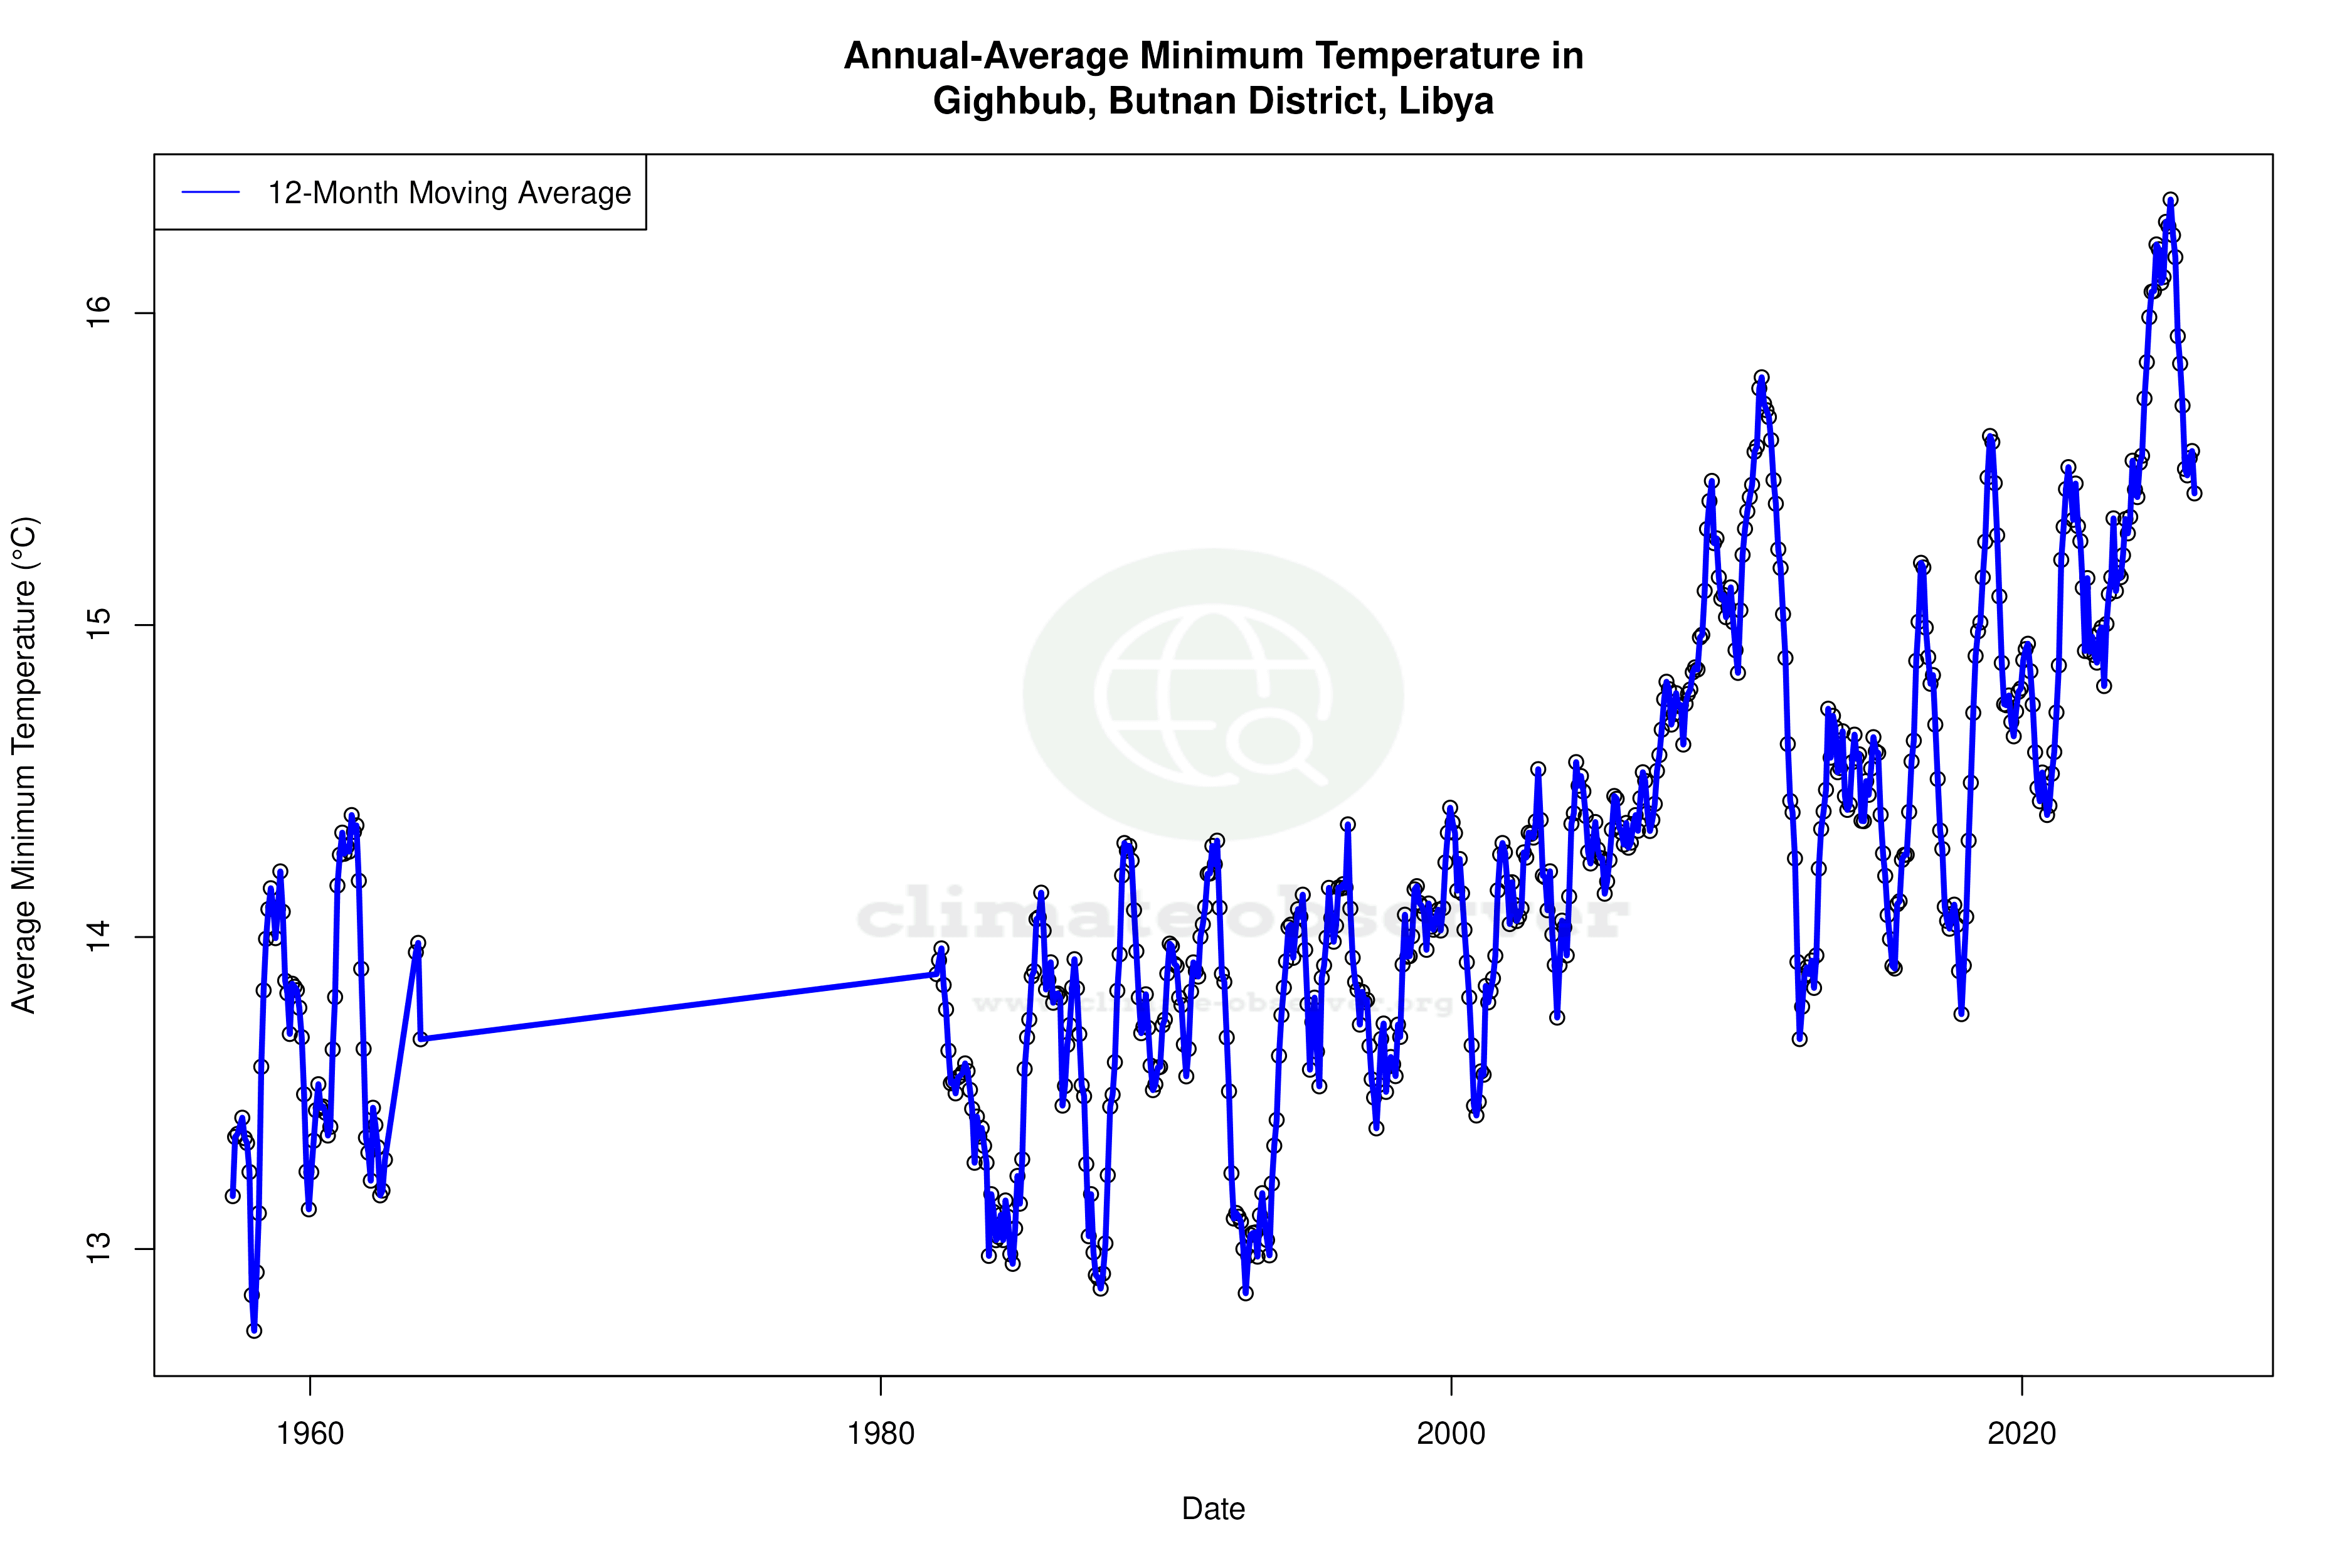
الجغبوب is situated within the Sahara Desert, characterised by an arid climate under the Köppen classification BWh. This region is marked by extreme temperature variations and minimal precipitation. The geographic location, far from any significant bodies of water or mountain ranges, contributes to its dry conditions and high thermal amplitude. The all-time temperature trends indicate a warming of 0.09°C (0.16°F) for highs and 0.27°C (0.48°F) for lows, suggesting a gradual increase in baseline temperatures over the years.
Recent Temperature Escalations
In the past decade, الجغبوب has experienced a more pronounced warming trend, with highs increasing by 1.87°C (3.37°F) and lows by 1.48°C (2.66°F). These figures highlight a significant deviation from the long-term trends, indicating an accelerated warming period. This recent uptick in temperatures could be attributed to regional climate changes and human activities that contribute to global warming. The station's record high of 47.9°C (118.2°F) and a record low of -2.0°C (28.4°F) underscore the extreme temperature range typical of desert climates.
Precipitation Patterns: A Concentrated Shift
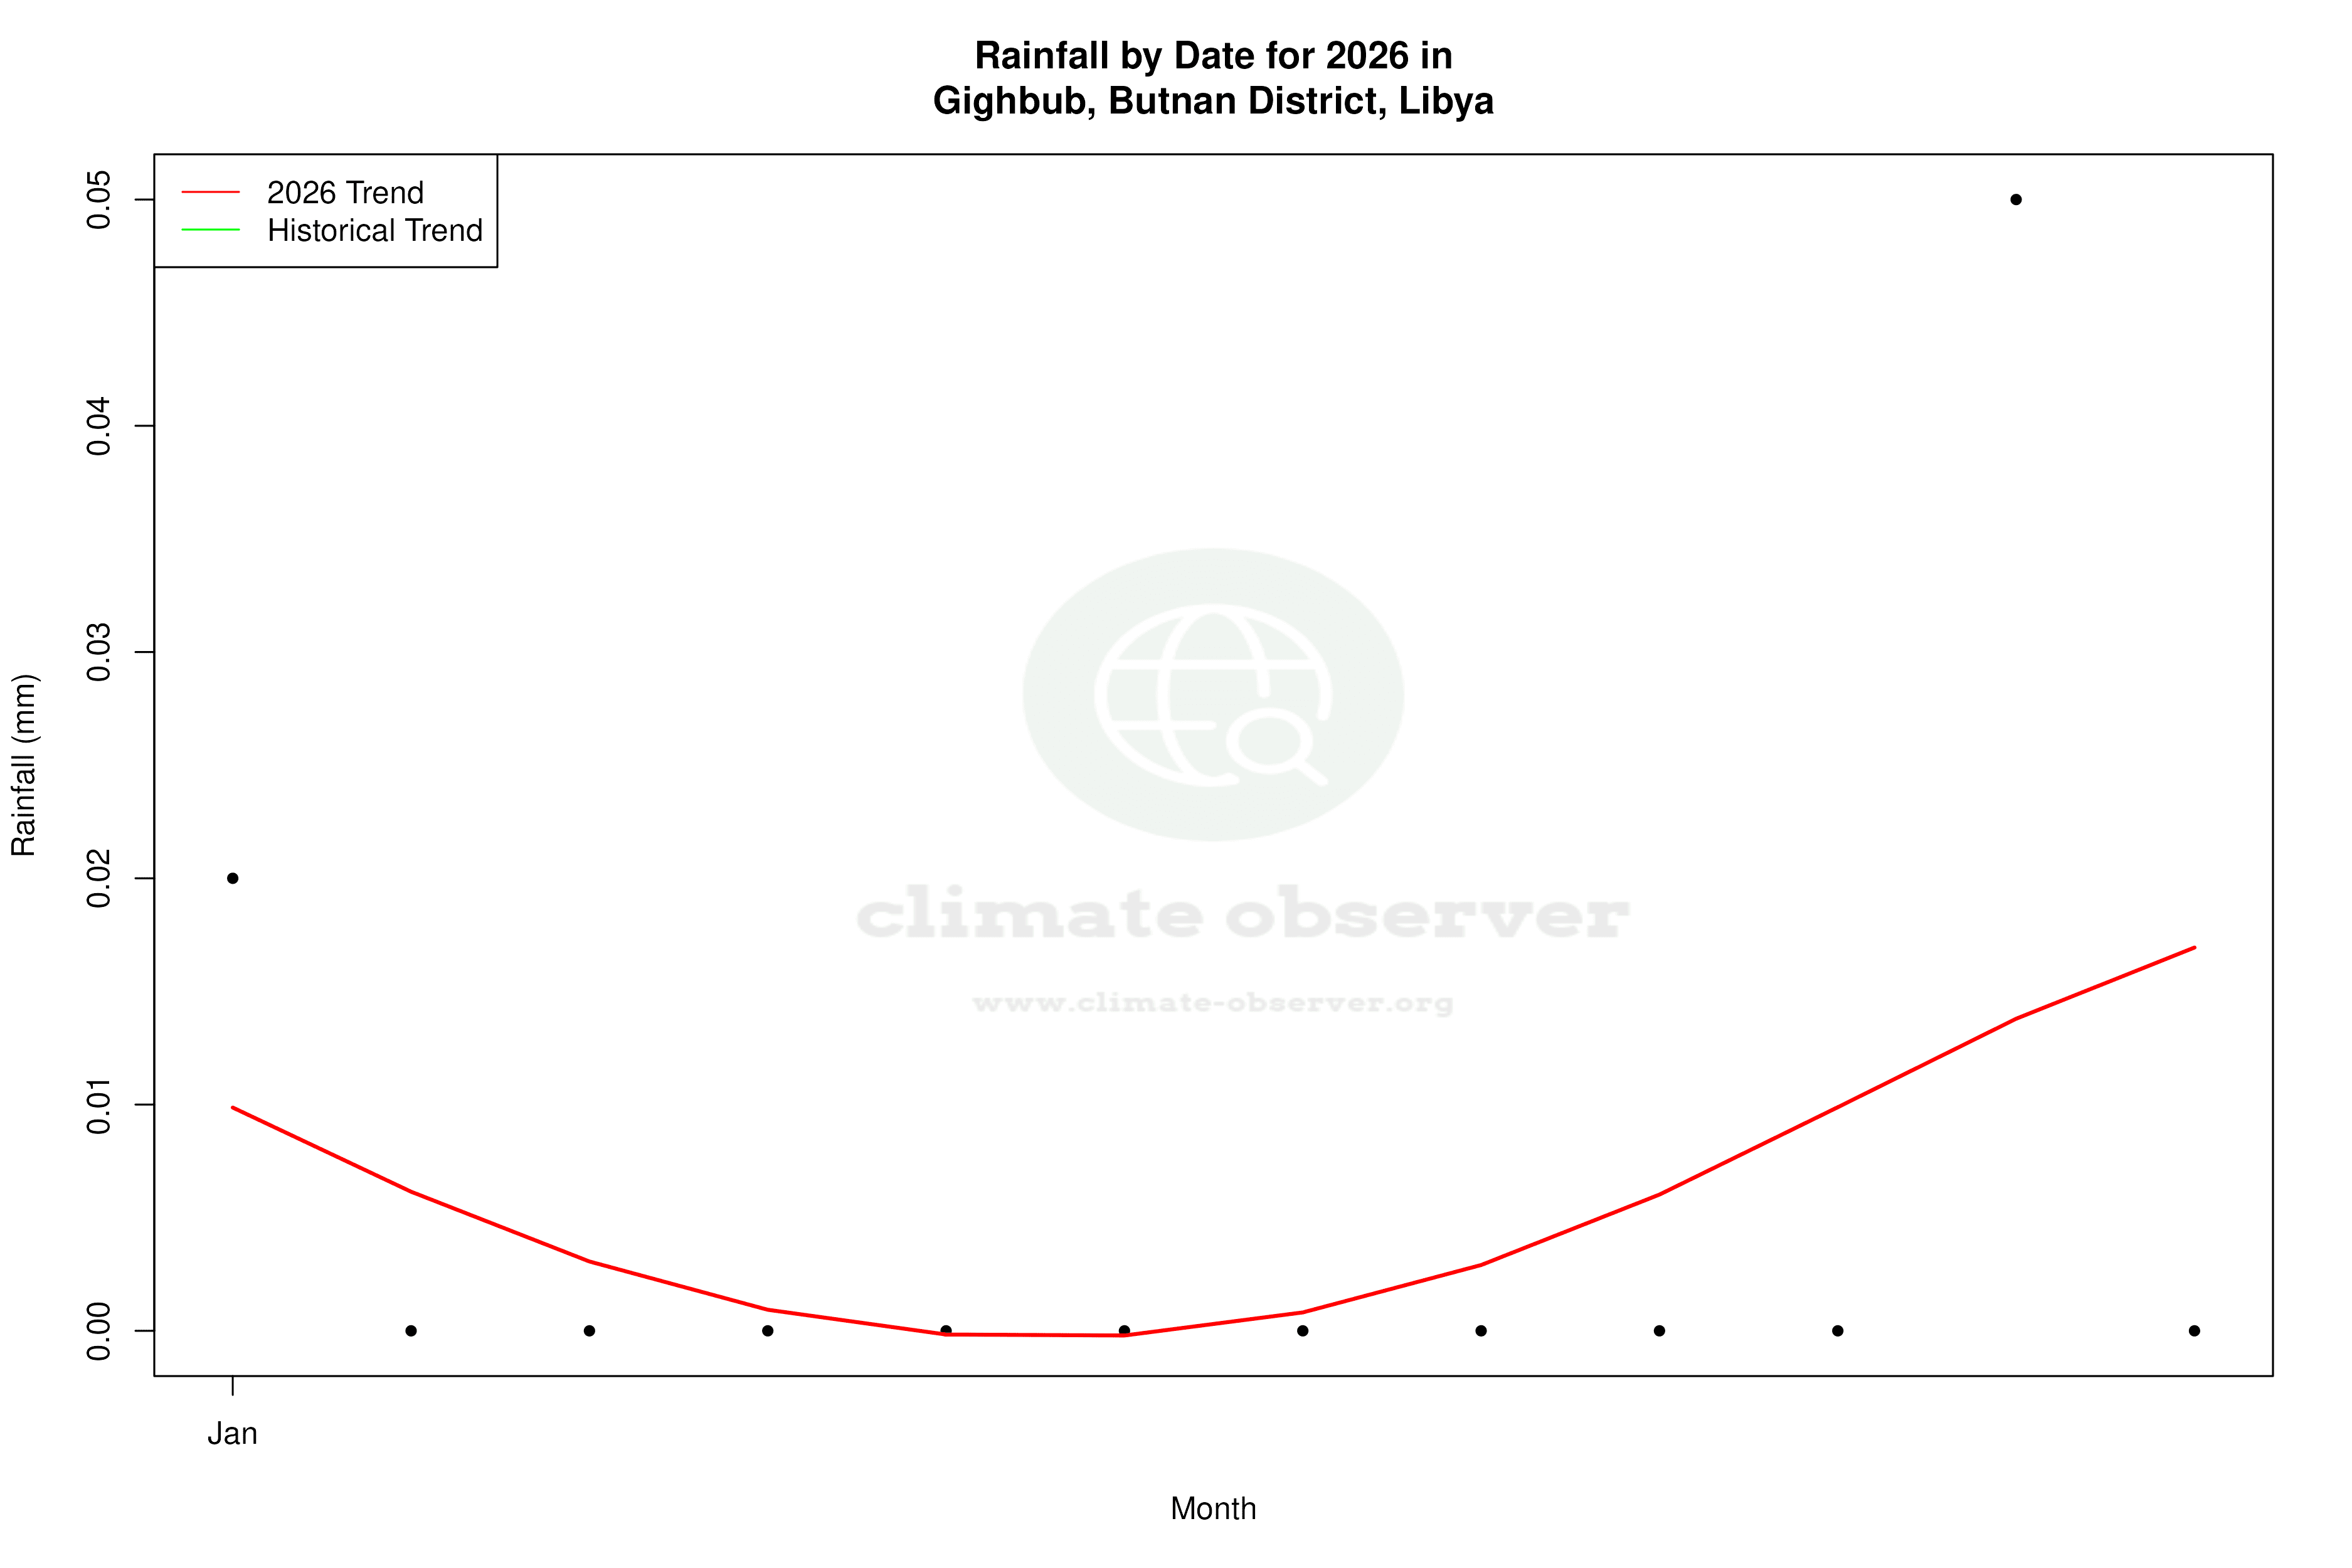
The Precipitation Concentration Index (PCI) for الجغبوب has risen from a baseline of 29.6 to a current value of 54.2. This significant increase suggests that rainfall is now more concentrated in fewer events, leading to periods of intense precipitation followed by extended dry spells. Such concentrated rainfall can have profound implications for water management and agriculture, necessitating adaptive strategies to mitigate potential impacts.
Implications for Regional Climate Goals
Libya's regional climate goals focus on understanding and adapting to climate variability to ensure sustainable development. The warming trends and altered precipitation patterns observed in الجغبوب are critical data points for policymakers and researchers. These trends not only reflect local changes but also contribute to the broader understanding of climate dynamics in the Sahara region. As Libya continues to navigate its climate strategy, insights from stations like الجغبوب will be invaluable in shaping adaptive responses and resilience-building measures.
Station Statistics
10-Year Trend
High: +1.43 °F/decade
Low: +1.04 °F/decade
Rain: -0.009 in/decade
25-Year Trend
High: +0.58 °F/decade
Low: +0.91 °F/decade
Rain: +0.001 in/decade
50-Year Trend
High: +0.54 °F/decade
Low: +0.83 °F/decade
Rain: -0.000 in/decade
All-Time Trend
High: +0.18 °F/decade
Low: +0.47 °F/decade
Rain: +0.000 in/decade
Percentage Above-Average Days
Last 12 Months: 48.2%
This Year: 49.3%
Precipitation Concentration Index (PCI) ℹ️
Last 12 Months: 47.2
Historical Average: 30.9
Percentile Rank of Last 12 Months ℹ️
High: 78th percentile
Low: 91st percentile
Rain: 7th percentile
Change in Variance ℹ️
High: -0.7%
Low: +7.3%
Intraday: -18.5%
Data Coverage
78.8%
First Year of Data
1956
Station Location
Historical Weather Records
| Max High | Avg High | Min High | Max Avg | Avg Avg | Min Avg | Max Low | Avg Low | Min Low | Max Precipitation | Avg Precipitation | Max Snow | Avg Snow | |
|---|---|---|---|---|---|---|---|---|---|---|---|---|---|
| Record | 118.22 °F | — | 48.97 °F | 108.32 °F | — | 40.46 °F | 84.20 °F | — | 28.40 °F | 2.27 in | — | — | — |
| January | 85.10 °F | 64.45 °F | 48.97 °F | 71.78 °F | 53.58 °F | 40.46 °F | 57.92 °F | 42.61 °F | 28.40 °F | 0.71 in | 0.01 in | — | — |
| February | 96.80 °F | 67.59 °F | 51.96 °F | 78.08 °F | 56.39 °F | 43.66 °F | 61.52 °F | 43.68 °F | 30.02 °F | 0.52 in | 0.01 in | — | — |
| March | 104.00 °F | 74.67 °F | 56.25 °F | 86.72 °F | 62.86 °F | 45.86 °F | 69.98 °F | 48.32 °F | 31.82 °F | 0.61 in | 0.00 in | — | — |
| April | 111.20 °F | 83.94 °F | 59.18 °F | 94.82 °F | 70.91 °F | 50.95 °F | 76.64 °F | 55.41 °F | 39.02 °F | 0.25 in | 0.00 in | — | — |
| May | 118.04 °F | 91.80 °F | 73.02 °F | 107.78 °F | 78.74 °F | 60.48 °F | 84.20 °F | 62.73 °F | 48.04 °F | 1.99 in | 0.00 in | — | — |
| June | 118.22 °F | 98.12 °F | 82.22 °F | 108.32 °F | 84.78 °F | 71.24 °F | 83.84 °F | 68.15 °F | 50.00 °F | 0.08 in | 0.00 in | — | — |
| July | 113.90 °F | 99.64 °F | 87.08 °F | 107.06 °F | 86.60 °F | 75.56 °F | 81.86 °F | 70.34 °F | 60.80 °F | 0.00 in | 0.00 in | — | — |
| August | 113.00 °F | 98.99 °F | 90.00 °F | 106.52 °F | 86.41 °F | 71.60 °F | 81.32 °F | 71.14 °F | 62.60 °F | 0.04 in | 0.00 in | — | — |
| September | 112.10 °F | 94.32 °F | 80.35 °F | 103.82 °F | 82.20 °F | 68.72 °F | 81.50 °F | 68.15 °F | 51.80 °F | 0.51 in | 0.00 in | — | — |
| October | 106.70 °F | 85.94 °F | 69.44 °F | 94.82 °F | 74.58 °F | 60.10 °F | 77.90 °F | 61.67 °F | 46.04 °F | 1.26 in | 0.00 in | — | — |
| November | 96.80 °F | 75.65 °F | 60.60 °F | 84.20 °F | 64.63 °F | 50.34 °F | 69.80 °F | 52.88 °F | 33.98 °F | 1.21 in | 0.01 in | — | — |
| December | 85.28 °F | 66.88 °F | 51.89 °F | 72.68 °F | 56.16 °F | 45.37 °F | 60.44 °F | 45.28 °F | 30.20 °F | 2.27 in | 0.01 in | — | — |
Data Visualisations
Remove WatermarksCurrent Year Climate Trends vs Historical


Max Temperature this Year | 1 of 6
Climate 12-Month Moving Averages
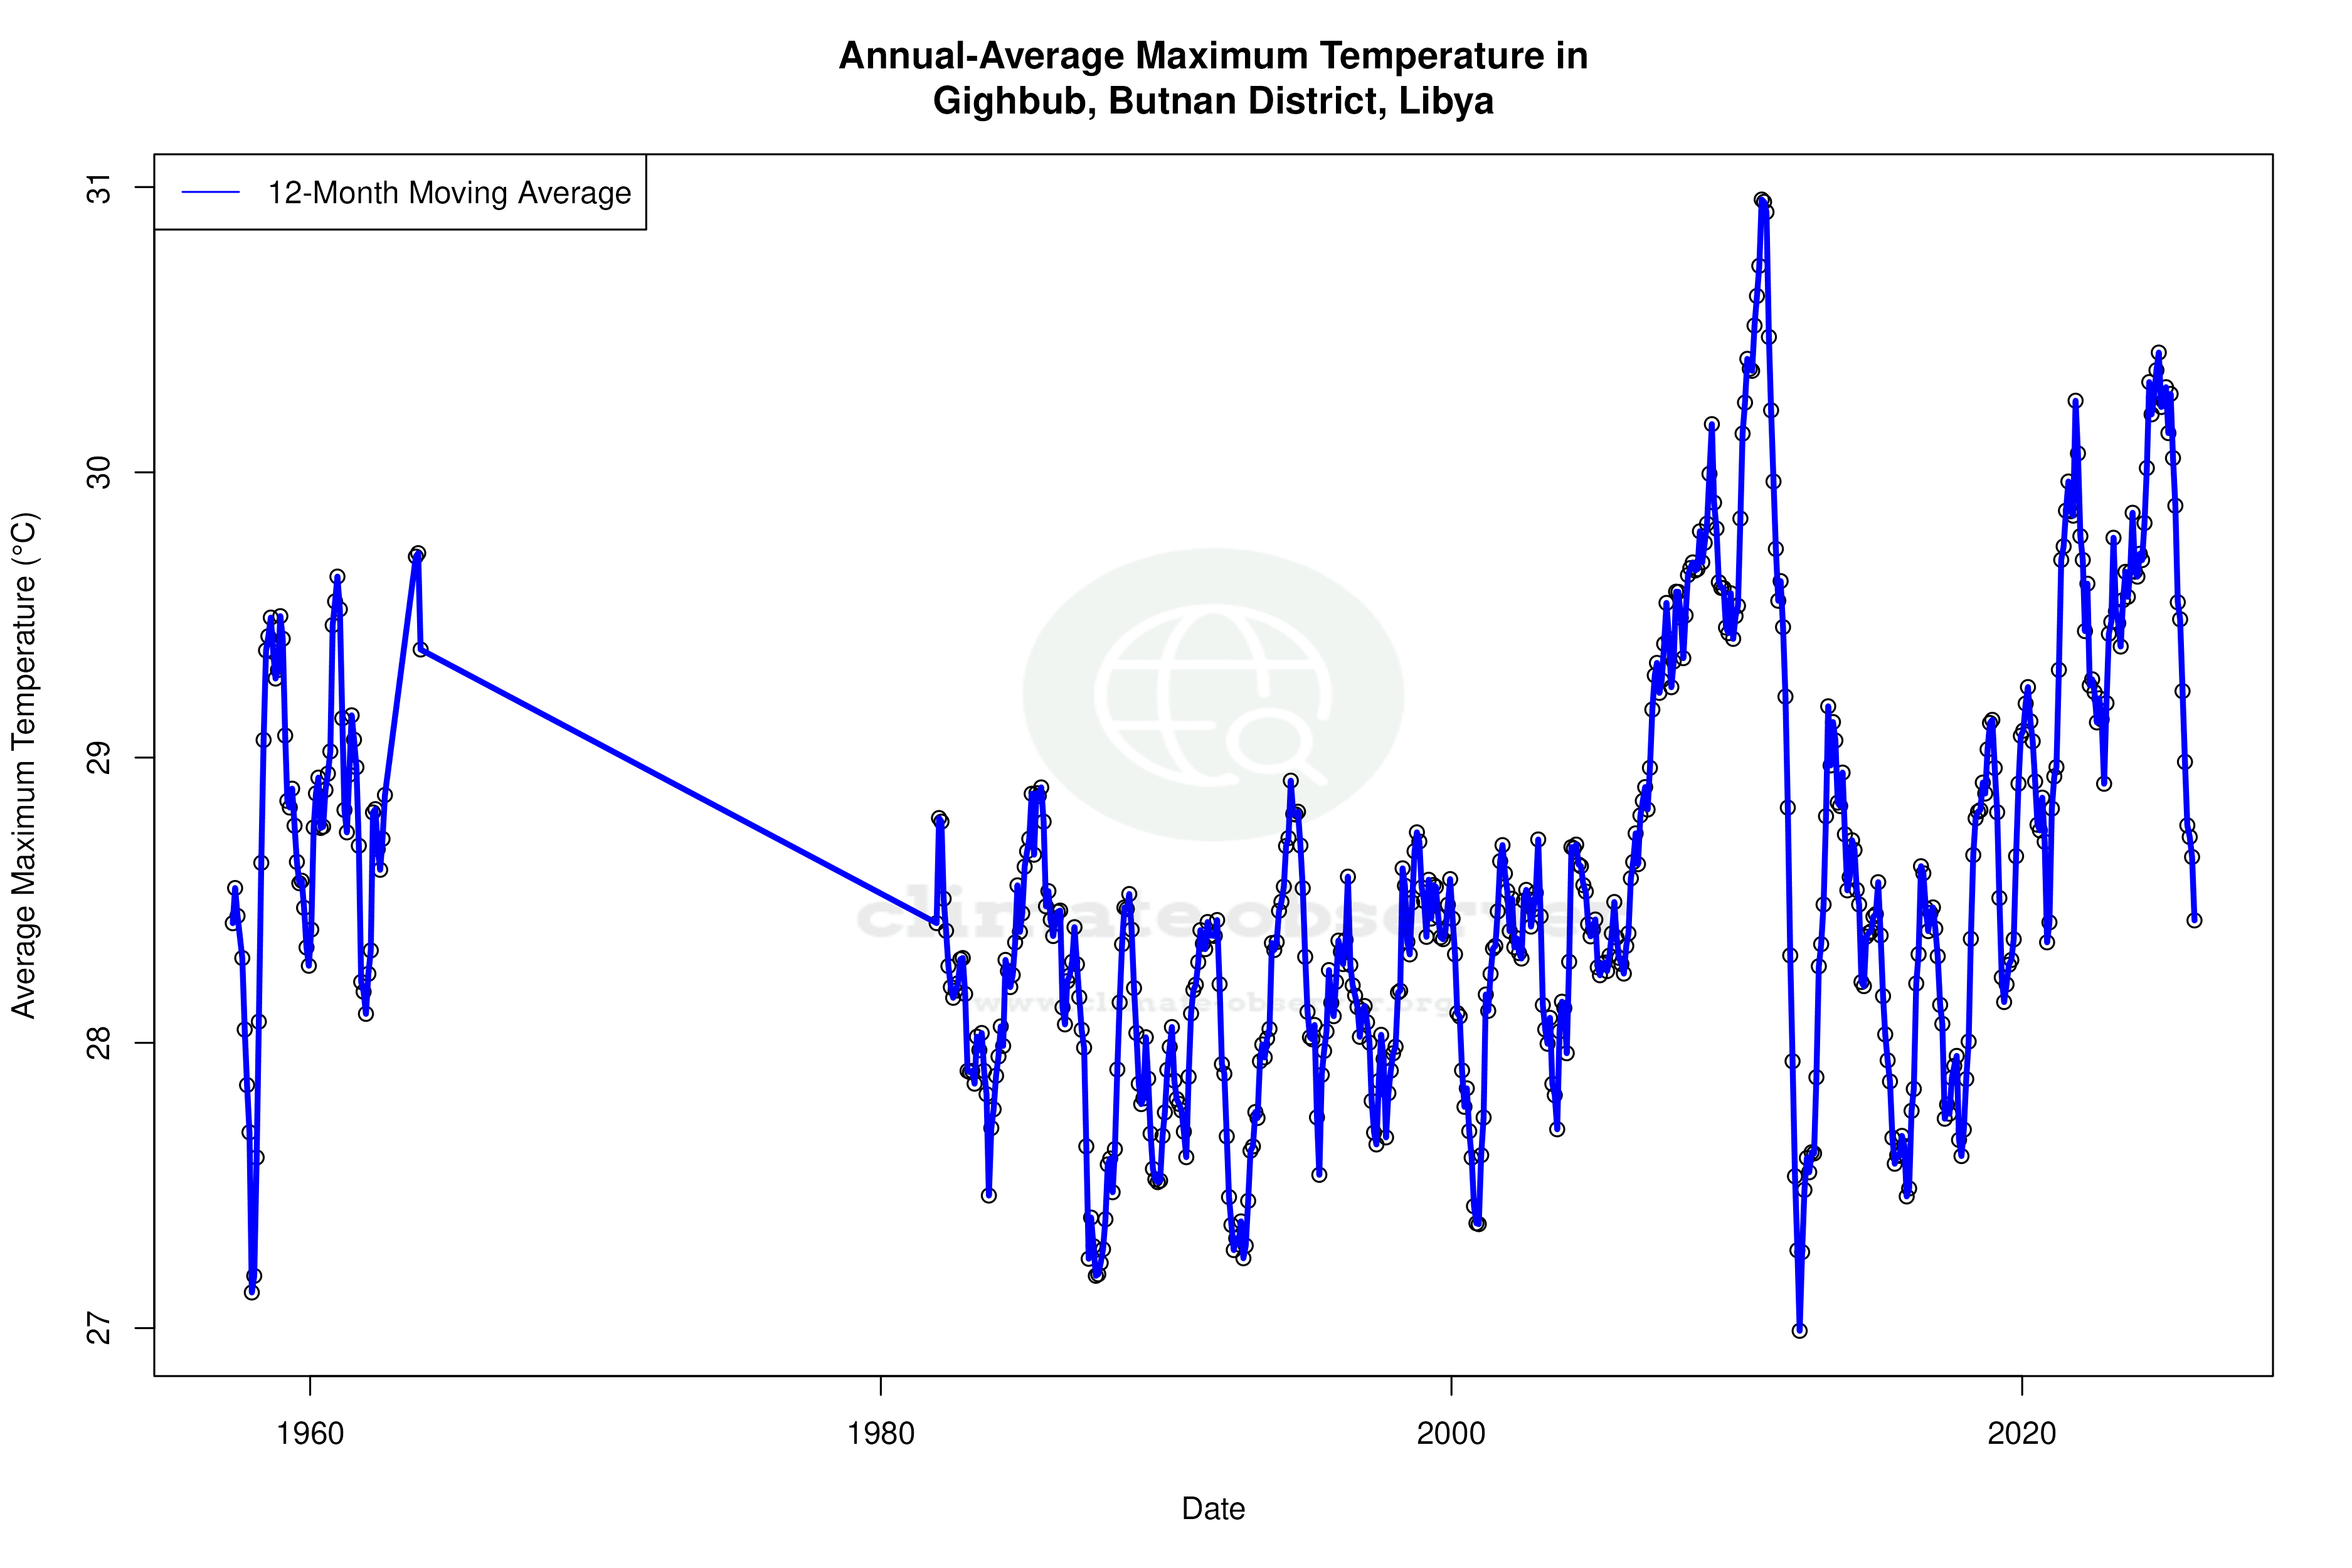


Max Temperature 12-Month MA | 1 of 6
Daily Data Points and Averages Throughout the Year
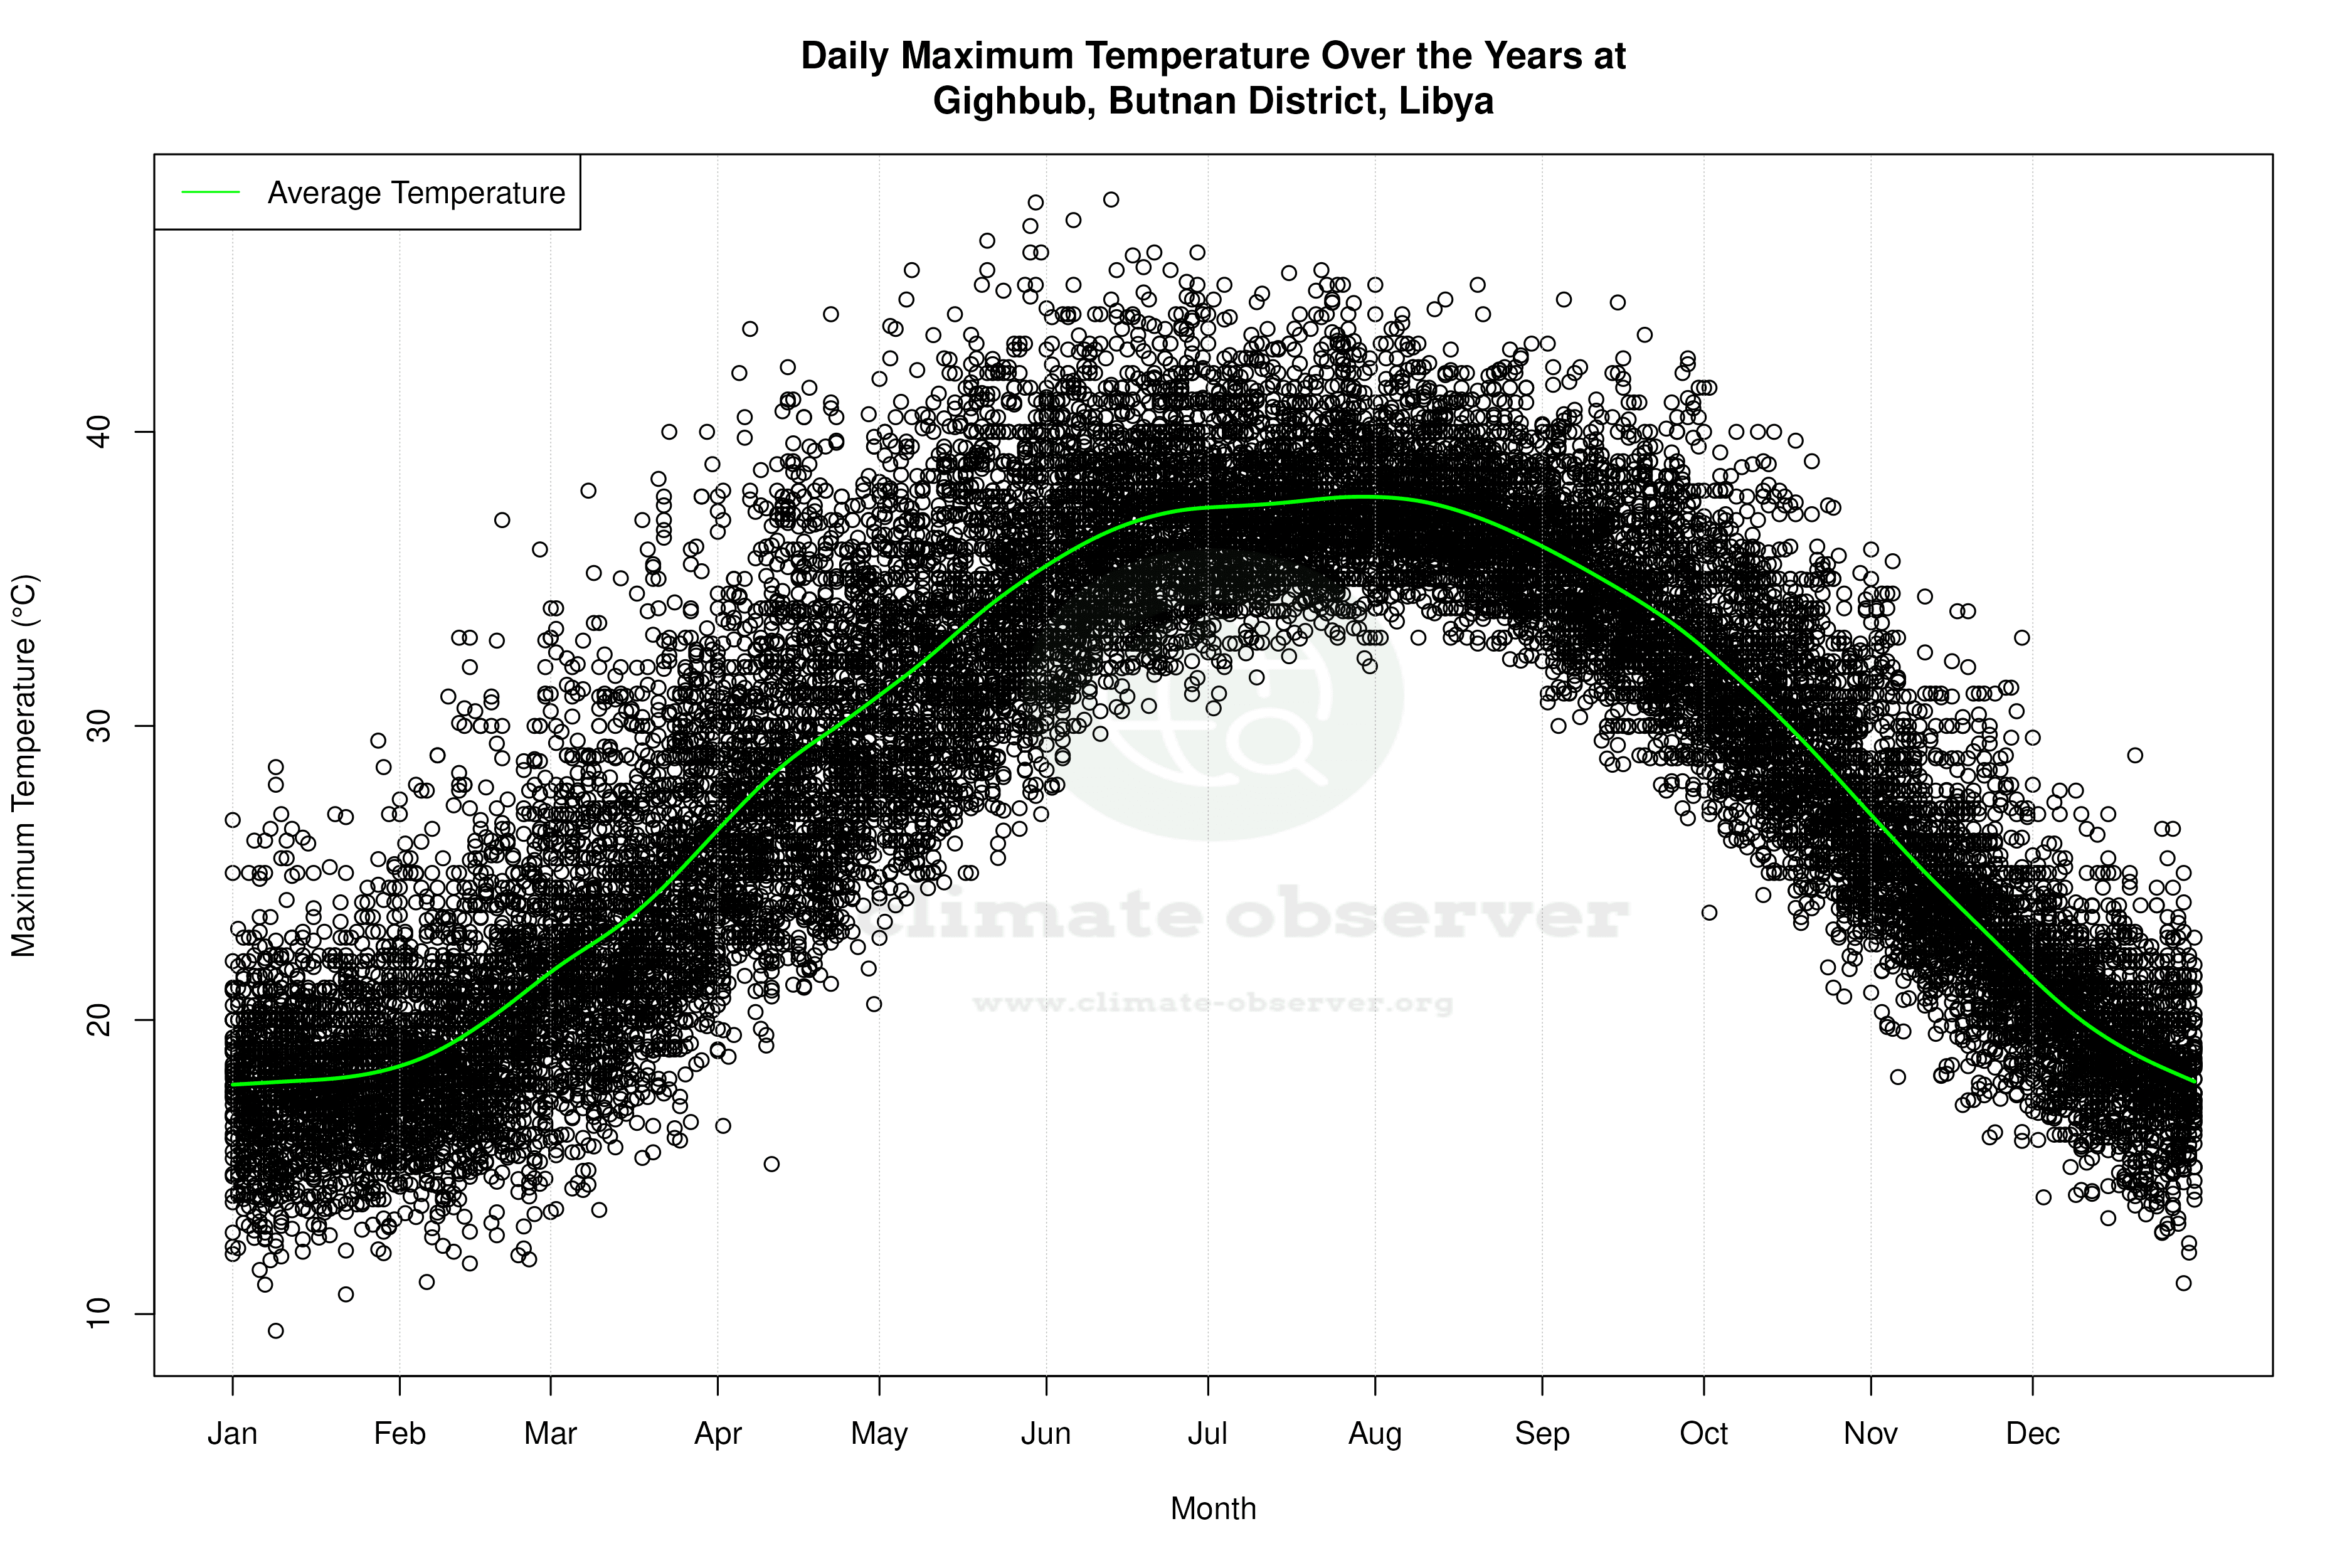
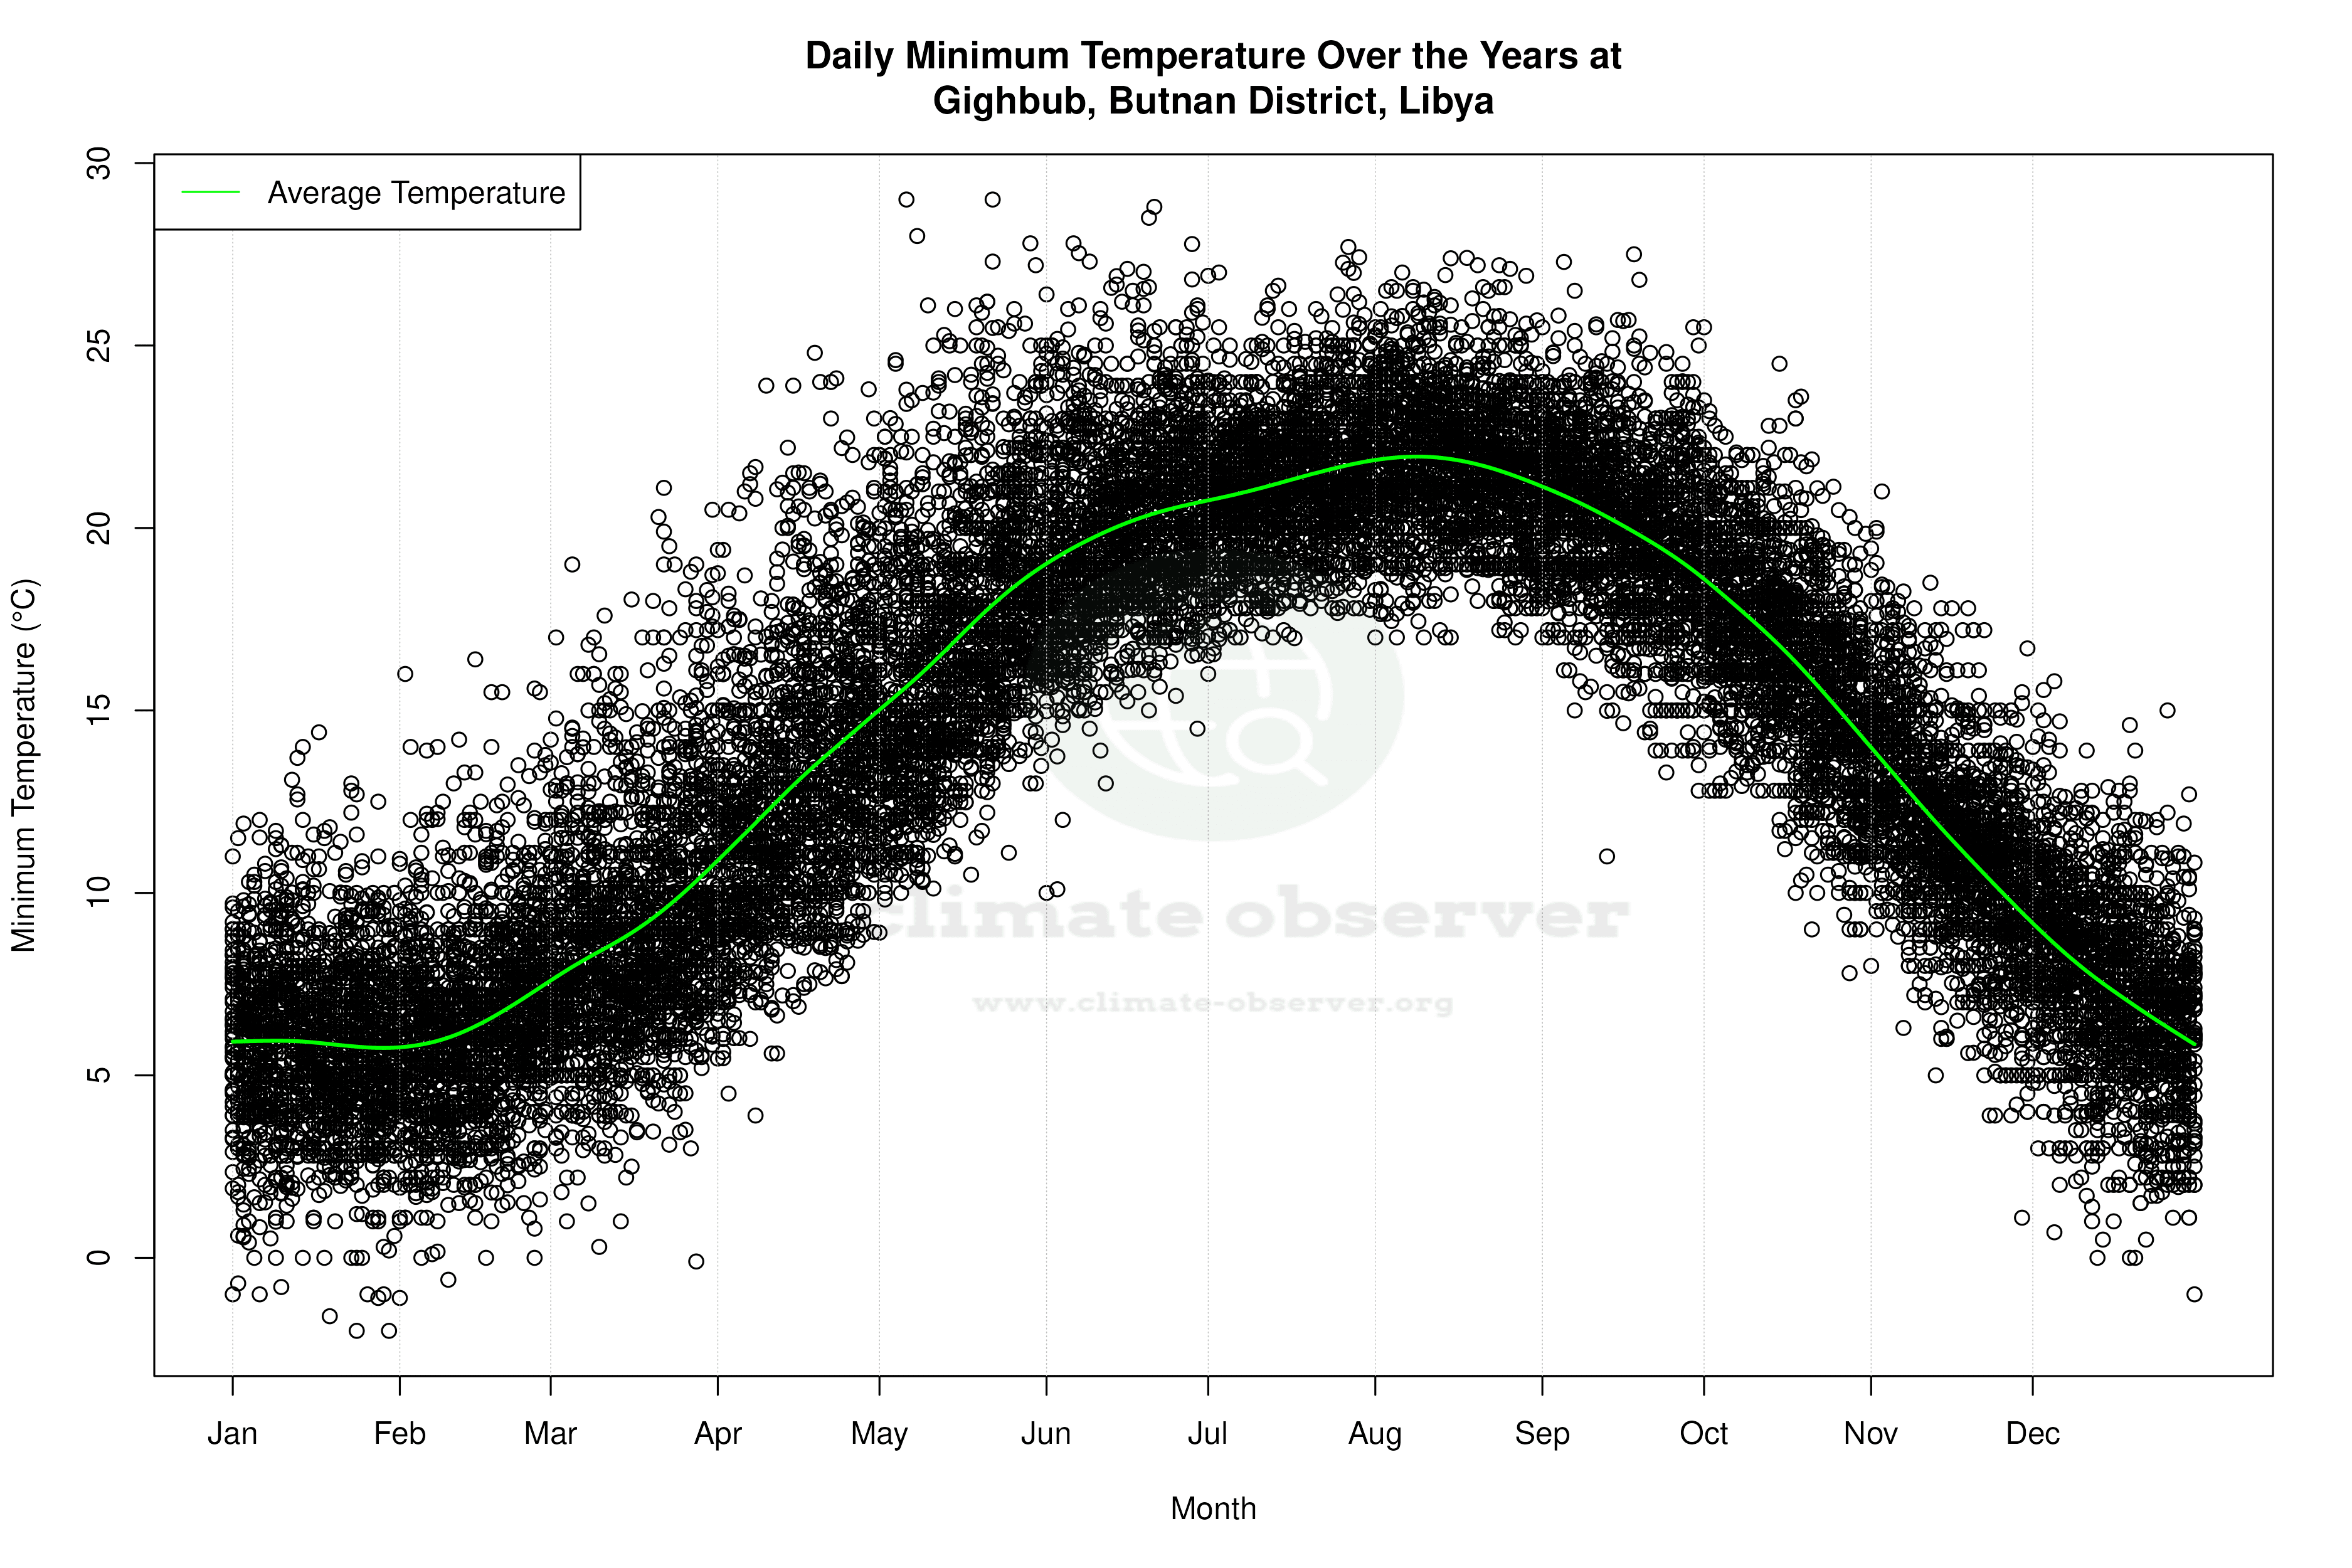


Average Max Temperature Throughout Year | 1 of 5
