Climate for Station: Antananarivo/Ivato, Analamanga, Madagascar
Loading live weather...
Climate Analysis & Overview
Antananarivo/Ivato is experiencing a warming trend, with notable increases in both high and low temperatures over the past decade and all-time records. Precipitation patterns have become more evenly distributed, reflecting a shift in regional climate dynamics. These changes are significant in the context of Madagascar's broader climate goals and recent weather patterns.
Warming Trends in Antananarivo
The climate station at Antananarivo/Ivato, located at -18.8, 47.483, reveals a warming trend that aligns with global climate patterns. Over the past decade, the high temperatures have increased by 0.56°C (1.01°F), while the lows have risen by 0.31°C (0.56°F). When considering the all-time data, the highs have risen by 0.68°C (1.22°F) and the lows by 0.39°C (0.70°F). This consistent warming trend suggests a shift towards warmer conditions, impacting local ecosystems and human activities.
Temperature Extremes and Records
Antananarivo/Ivato has recorded a maximum temperature of 36.2°C (97.2°F) and a minimum of -0.4°C (31.3°F). These extremes highlight the variability within the region's climate, which is classified under the Köppen system as a subtropical highland climate. The city's elevation and surrounding geography, including mountains and plateaus, contribute to these temperature variations, creating a unique microclimate that influences weather patterns.
Precipitation Patterns and Distribution
The Precipitation Concentration Index (PCI) for Antananarivo/Ivato has decreased from a baseline of 15.68 to 13.02. This indicates that precipitation is now more evenly distributed throughout the year, rather than being concentrated in fewer, more intense events. Such a shift can have significant implications for agriculture and water management, as it alters the availability of water resources throughout the seasons.
Regional Climate Context
Madagascar's regional climate goals focus on adapting to and mitigating the impacts of climate change. The observed trends in Antananarivo/Ivato provide valuable insights into how local climates are evolving in response to broader environmental changes. Recent weather events, such as cyclones and droughts, underscore the importance of understanding these trends to enhance resilience and inform policy decisions.
Implications for the Future
The warming trends and changes in precipitation patterns at Antananarivo/Ivato are critical indicators of the region's climate trajectory. As Madagascar continues to navigate the challenges posed by climate change, these data points serve as essential tools for planning and adaptation strategies. The interplay between temperature increases and more evenly distributed rainfall will shape the future of the region's climate and its socio-economic landscape.
Station Statistics
10-Year Trend
High: +0.37 °F/decade
Low: +0.48 °F/decade
Rain: -0.118 in/decade
25-Year Trend
High: +1.91 °F/decade
Low: +0.71 °F/decade
Rain: -0.003 in/decade
50-Year Trend
High: +1.26 °F/decade
Low: +0.73 °F/decade
Rain: +0.004 in/decade
All-Time Trend
High: +1.26 °F/decade
Low: +0.73 °F/decade
Rain: +0.004 in/decade
Percentage Above-Average Days
Last 12 Months: 56.9%
This Year: 40.9%
Precipitation Concentration Index (PCI) ℹ️
Last 12 Months: 21.3
Historical Average: 17.3
Percentile Rank of Last 12 Months ℹ️
High: 90th percentile
Low: 96th percentile
Rain: 36th percentile
Change in Variance ℹ️
High: -9.6%
Low: +6.9%
Intraday: -3.7%
Data Coverage
91.4%
First Year of Data
1973
Station Location
Historical Weather Records
| Max High | Avg High | Min High | Max Avg | Avg Avg | Min Avg | Max Low | Avg Low | Min Low | Max Precipitation | Avg Precipitation | Max Snow | Avg Snow | |
|---|---|---|---|---|---|---|---|---|---|---|---|---|---|
| Record | 97.16 °F | — | 52.77 °F | 80.24 °F | — | 46.76 °F | 68.00 °F | — | 31.28 °F | 9.61 in | — | — | — |
| January | 95.90 °F | 80.27 °F | 66.49 °F | 78.08 °F | 70.13 °F | 60.80 °F | 68.00 °F | 62.21 °F | 50.00 °F | 6.73 in | 0.47 in | — | — |
| February | 97.16 °F | 79.98 °F | 64.76 °F | 75.92 °F | 70.12 °F | 60.30 °F | 68.00 °F | 62.46 °F | 52.92 °F | 7.56 in | 0.44 in | — | — |
| March | 89.60 °F | 79.44 °F | 65.21 °F | 76.46 °F | 69.65 °F | 57.45 °F | 68.00 °F | 61.81 °F | 47.59 °F | 7.15 in | 0.31 in | — | — |
| April | 91.40 °F | 78.25 °F | 60.35 °F | 77.72 °F | 67.71 °F | 56.48 °F | 68.00 °F | 59.24 °F | 45.68 °F | 9.61 in | 0.14 in | — | — |
| May | 88.88 °F | 74.75 °F | 60.06 °F | 74.84 °F | 63.87 °F | 53.64 °F | 66.20 °F | 54.99 °F | 39.92 °F | 1.52 in | 0.06 in | — | — |
| June | 84.56 °F | 70.60 °F | 52.77 °F | 69.26 °F | 59.80 °F | 48.22 °F | 60.80 °F | 50.74 °F | 35.60 °F | 1.16 in | 0.05 in | — | — |
| July | 88.16 °F | 69.23 °F | 54.10 °F | 67.64 °F | 58.31 °F | 47.82 °F | 62.24 °F | 49.14 °F | 31.28 °F | 1.54 in | 0.04 in | — | — |
| August | 86.90 °F | 71.53 °F | 54.12 °F | 70.34 °F | 59.69 °F | 46.76 °F | 60.08 °F | 49.85 °F | 39.92 °F | 1.95 in | 0.04 in | — | — |
| September | 89.60 °F | 75.77 °F | 56.17 °F | 74.84 °F | 62.98 °F | 50.63 °F | 62.60 °F | 51.72 °F | 36.32 °F | 1.09 in | 0.03 in | — | — |
| October | 93.20 °F | 79.80 °F | 64.22 °F | 80.24 °F | 66.86 °F | 55.58 °F | 66.20 °F | 55.81 °F | 35.60 °F | 5.14 in | 0.11 in | — | — |
| November | 95.18 °F | 81.52 °F | 65.01 °F | 77.72 °F | 69.15 °F | 58.26 °F | 66.56 °F | 58.95 °F | 43.70 °F | 6.18 in | 0.24 in | — | — |
| December | 95.54 °F | 81.08 °F | 66.45 °F | 79.16 °F | 70.00 °F | 59.86 °F | 68.00 °F | 61.29 °F | 50.00 °F | 5.67 in | 0.39 in | — | — |
Data Visualisations
Remove WatermarksCurrent Year Climate Trends vs Historical


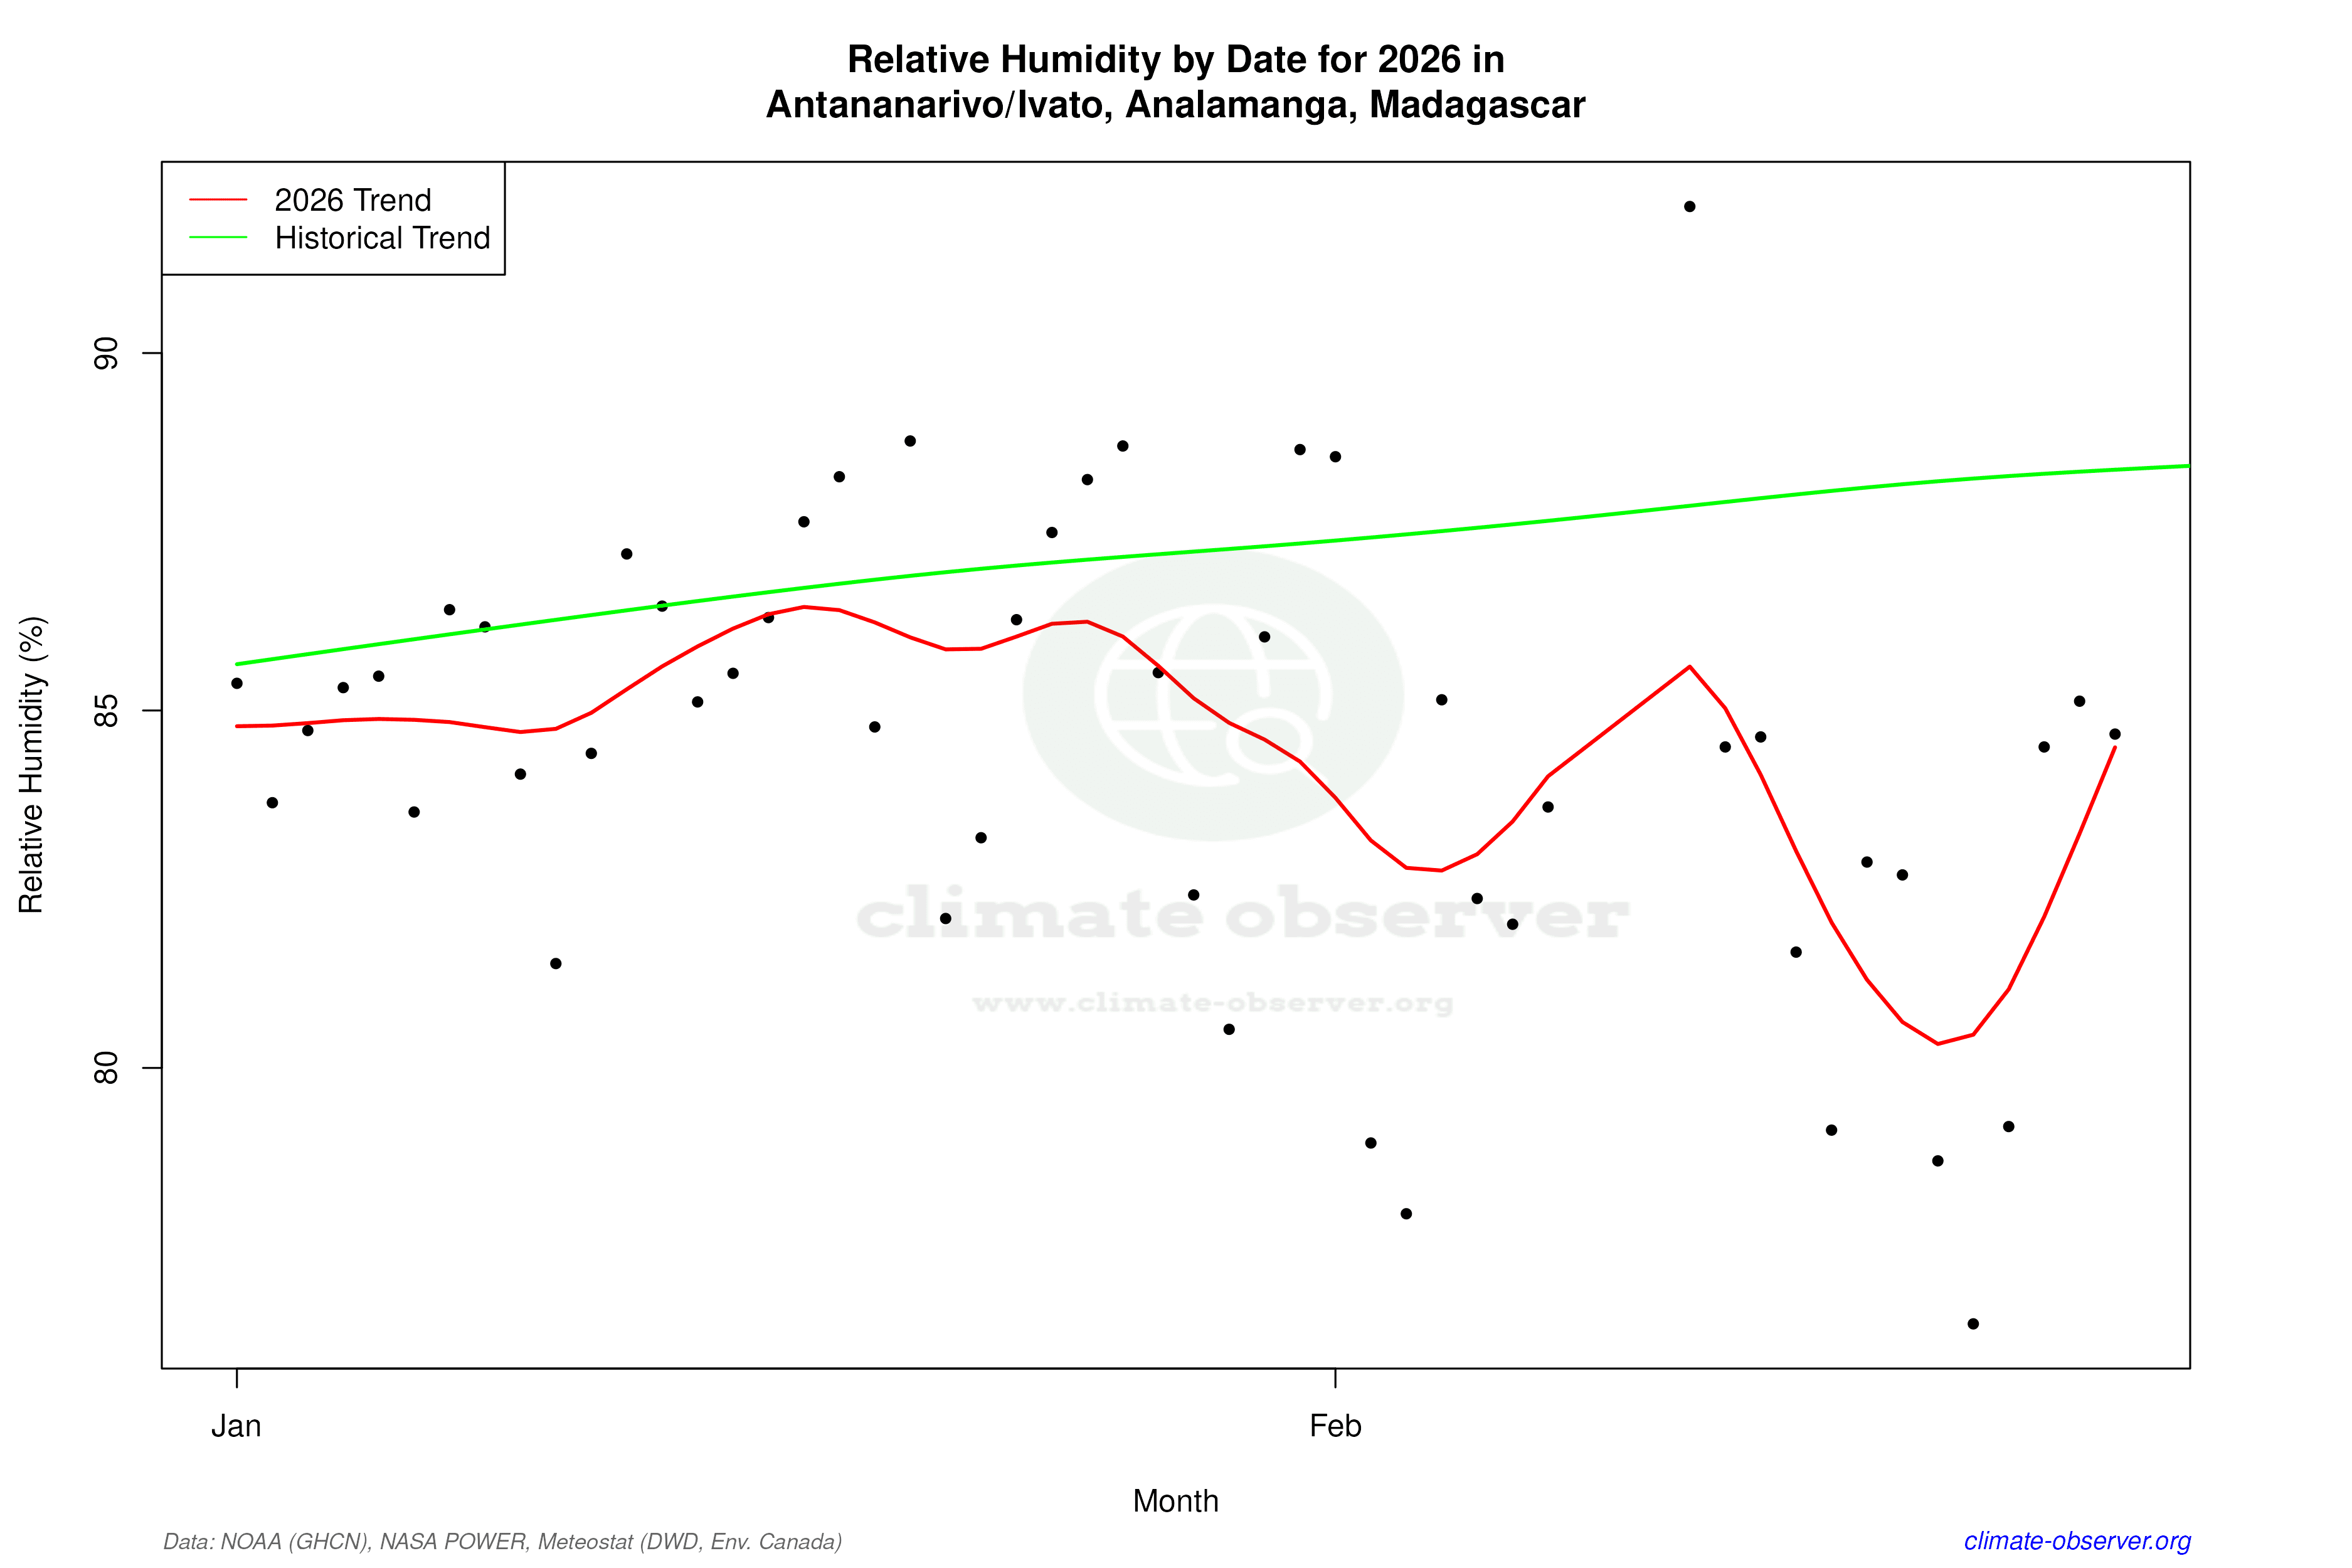

Max Temperature this Year | 1 of 6
Climate 12-Month Moving Averages


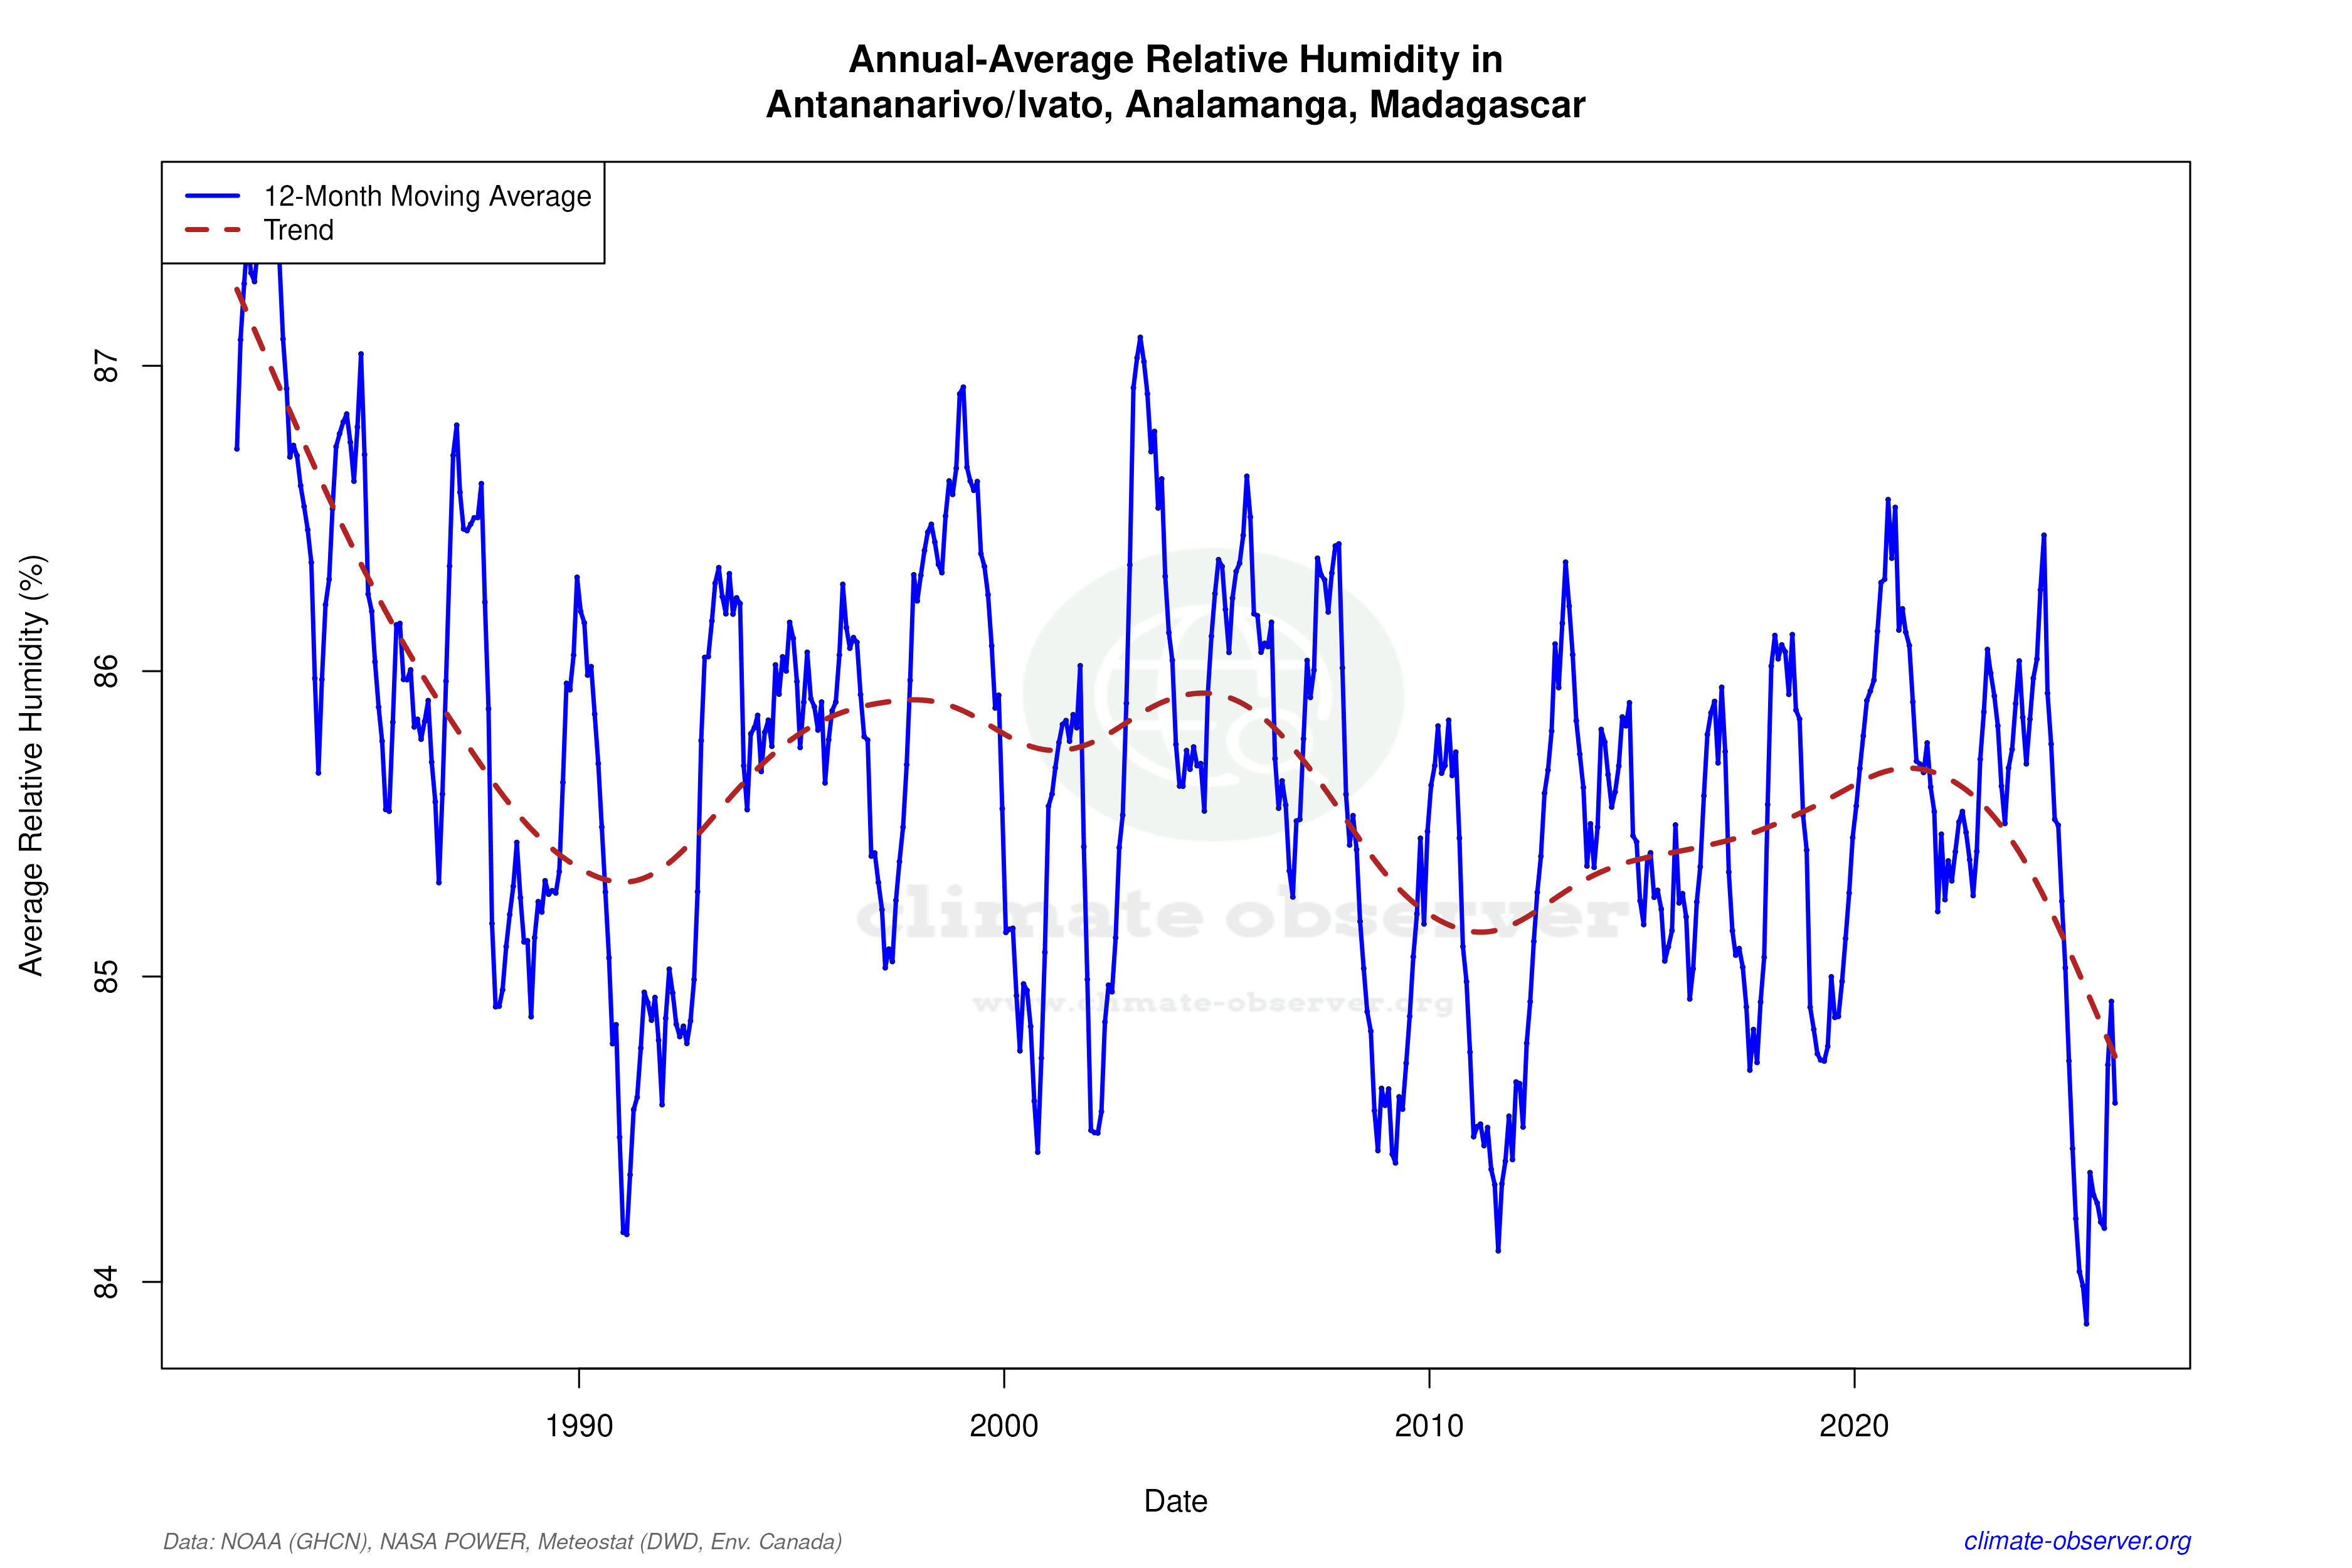

Max Temperature 12-Month MA | 1 of 6
Daily Data Points and Averages Throughout the Year


Average Max Temperature Throughout Year | 1 of 5
