Climate for Station: Ulaan-Gom, Uvs Province, Mongolia
Loading live weather...
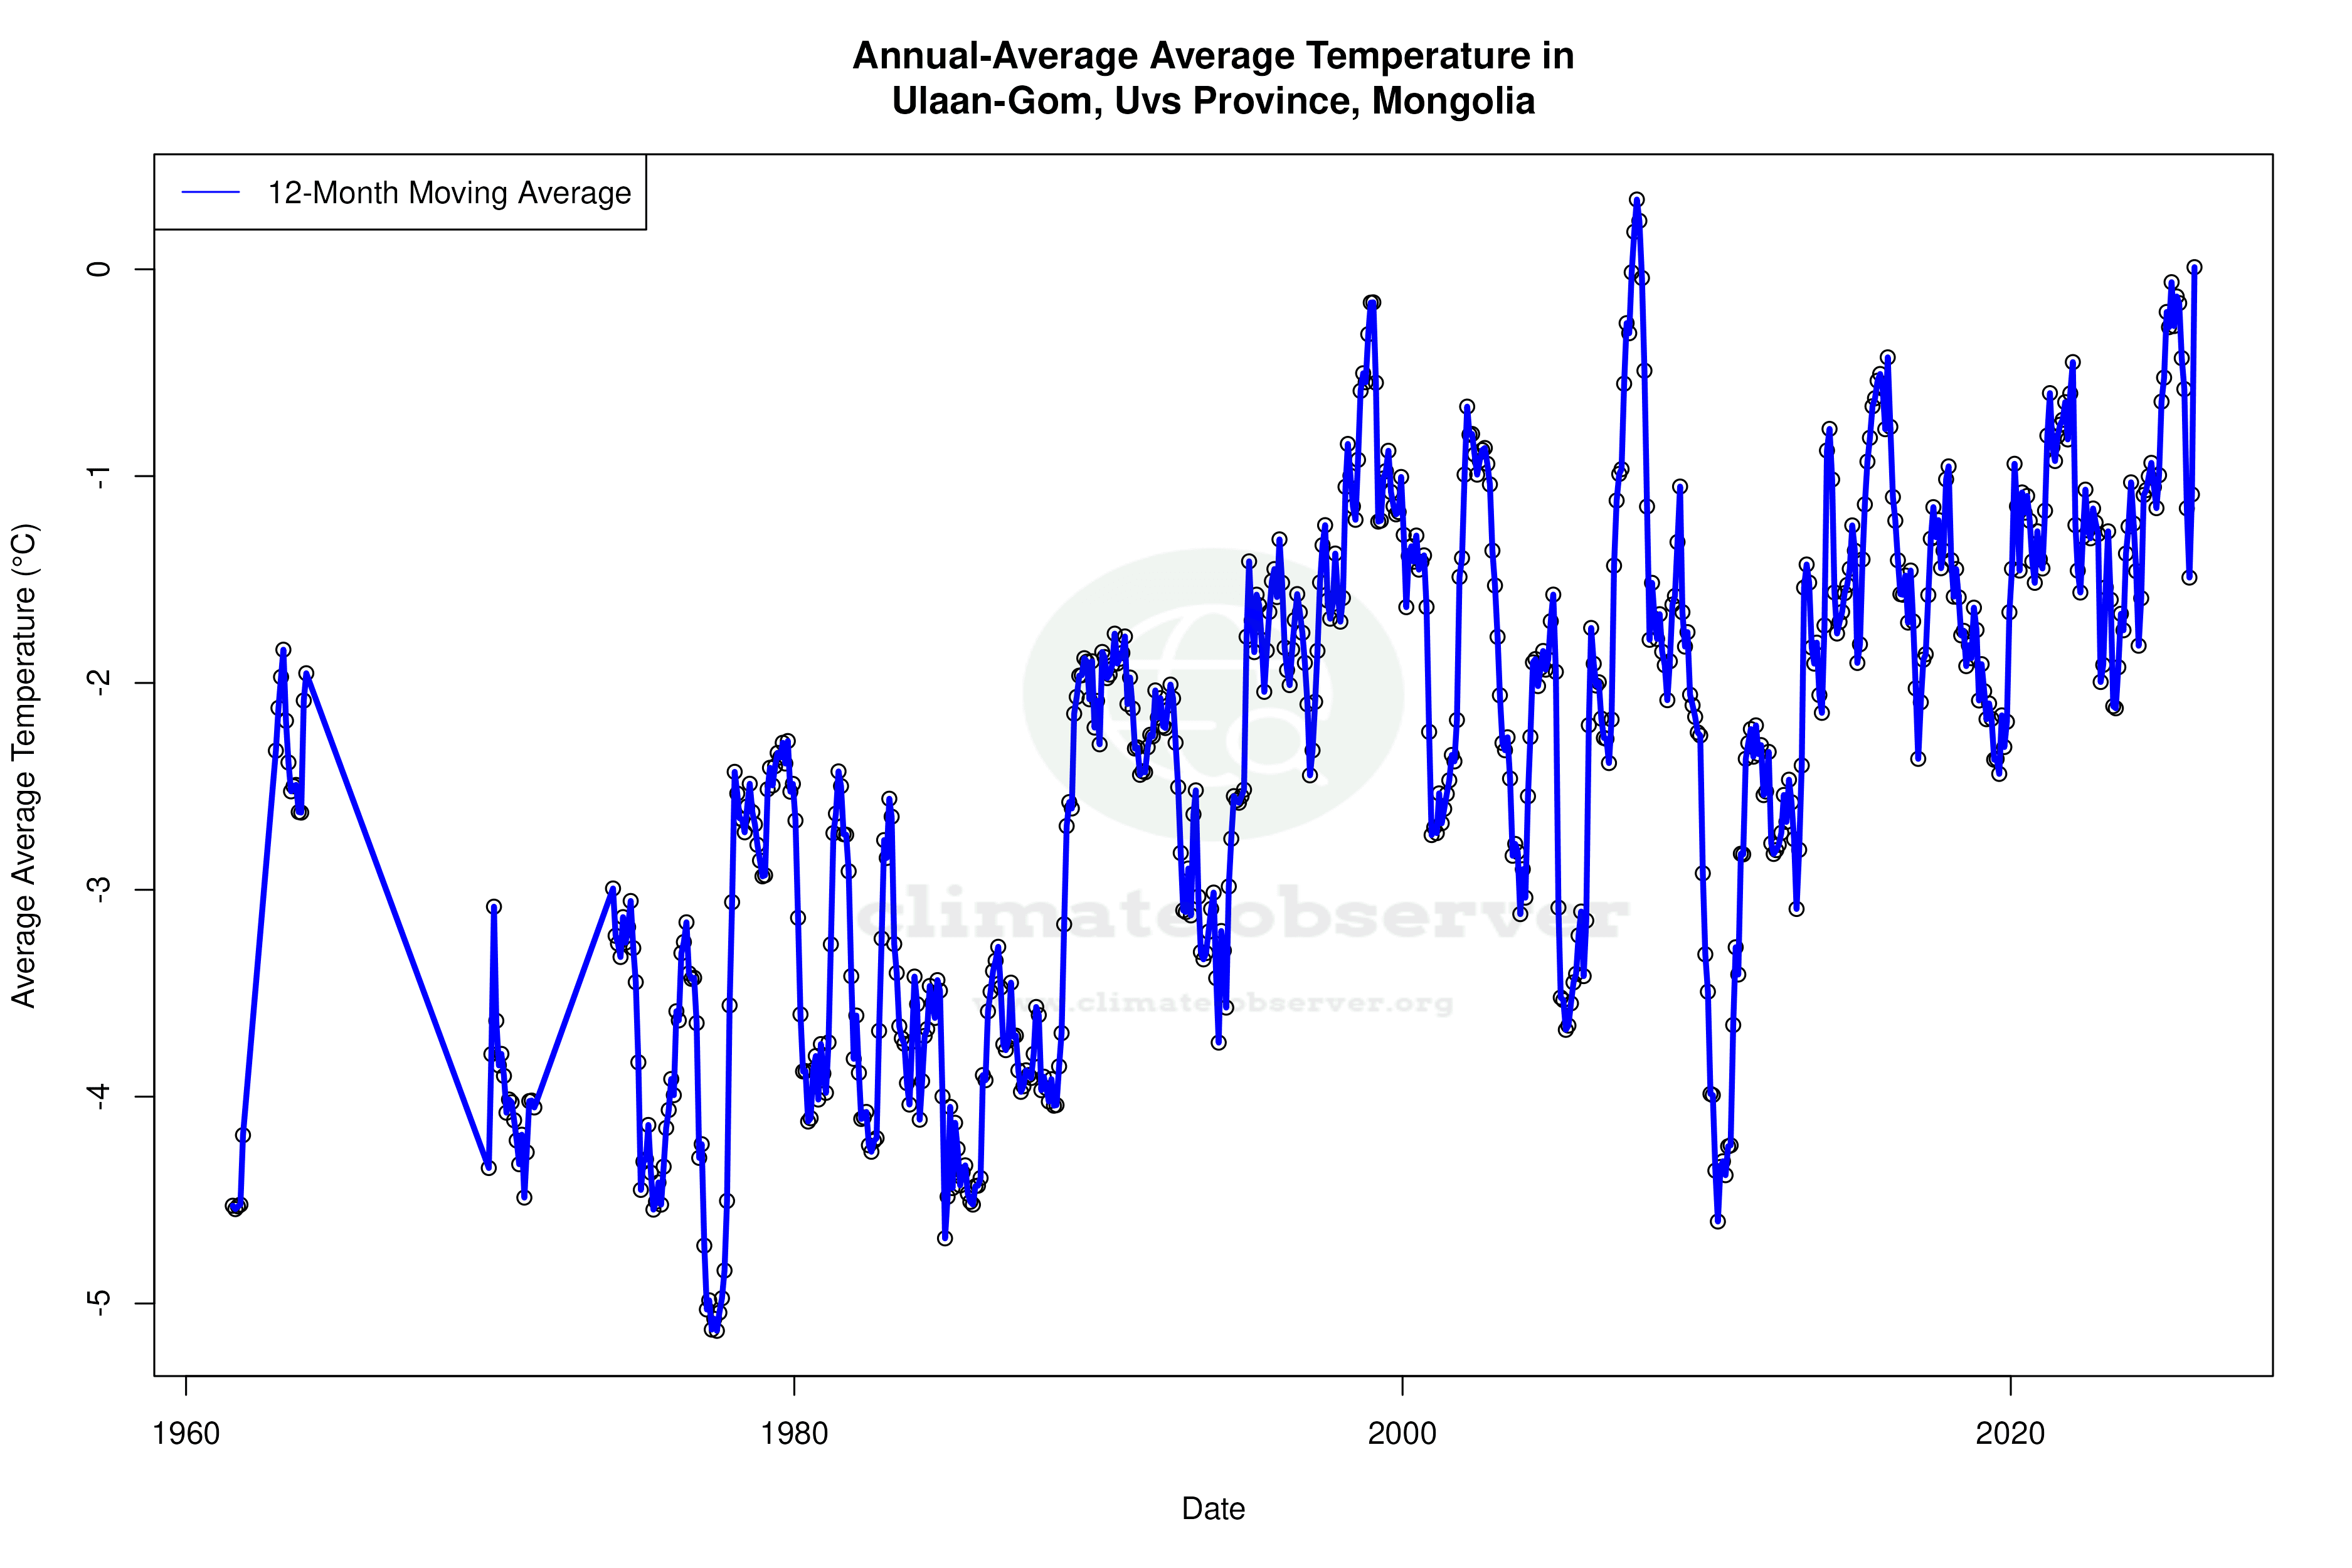
Climate Analysis & Overview
Ulaan-Gom's climate is experiencing a notable warming trend, particularly in nighttime temperatures, with a significant redistribution of precipitation patterns. This aligns with Mongolia's regional climate goals, which focus on understanding and mitigating the impacts of climate change.
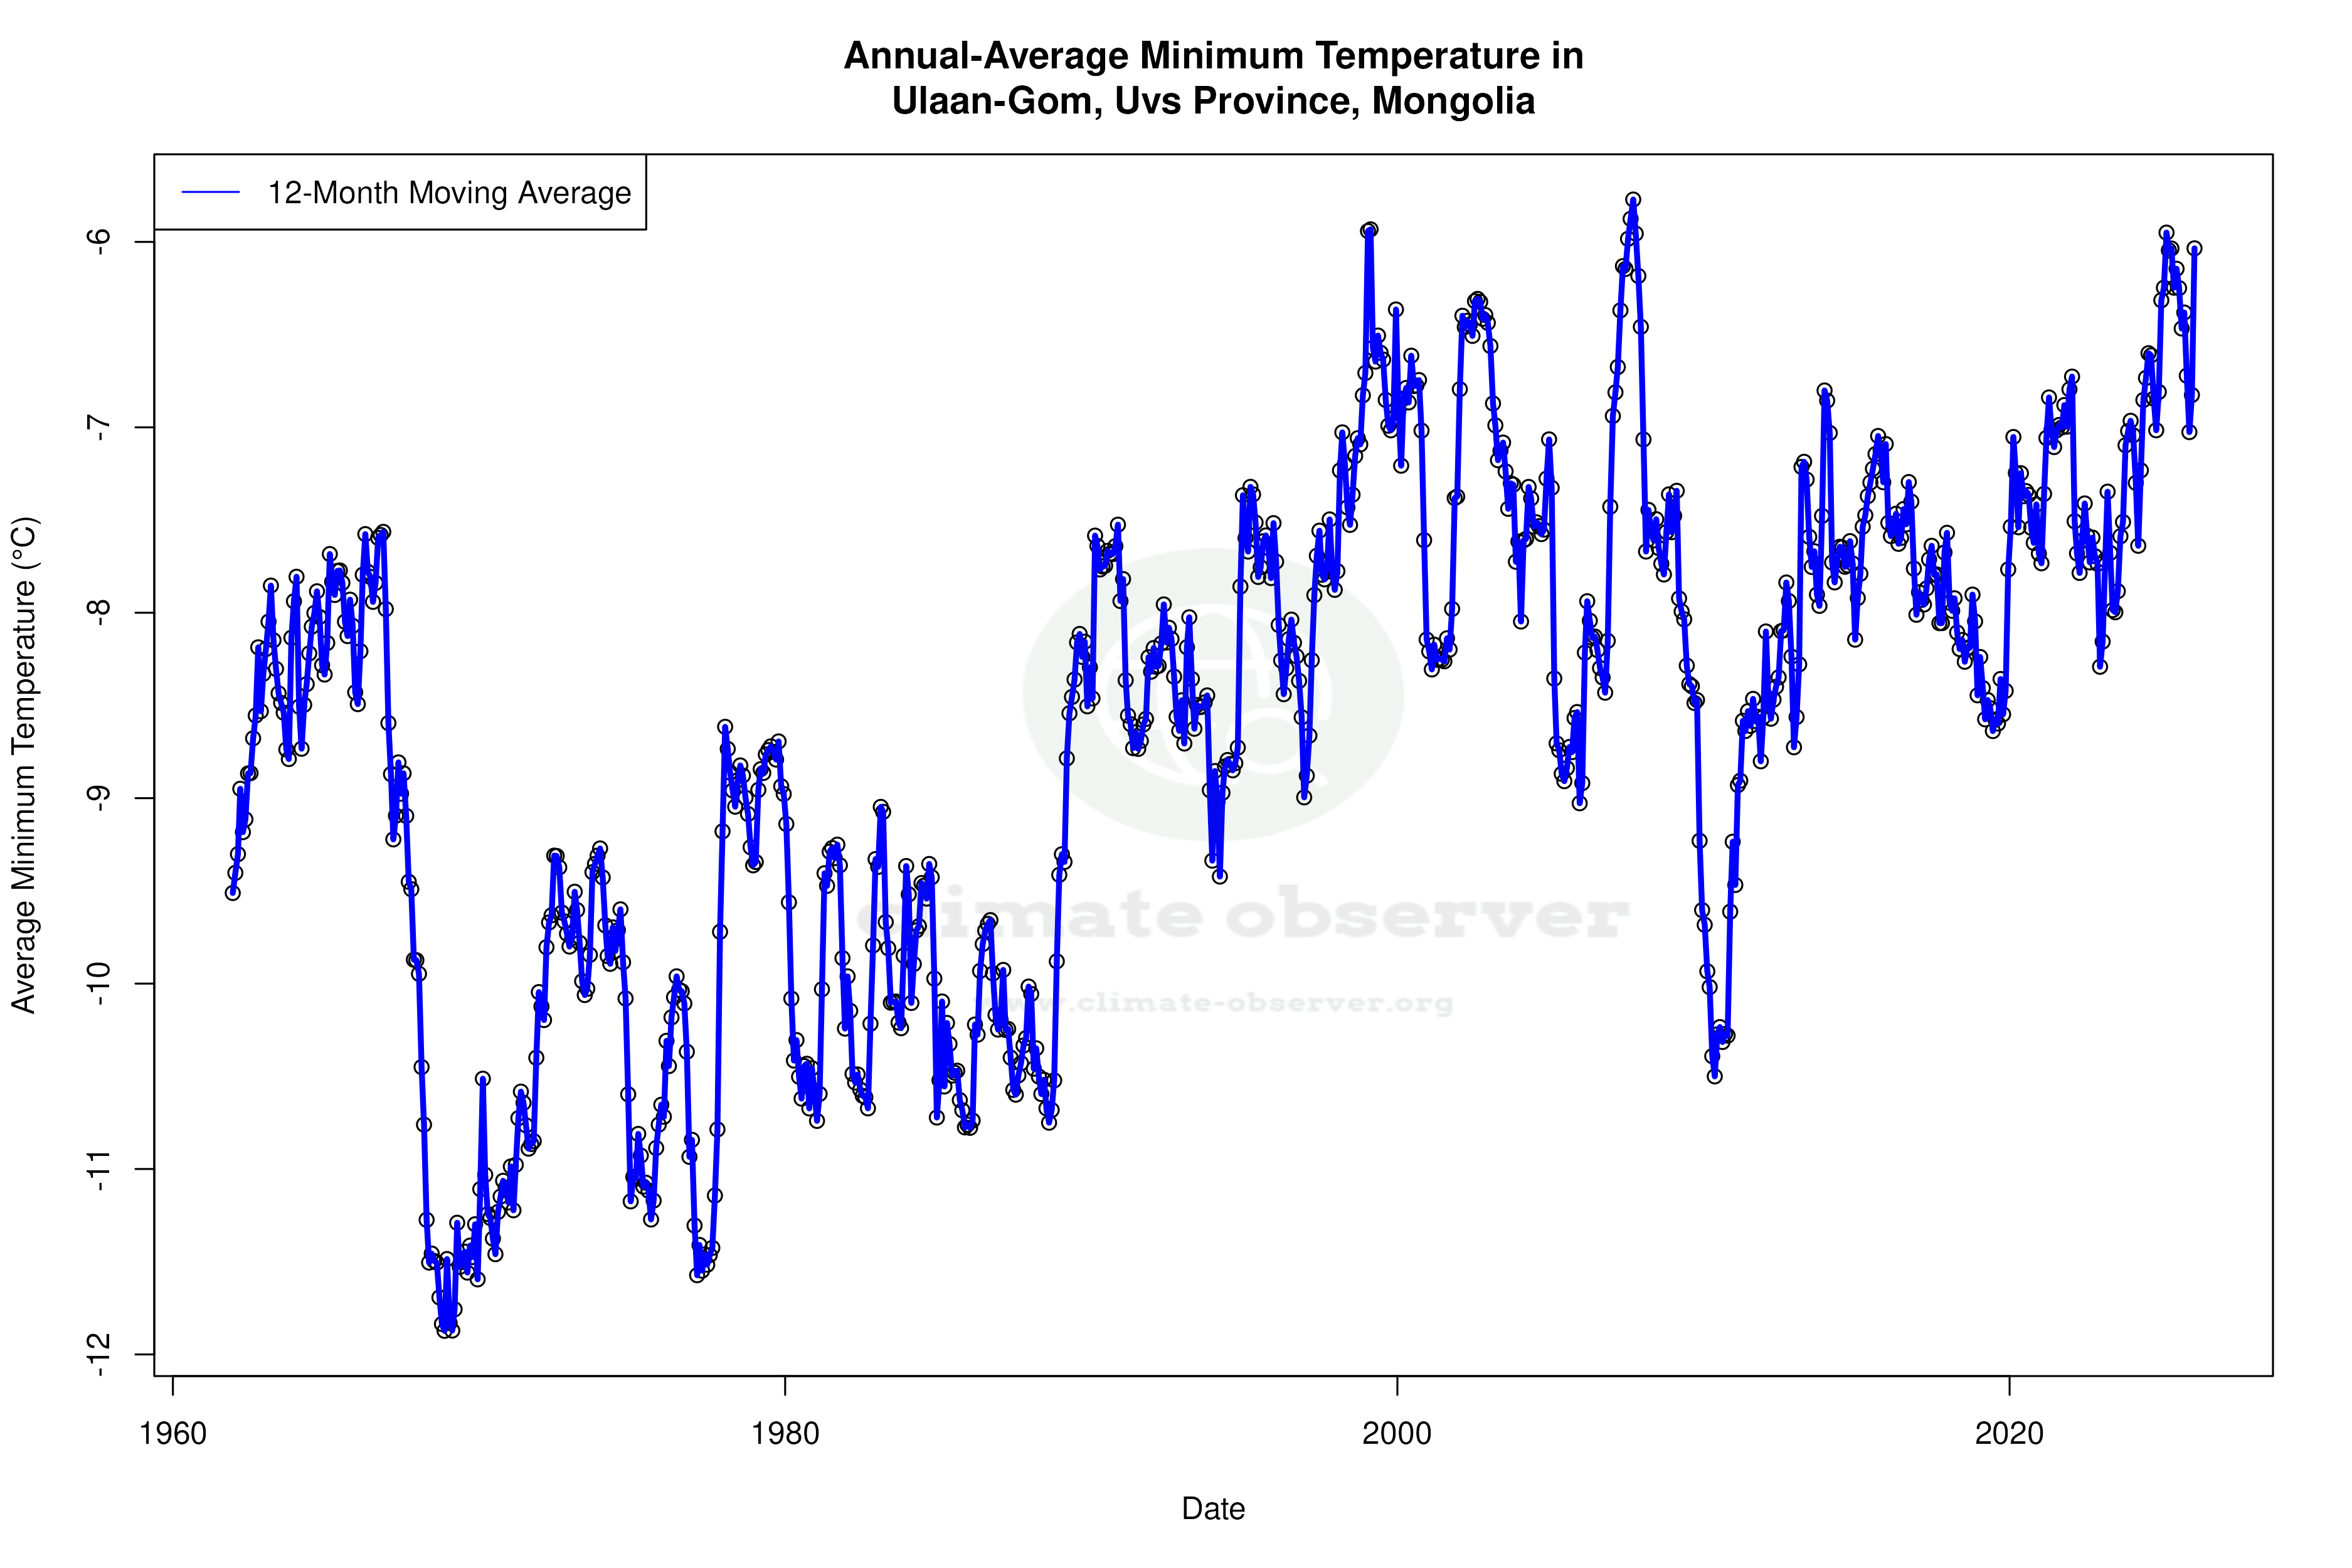
Warming Nights in Ulaan-Gom
Ulaan-Gom, situated at coordinates 49.8°N, 92.08°E, falls under the Köppen climate classification of BSk, indicating a cold semi-arid climate. The region's geography, characterised by vast steppes and proximity to the Altai Mountains, plays a crucial role in its climatic conditions. Over the past decade, the area has experienced a pronounced warming trend, particularly in nighttime temperatures. The lows have increased by 1.90°C (3.42°F), a significant rise compared to the all-time trend of 0.48°C (0.86°F). This suggests a more rapid warming in recent years, potentially impacting local agriculture and biodiversity.
Daytime Temperature Trends
In contrast to the significant rise in nighttime temperatures, daytime highs have shown a more modest increase. Over the last ten years, the highs have risen by 0.48°C (0.86°F), aligning closely with the all-time trend of 0.44°C (0.79°F). This consistent warming trend in daytime temperatures suggests a steady increase in heat during the day, which could influence water resources and energy demand in the region.
Extreme Temperature Records
Ulaan-Gom's climate is marked by extreme temperature records, with a maximum recorded temperature of 38.4°C (101.1°F) and a minimum of -49.6°C (-57.3°F). These extremes highlight the region's susceptibility to both intense heat and severe cold, which are characteristic of its continental climate. Such temperature variations can have profound effects on infrastructure and human health.
Shifting Precipitation Patterns
The Precipitation Concentration Index (PCI) for Ulaan-Gom has seen a significant shift, with the current value at 12.7, down from a baseline of 19.1. This decrease indicates that precipitation is now more evenly distributed throughout the year, reducing the occurrence of intense, concentrated rainfall events. Such a change can be beneficial for agriculture, as it may lead to more reliable water availability and less soil erosion.
Regional Climate Context
Mongolia has been actively pursuing regional climate goals aimed at mitigating the effects of climate change. The observed trends in Ulaan-Gom, particularly the increase in nighttime temperatures and the redistribution of precipitation, align with these goals. Understanding these changes is crucial for developing strategies to adapt to the evolving climate, ensuring sustainable development in the region.
Station Statistics
10-Year Trend
High: +0.46 °C/decade
Low: +2.51 °C/decade
Rain: -0.15 mm/decade
25-Year Trend
High: +0.34 °C/decade
Low: +0.38 °C/decade
Rain: +0.08 mm/decade
50-Year Trend
High: +0.54 °C/decade
Low: +0.62 °C/decade
Rain: +0.09 mm/decade
All-Time Trend
High: +0.44 °C/decade
Low: +0.50 °C/decade
Rain: +0.07 mm/decade
Percentage Above-Average Days
Last 12 Months: 55.3%
This Year: 33.7%
Precipitation Concentration Index (PCI) ℹ️
Last 12 Months: 13.5
Historical Average: 20.9
Percentile Rank of Last 12 Months ℹ️
High: 75th percentile
Low: 99th percentile
Rain: 74th percentile
Change in Variance ℹ️
High: -3.6%
Low: -10.8%
Intraday: +29.4%
Data Coverage
92.5%
First Year of Data
1957
Station Location
Historical Weather Records
| Max High | Avg High | Min High | Max Avg | Avg Avg | Min Avg | Max Low | Avg Low | Min Low | Max Precipitation | Avg Precipitation | Max Snow | Avg Snow | |
|---|---|---|---|---|---|---|---|---|---|---|---|---|---|
| Record | 38.4 °C | — | -40.1 °C | 32.0 °C | — | -43.7 °C | 24.9 °C | — | -49.6 °C | 47.0 mm | — | — | — |
| January | -3.3 °C | -25.4 °C | -40.1 °C | -12.2 °C | -31.3 °C | -43.7 °C | -9.8 °C | -34.4 °C | -49.6 °C | 2.6 mm | 0.0 mm | — | — |
| February | 2.2 °C | -21.4 °C | -35.5 °C | -4.6 °C | -28.0 °C | -42.6 °C | -7.4 °C | -32.9 °C | -47.7 °C | 4.2 mm | 0.1 mm | — | — |
| March | 14.1 °C | -9.7 °C | -26.9 °C | 4.4 °C | -16.3 °C | -34.0 °C | 0.7 °C | -22.5 °C | -41.7 °C | 8.0 mm | 0.1 mm | — | — |
| April | 28.0 °C | 7.9 °C | -11.8 °C | 20.7 °C | 2.0 °C | -17.4 °C | 10.8 °C | -4.8 °C | -24.7 °C | 10.0 mm | 0.2 mm | — | — |
| May | 35.9 °C | 19.0 °C | -1.1 °C | 25.5 °C | 11.7 °C | -2.2 °C | 19.6 °C | 3.2 °C | -9.9 °C | 26.1 mm | 0.4 mm | — | — |
| June | 36.5 °C | 24.9 °C | 10.6 °C | 29.7 °C | 18.1 °C | 6.3 °C | 24.9 °C | 9.8 °C | -3.1 °C | 33.8 mm | 0.9 mm | — | — |
| July | 38.2 °C | 26.2 °C | 12.4 °C | 32.0 °C | 19.8 °C | 10.4 °C | 22.9 °C | 12.5 °C | 1.7 °C | 47.0 mm | 1.3 mm | — | — |
| August | 38.4 °C | 23.9 °C | 9.8 °C | 28.1 °C | 17.2 °C | 7.2 °C | 19.1 °C | 9.9 °C | -6.3 °C | 27.0 mm | 0.9 mm | — | — |
| September | 30.8 °C | 17.4 °C | 1.7 °C | 22.7 °C | 10.4 °C | -3.3 °C | 15.4 °C | 3.1 °C | -8.7 °C | 30.0 mm | 0.5 mm | — | — |
| October | 24.6 °C | 7.9 °C | -8.4 °C | 15.8 °C | 1.3 °C | -14.4 °C | 7.8 °C | -4.9 °C | -22.5 °C | 15.0 mm | 0.2 mm | — | — |
| November | 15.9 °C | -5.0 °C | -23.9 °C | 2.7 °C | -9.6 °C | -32.4 °C | 0.4 °C | -14.3 °C | -35.3 °C | 8.0 mm | 0.2 mm | — | — |
| December | 7.1 °C | -19.6 °C | -40.0 °C | -7.2 °C | -24.4 °C | -42.2 °C | -7.5 °C | -27.9 °C | -45.2 °C | 5.0 mm | 0.1 mm | — | — |
Data Visualisations
Remove WatermarksCurrent Year Climate Trends vs Historical
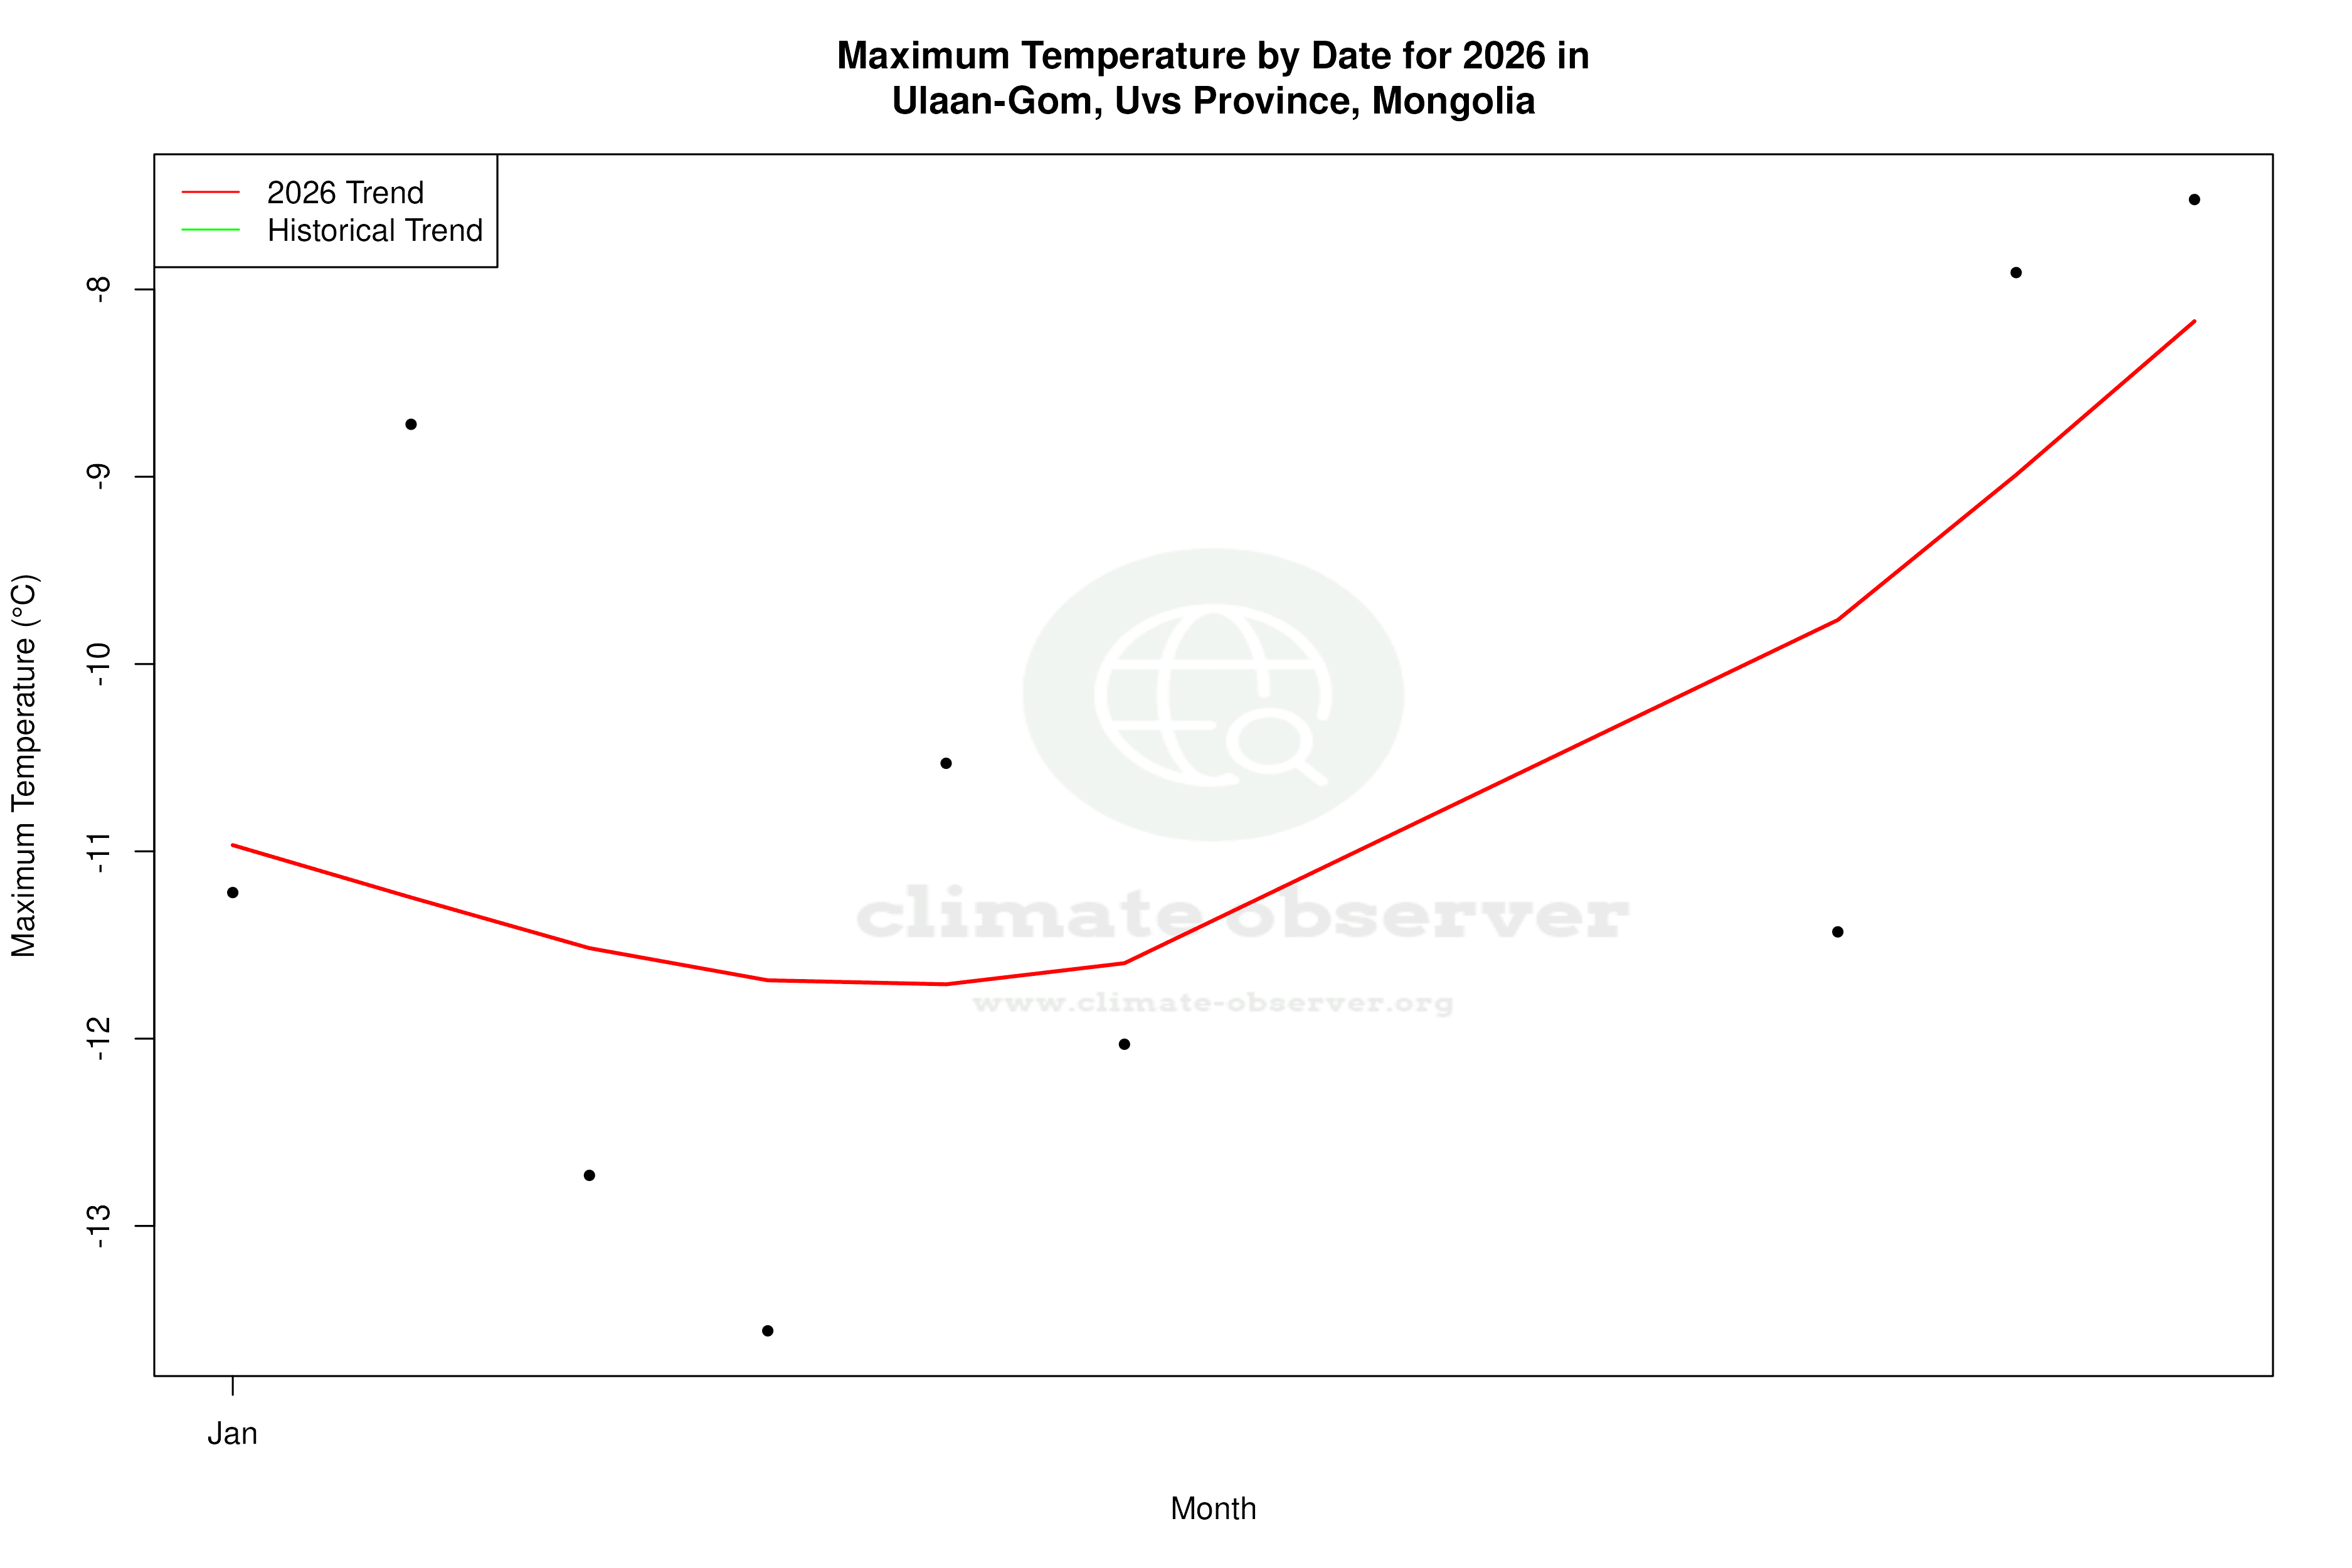


Max Temperature this Year | 1 of 6
Climate 12-Month Moving Averages
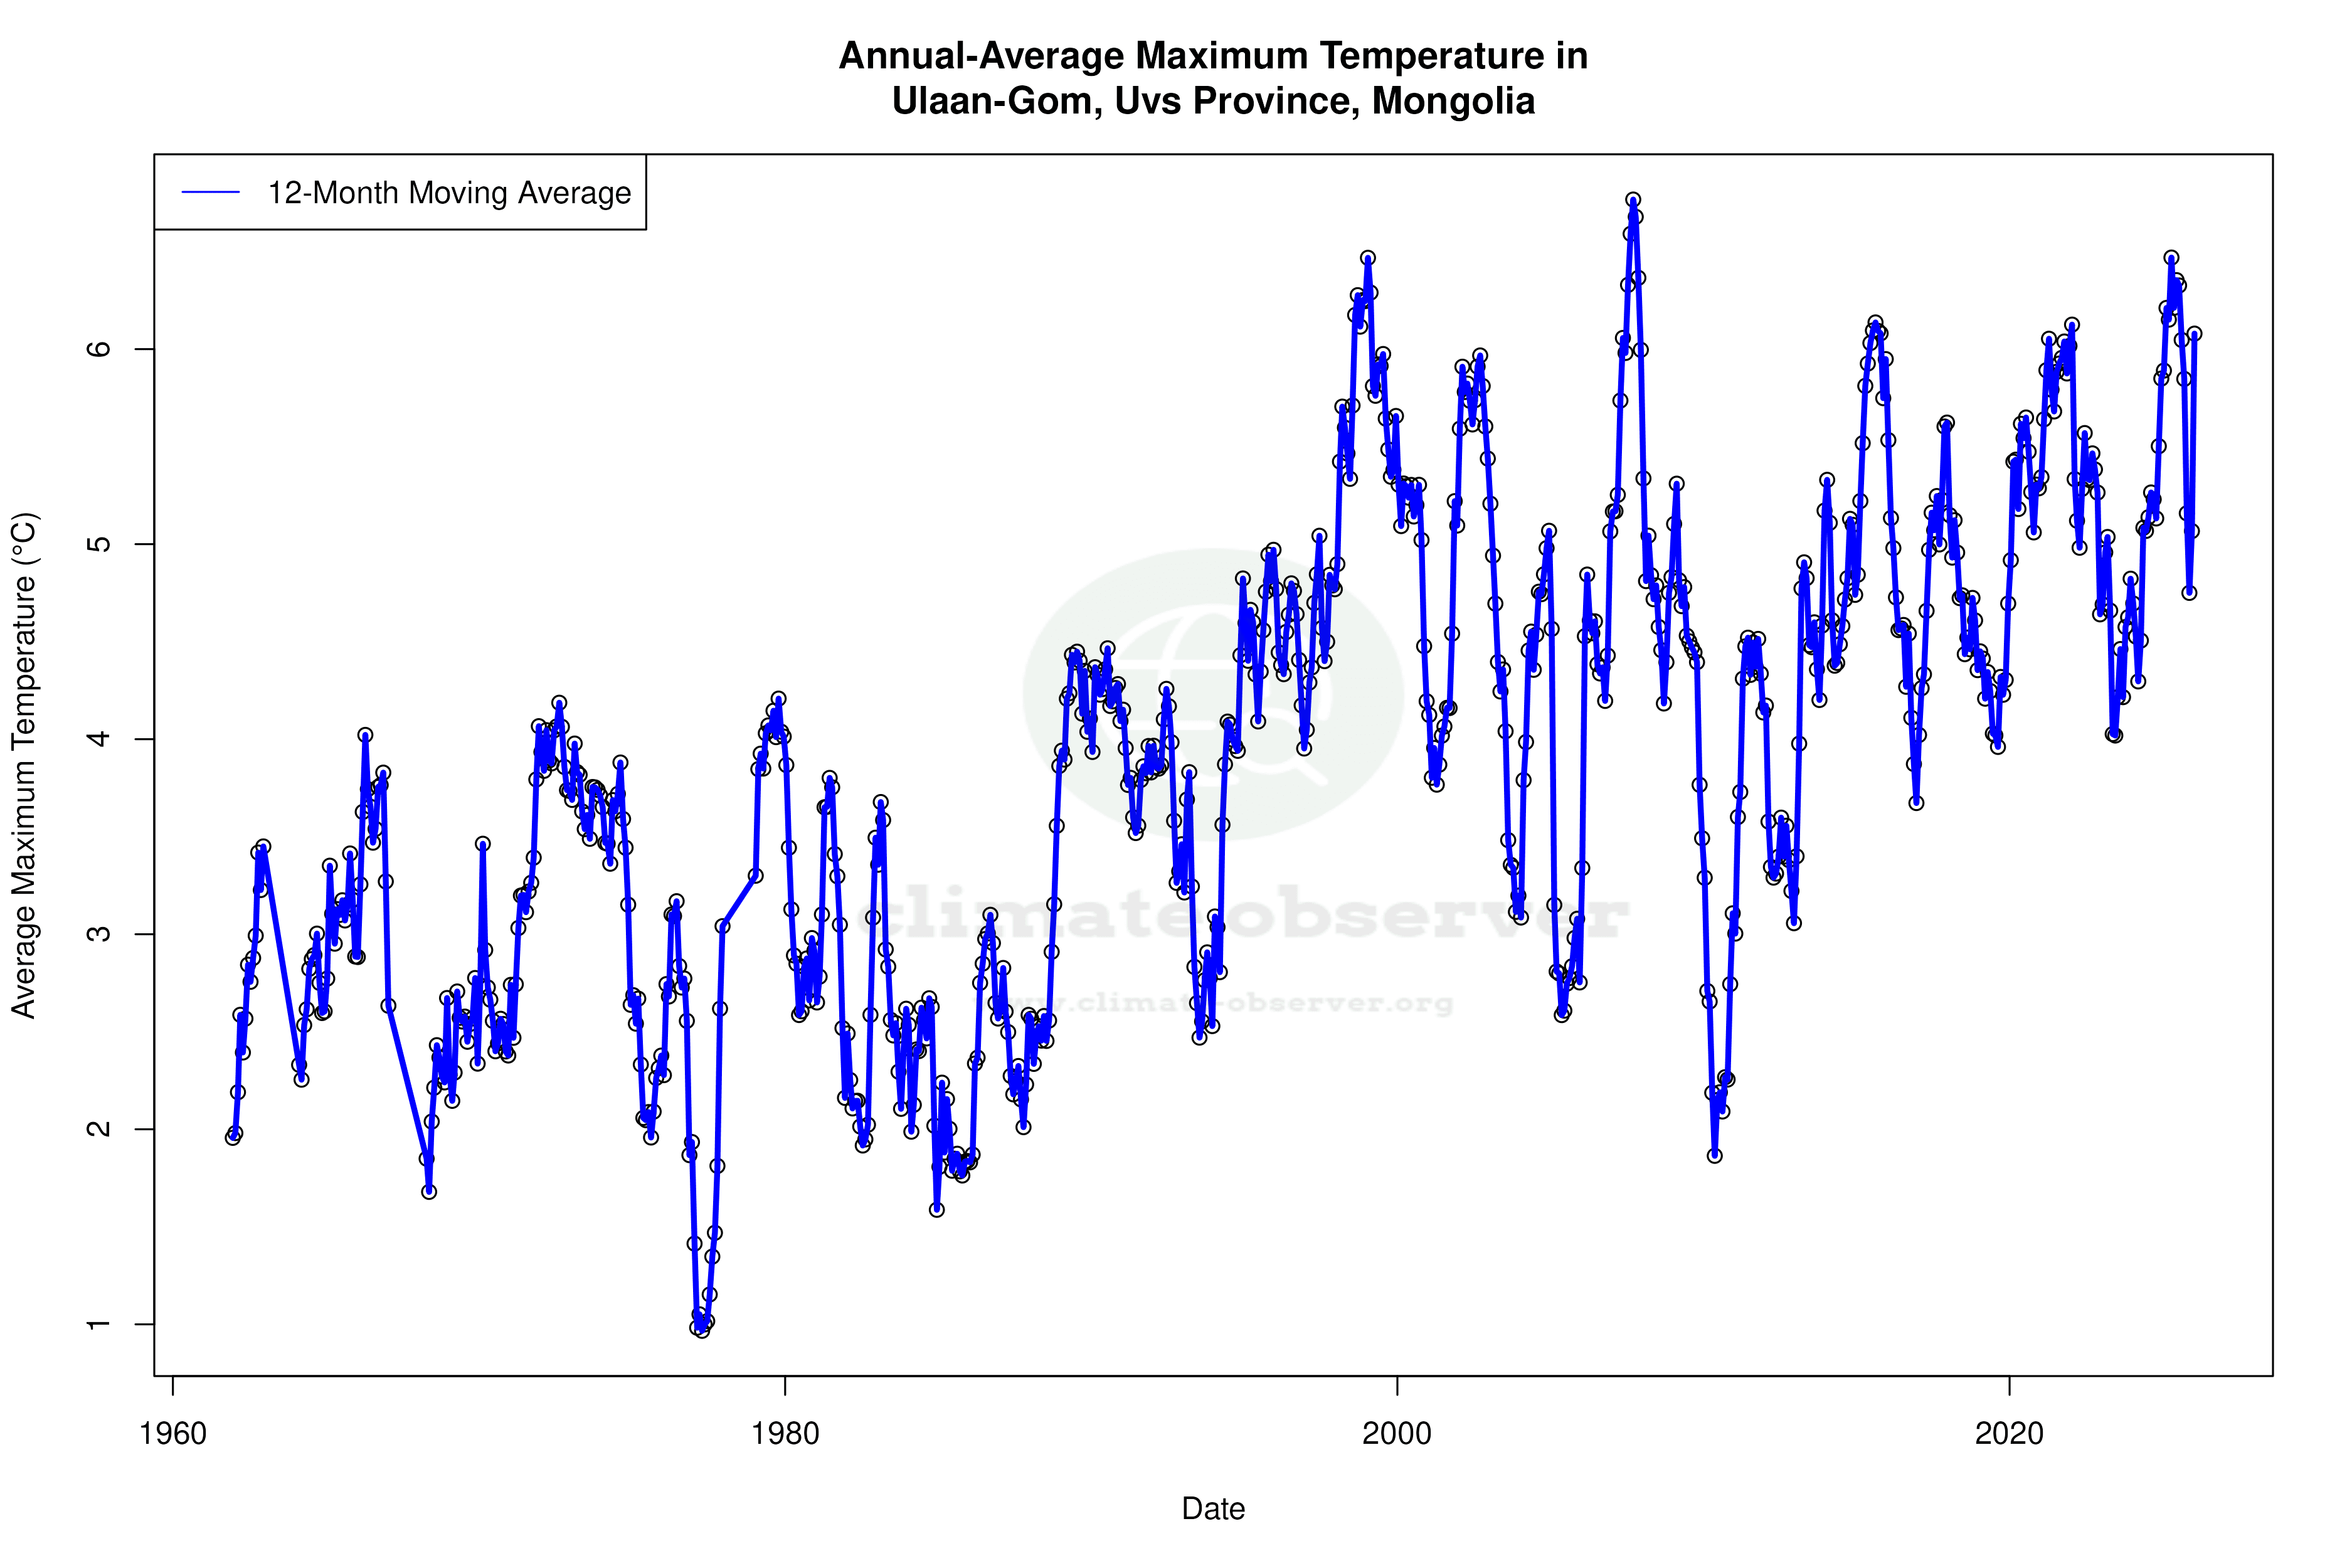


Max Temperature 12-Month MA | 1 of 6
Daily Data Points and Averages Throughout the Year


Average Max Temperature Throughout Year | 1 of 5
