Climate for Station: Choibalsan, Dornod Province, Mongolia
Loading live weather...
Climate Analysis & Overview
Choibalsan is experiencing a complex climate narrative, with a notable warming trend in low temperatures and a slight cooling in highs over the past decade. The region's precipitation is becoming more concentrated, indicating shifts in weather patterns that could impact local ecosystems and agriculture.
Climate Classification and Geographic Influence
Choibalsan, situated in eastern Mongolia, falls under the Köppen climate classification of BSk, indicating a cold semi-arid climate. The region is characterised by its vast steppe landscape, with minimal influence from large bodies of water, leading to significant temperature fluctuations. The local geography, including the nearby Khentii Mountains, plays a role in moderating some climatic extremes, although the area remains predominantly dry and exposed to continental weather patterns.
Temperature Trends: A Dual Narrative
The temperature trends in Choibalsan present a dual narrative. Over the past decade, high temperatures have shown a slight cooling trend of -0.13°C (-0.23°F), contrasting with the all-time warming trend of 0.16°C (0.29°F). This suggests a recent shift that could be attributed to short-term climatic variability. In contrast, low temperatures have risen significantly by 1.63°C (2.93°F) over the past ten years, aligning with the all-time warming trend of 0.37°C (0.67°F). This increase in low temperatures could lead to milder winters, impacting the local flora and fauna adapted to harsher conditions.
Precipitation Patterns: A Concentrated Shift
The Precipitation Concentration Index (PCI) for Choibalsan has experienced a slight increase from a baseline of 20.09 to a current value of 20.59. This indicates that precipitation events are becoming more concentrated, occurring in fewer, more intense episodes. Such a pattern can lead to challenges in water management and agriculture, as the region may face periods of drought interspersed with heavy rainfall, affecting crop yields and soil erosion.
Temperature Extremes and Records
Choibalsan has recorded extreme temperatures, with an all-time high of 41.9°C (107.4°F) and a low of -39.6°C (-39.3°F). These extremes highlight the region's susceptibility to significant temperature variations, a characteristic feature of its semi-arid climate. The ability of local communities and ecosystems to adapt to these extremes will be critical in the face of ongoing climate changes.
Regional Climate Goals and Implications
Mongolia's regional climate goals focus on sustainable development and adaptation strategies to mitigate the impacts of climate change. The warming trend in low temperatures and the increasing concentration of precipitation events in Choibalsan underscore the need for adaptive measures. These could include improved water management systems and agricultural practices tailored to the evolving climate conditions. As Mongolia continues to navigate its climate future, understanding these localised trends will be essential for effective policy-making and community resilience.
Station Statistics
10-Year Trend
High: -0.98 °F/decade
Low: +2.85 °F/decade
Rain: +0.019 in/decade
25-Year Trend
High: +0.86 °F/decade
Low: +0.95 °F/decade
Rain: +0.011 in/decade
50-Year Trend
High: +0.33 °F/decade
Low: +0.59 °F/decade
Rain: +0.004 in/decade
All-Time Trend
High: +0.28 °F/decade
Low: +0.67 °F/decade
Rain: +0.002 in/decade
Percentage Above-Average Days
Last 12 Months: 51.8%
This Year: 55.9%
Precipitation Concentration Index (PCI) ℹ️
Last 12 Months: 19.2
Historical Average: 22.7
Percentile Rank of Last 12 Months ℹ️
High: 46th percentile
Low: 99th percentile
Rain: 98th percentile
Change in Variance ℹ️
High: +0.3%
Low: -3.7%
Intraday: +2.1%
Data Coverage
92.7%
First Year of Data
1956
Station Location
Historical Weather Records
| Max High | Avg High | Min High | Max Avg | Avg Avg | Min Avg | Max Low | Avg Low | Min Low | Max Precipitation | Avg Precipitation | Max Snow | Avg Snow | |
|---|---|---|---|---|---|---|---|---|---|---|---|---|---|
| Record | 107.42 °F | — | -26.68 °F | 91.58 °F | — | -31.00 °F | 75.43 °F | — | -39.28 °F | 2.83 in | — | — | — |
| January | 36.50 °F | 6.38 °F | -26.68 °F | 19.40 °F | -4.24 °F | -31.00 °F | 12.38 °F | -12.83 °F | -37.30 °F | 0.25 in | 0.00 in | — | — |
| February | 47.48 °F | 14.80 °F | -22.72 °F | 32.54 °F | 3.06 °F | -30.64 °F | 24.44 °F | -8.27 °F | -39.28 °F | 0.31 in | 0.00 in | — | — |
| March | 70.52 °F | 31.97 °F | -4.72 °F | 55.94 °F | 20.05 °F | -18.04 °F | 40.82 °F | 7.97 °F | -32.98 °F | 0.35 in | 0.00 in | — | — |
| April | 88.70 °F | 51.55 °F | 18.86 °F | 67.82 °F | 39.05 °F | 10.94 °F | 53.24 °F | 25.76 °F | -4.54 °F | 1.10 in | 0.01 in | — | — |
| May | 98.24 °F | 66.79 °F | 33.08 °F | 82.94 °F | 53.85 °F | 26.06 °F | 68.18 °F | 39.63 °F | 16.34 °F | 1.02 in | 0.02 in | — | — |
| June | 106.16 °F | 77.52 °F | 49.10 °F | 89.60 °F | 65.37 °F | 37.76 °F | 72.32 °F | 52.42 °F | 30.38 °F | 2.01 in | 0.05 in | — | — |
| July | 105.98 °F | 81.18 °F | 57.56 °F | 91.04 °F | 69.91 °F | 52.16 °F | 75.43 °F | 58.83 °F | 39.92 °F | 2.83 in | 0.09 in | — | — |
| August | 107.42 °F | 77.20 °F | 53.24 °F | 91.58 °F | 65.70 °F | 43.88 °F | 73.71 °F | 54.43 °F | 32.29 °F | 2.61 in | 0.07 in | — | — |
| September | 93.38 °F | 65.76 °F | 33.08 °F | 78.08 °F | 53.15 °F | 28.40 °F | 69.08 °F | 41.26 °F | 15.26 °F | 1.46 in | 0.04 in | — | — |
| October | 82.40 °F | 48.42 °F | 12.92 °F | 65.12 °F | 35.96 °F | 3.02 °F | 59.18 °F | 25.03 °F | -5.80 °F | 0.70 in | 0.01 in | — | — |
| November | 61.70 °F | 26.06 °F | -5.08 °F | 42.44 °F | 15.04 °F | -14.44 °F | 35.60 °F | 5.95 °F | -21.82 °F | 0.51 in | 0.01 in | — | — |
| December | 41.72 °F | 10.15 °F | -20.20 °F | 31.28 °F | 0.62 °F | -25.60 °F | 18.68 °F | -7.55 °F | -33.52 °F | 0.28 in | 0.00 in | — | — |
Data Visualisations
Remove WatermarksCurrent Year Climate Trends vs Historical

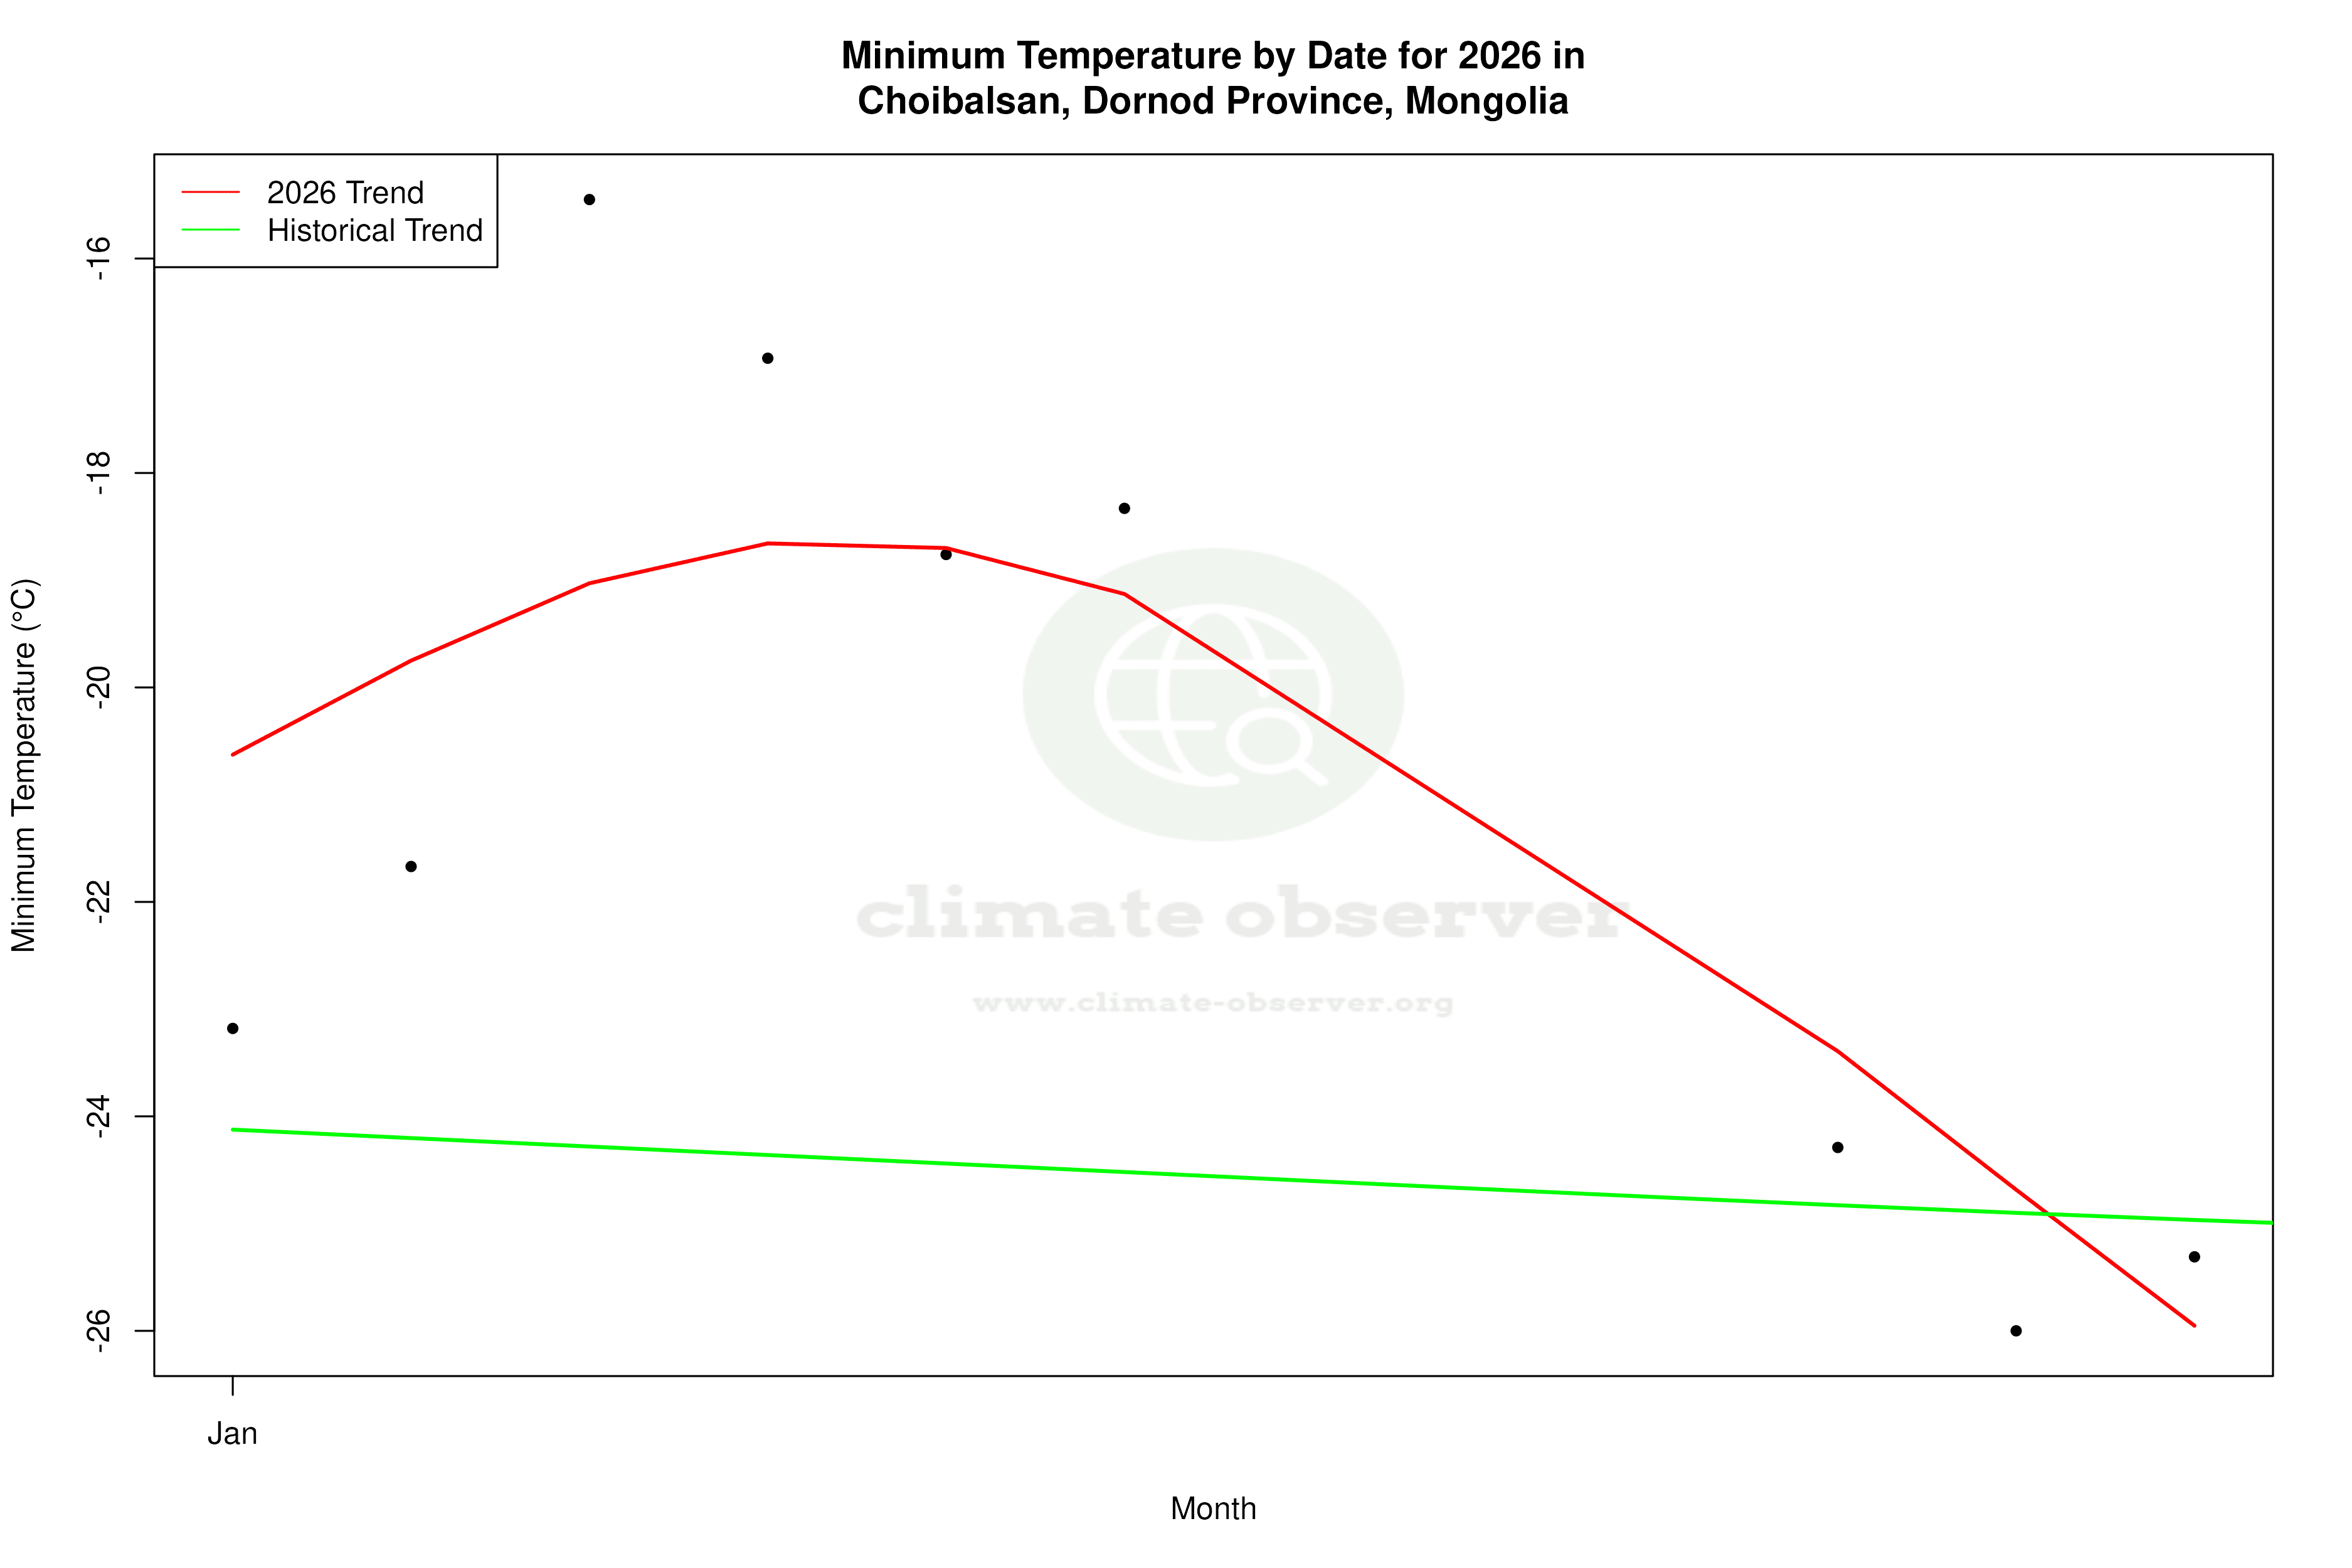


Max Temperature this Year | 1 of 6
Climate 12-Month Moving Averages


Max Temperature 12-Month MA | 1 of 6
Daily Data Points and Averages Throughout the Year


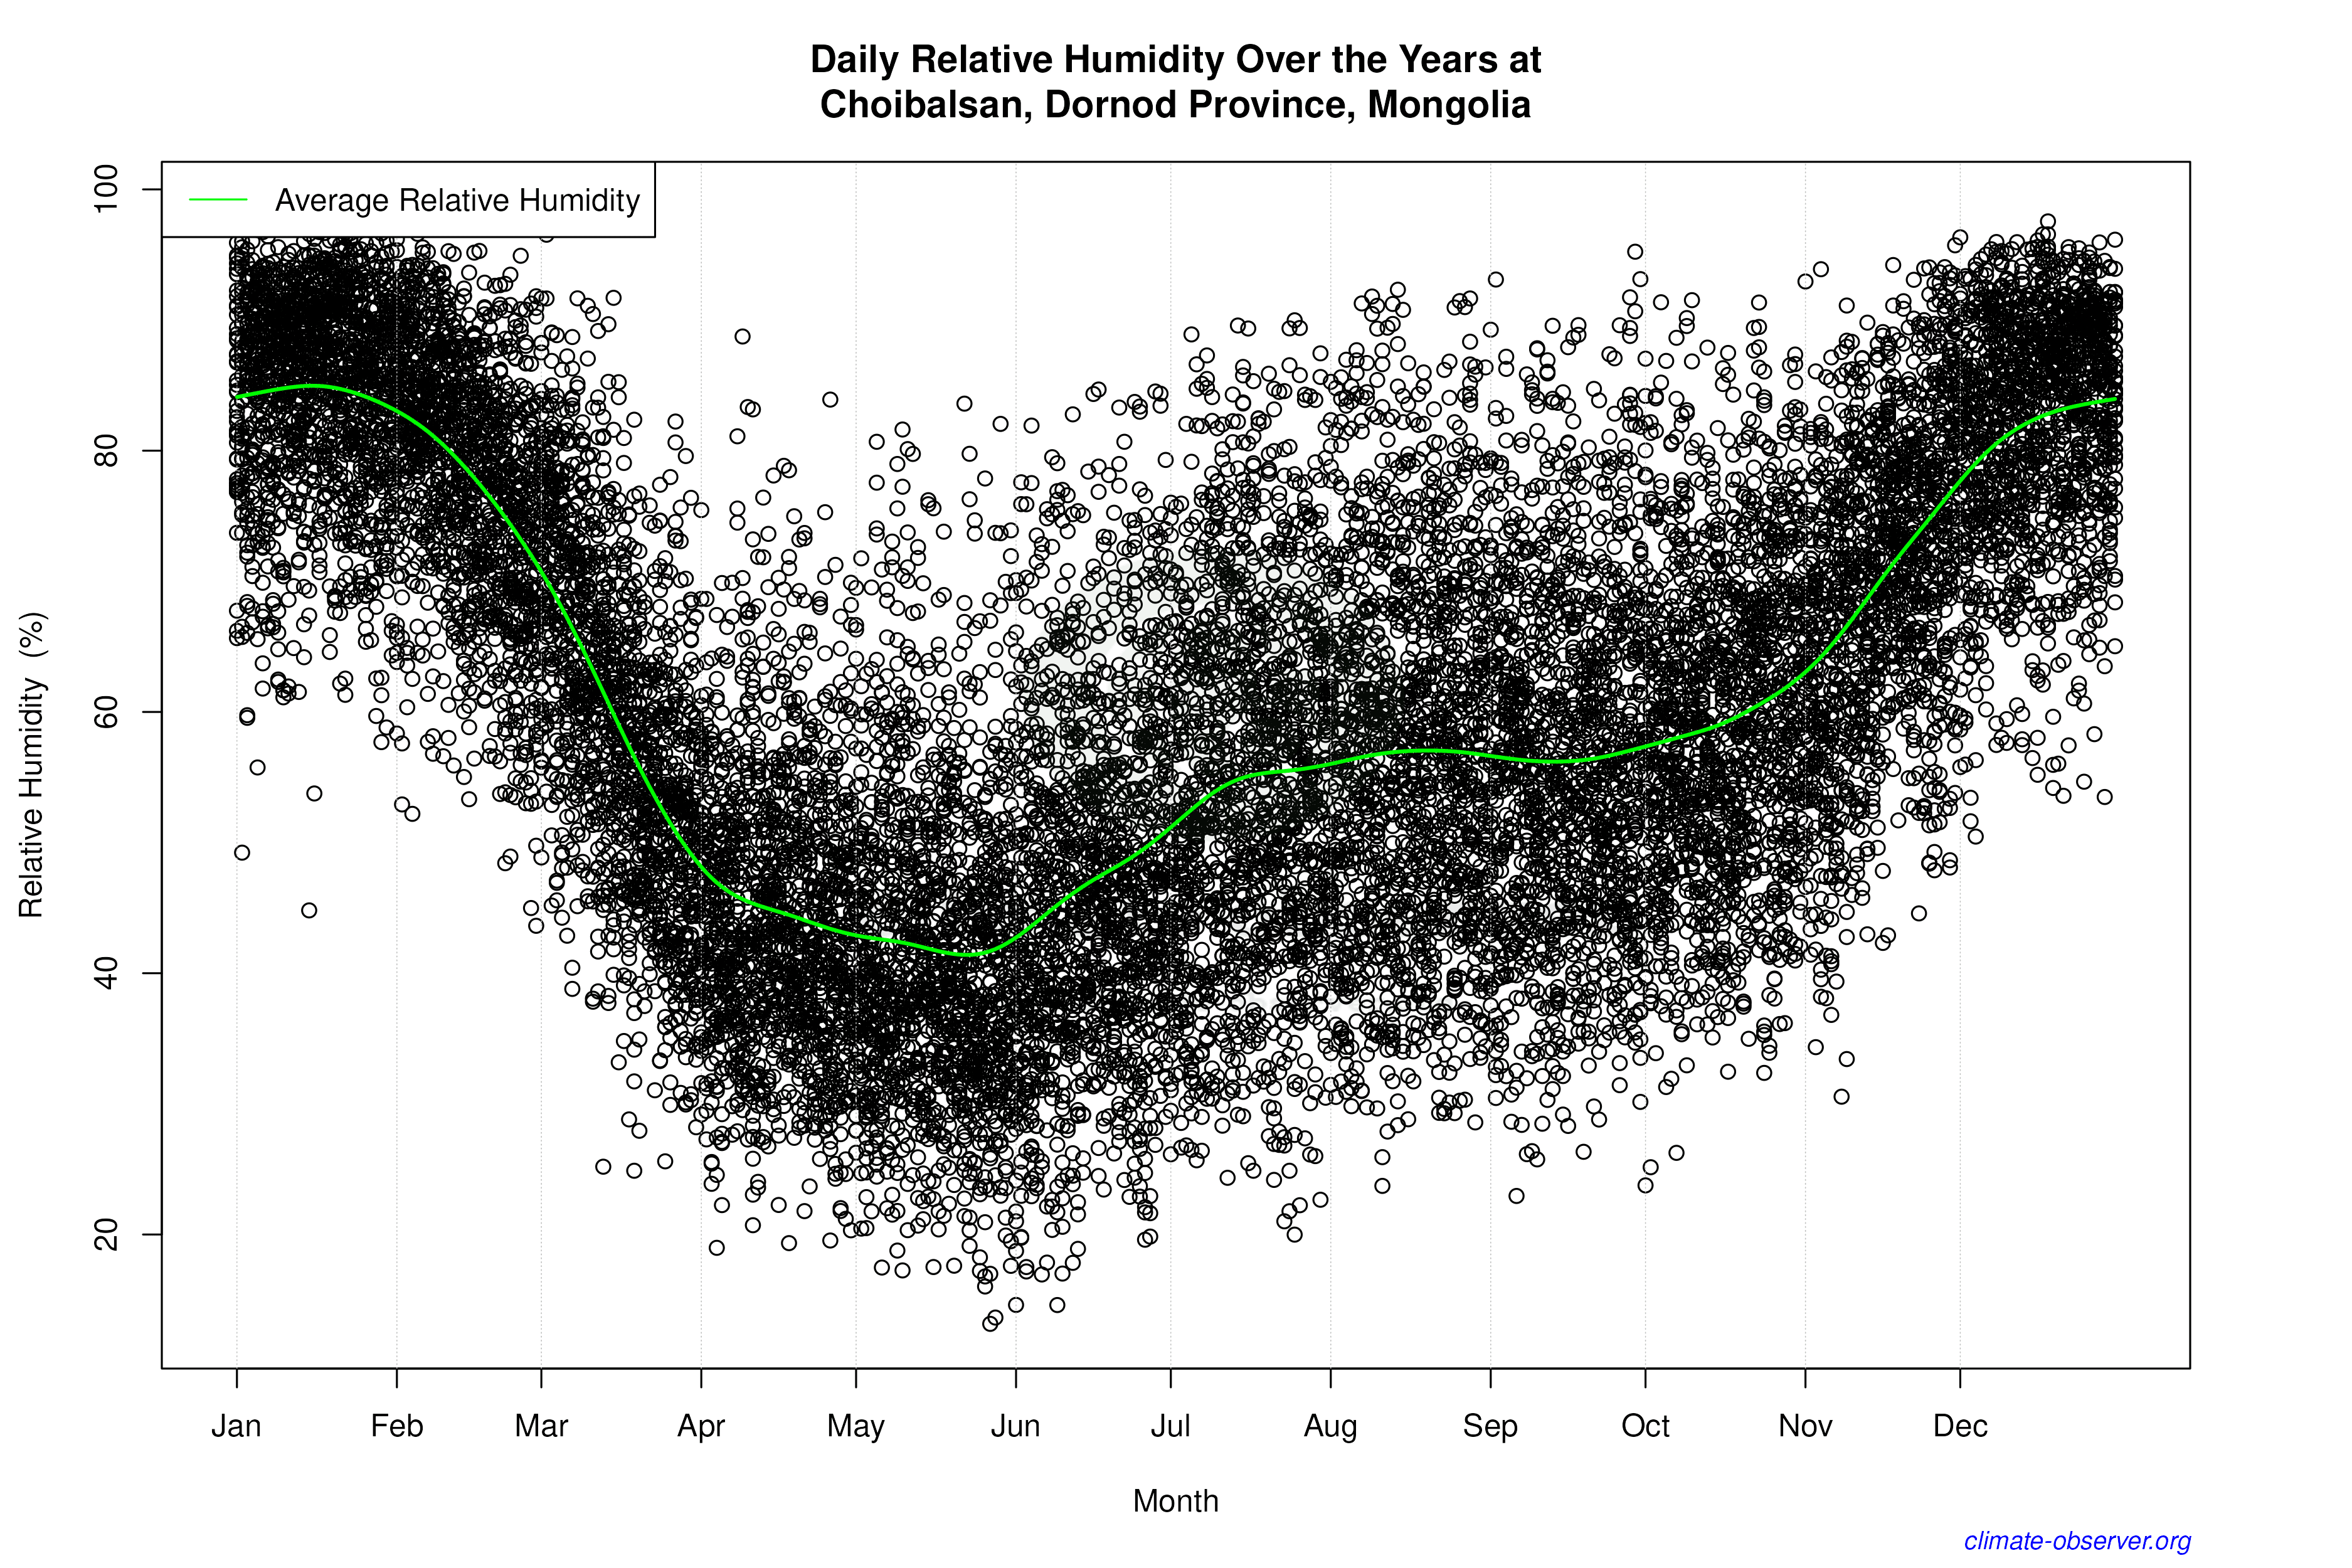

Average Max Temperature Throughout Year | 1 of 5
