Climate for Station: Ambodedjo, Mopti Region, Mali
Loading live weather...
Climate Analysis & Overview
Ambodedjo, located in Mali, is experiencing a warming trend, particularly noticeable in nighttime temperatures. The region shows a slight shift towards more evenly distributed precipitation, which may influence local agricultural practices. These trends align with Mali's broader climate adaptation goals.
Desert Climate Dynamics
Ambodedjo, situated at coordinates 14.513, -4.08, falls under the BSh classification of the Köppen climate system, indicating a hot semi-arid climate. The region's flat topography and proximity to the Niger River contribute to its climatic conditions. The all-time temperature trends reveal a warming of 0.14°C (0.25°F) for highs and a smaller increase of 0.05°C (0.10°F) for lows, suggesting a gradual rise in temperature over the years. This warming is consistent with global climate patterns, although the increase in lows is notably less pronounced.
Recent Temperature Shifts
Over the past decade, Ambodedjo has experienced more significant temperature changes. Highs have increased by 0.51°C (0.92°F), while lows have risen by a more substantial 1.34°C (2.41°F). This indicates that nighttime temperatures are rising faster than daytime temperatures, a trend observed in various parts of the world attributed to increased greenhouse gas concentrations. Such changes can have profound effects on local ecosystems and agriculture, potentially altering growing seasons and crop viability.
Precipitation Patterns and PCI
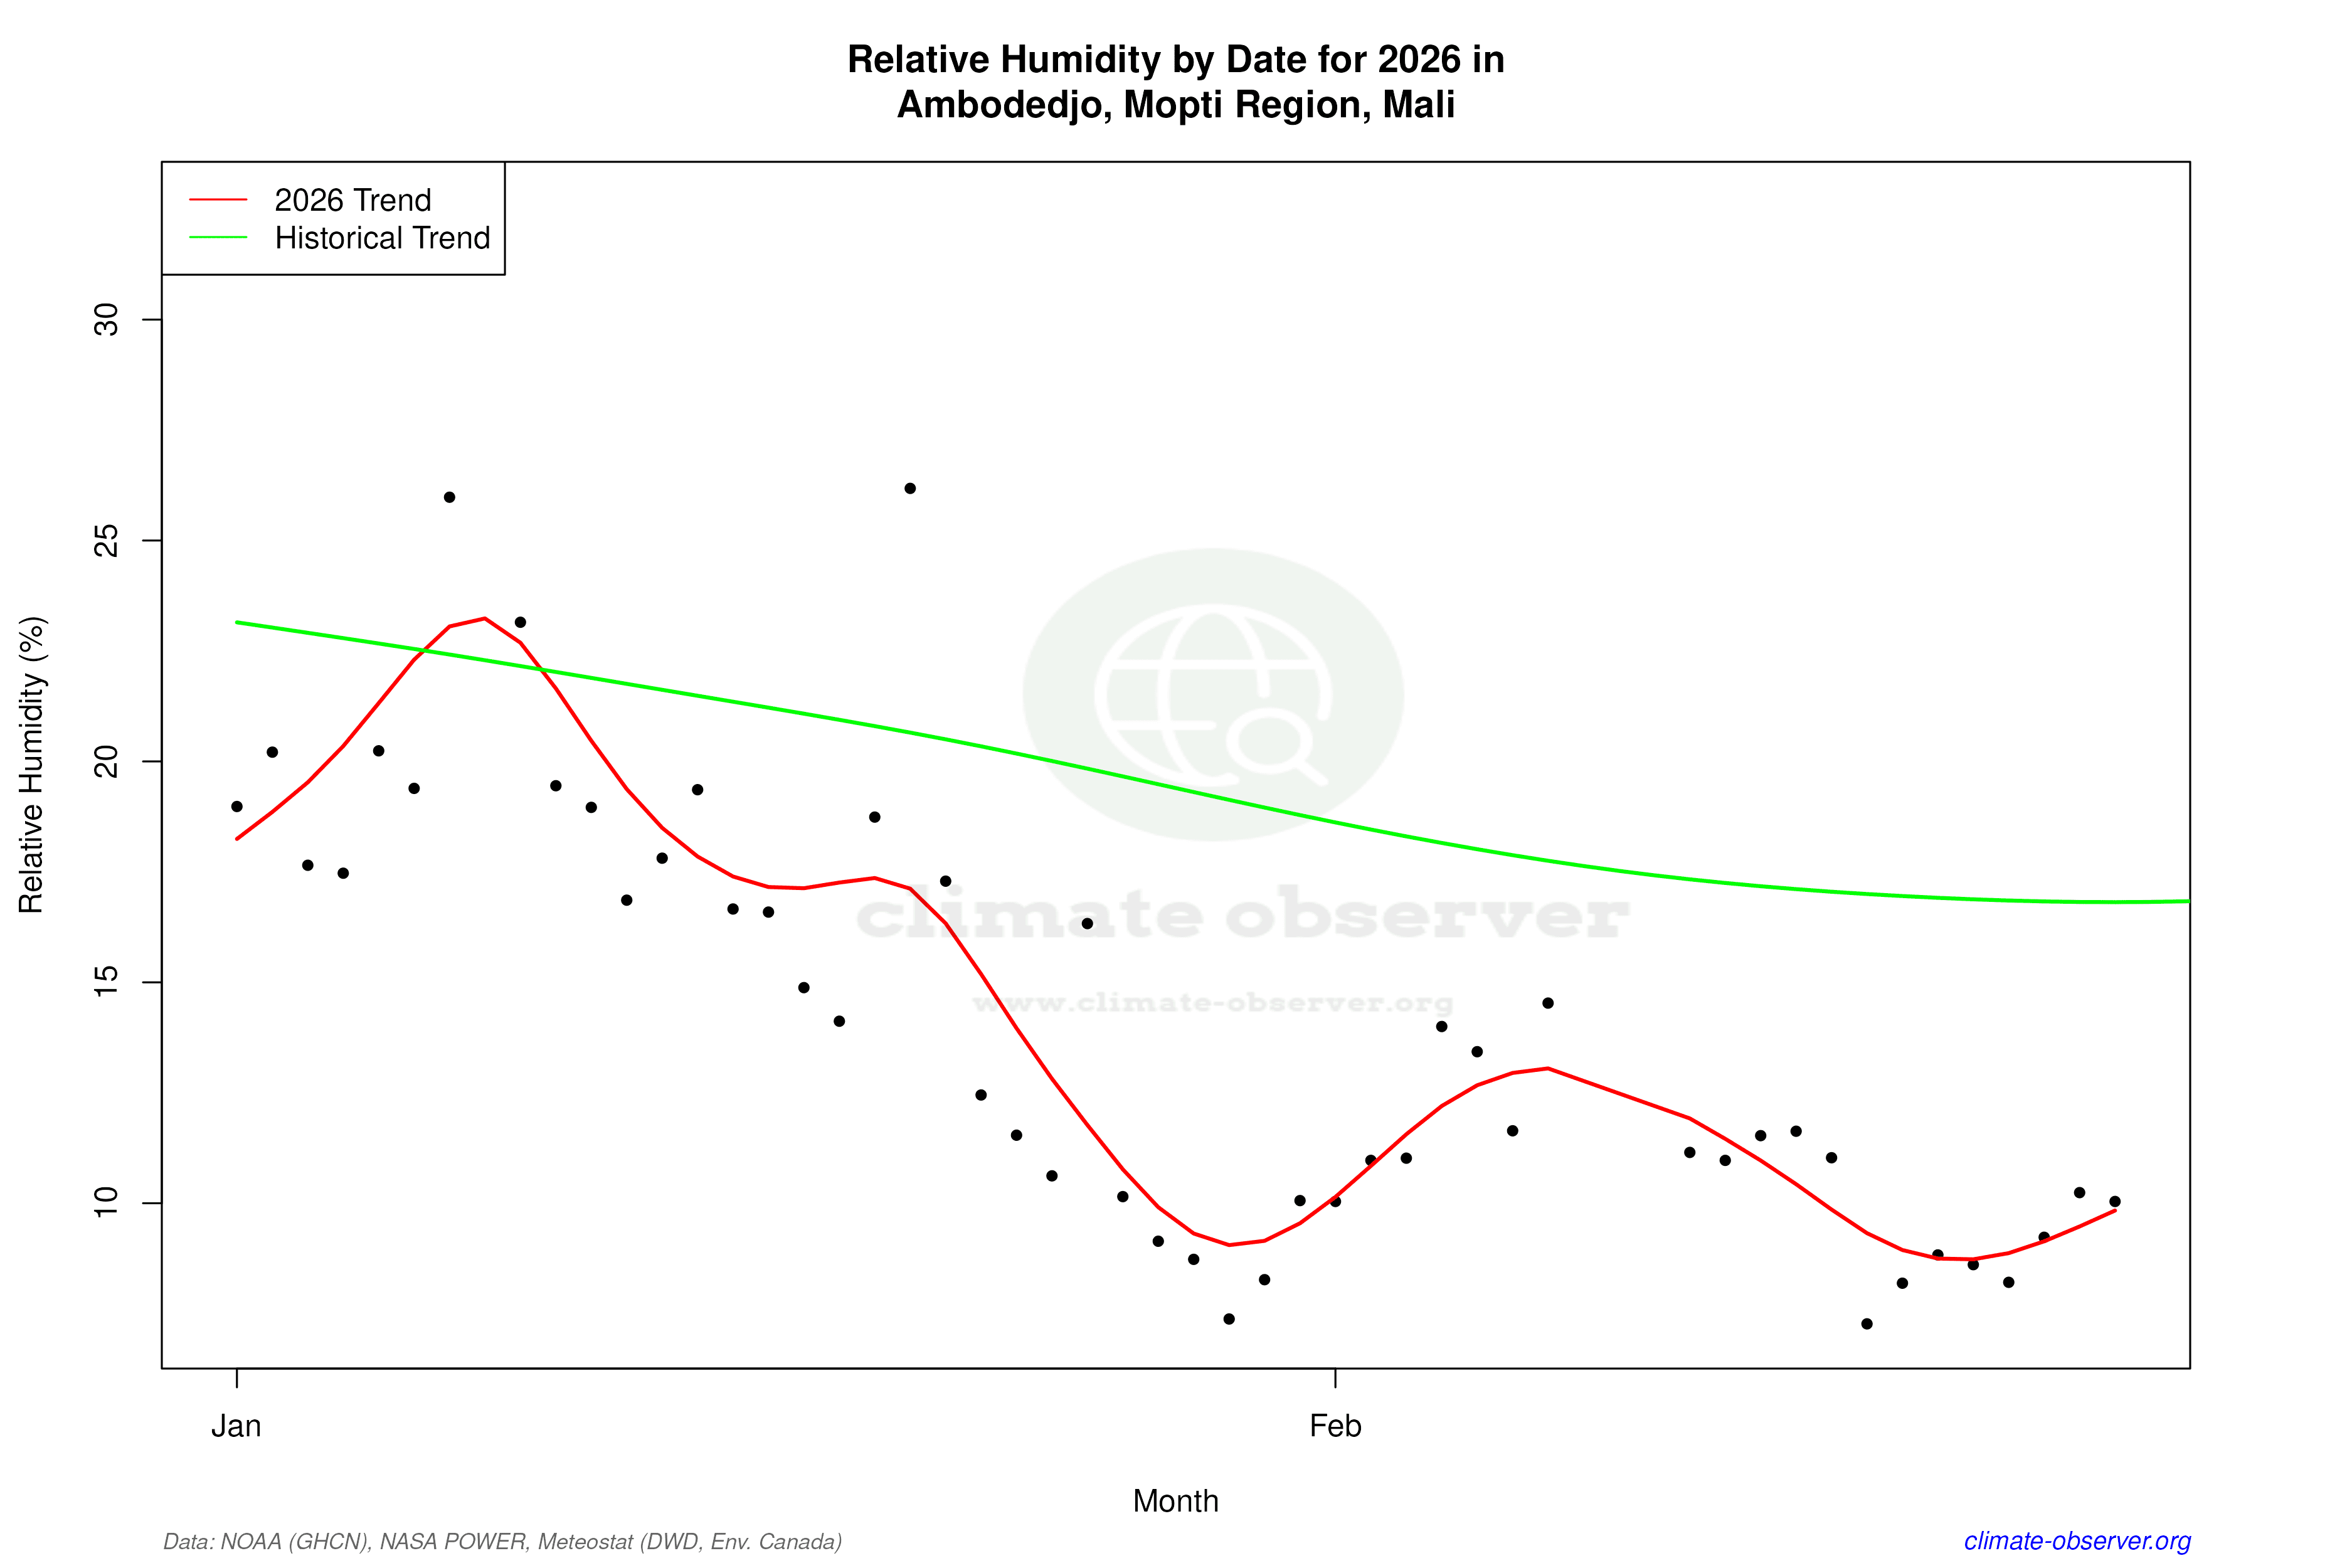
The Precipitation Concentration Index (PCI) for Ambodedjo has decreased from a baseline of 24.8 to a current value of 22.1, indicating a slight shift towards more evenly distributed rainfall events. A PCI above 20 still signifies highly concentrated precipitation, but the observed decrease suggests a trend towards less intense, more frequent rainfall. This could benefit local agriculture by reducing the risk of droughts and improving soil moisture retention, aligning with Mali's climate adaptation strategies to enhance food security.
Temperature Extremes
Ambodedjo's record temperatures highlight the extremes of its climate. The highest recorded temperature is 51.5°C (124.7°F), while the lowest is 7.7°C (45.9°F). These extremes underscore the challenges faced by the region in terms of heat management and the potential for cold spells, although the latter is less frequent. The ability to manage such extremes is crucial for the resilience of local communities and infrastructure.
Regional Implications
The observed climatic changes in Ambodedjo are part of broader regional trends that Mali is addressing through its climate action plans. The emphasis on understanding and adapting to these changes is crucial for sustainable development. The warming trends, particularly in nighttime temperatures, and the shift towards more evenly distributed precipitation, offer both challenges and opportunities for local adaptation efforts.
Station Statistics
10-Year Trend
High: +0.32 °F/decade
Low: +2.03 °F/decade
Rain: -0.047 in/decade
25-Year Trend
High: -0.06 °F/decade
Low: +0.35 °F/decade
Rain: -0.000 in/decade
50-Year Trend
High: +0.23 °F/decade
Low: +0.09 °F/decade
Rain: +0.002 in/decade
All-Time Trend
High: +0.29 °F/decade
Low: +0.16 °F/decade
Rain: +0.001 in/decade
Percentage Above-Average Days
Last 12 Months: 43.9%
This Year: 59.7%
Precipitation Concentration Index (PCI) ℹ️
Last 12 Months: 29.0
Historical Average: 27.2
Percentile Rank of Last 12 Months ℹ️
High: 42nd percentile
Low: 87th percentile
Rain: 12th percentile
Change in Variance ℹ️
High: -5.9%
Low: +2.9%
Intraday: +6.2%
Data Coverage
79.5%
First Year of Data
1957
Station Location
Historical Weather Records
| Max High | Avg High | Min High | Max Avg | Avg Avg | Min Avg | Max Low | Avg Low | Min Low | Max Precipitation | Avg Precipitation | Max Snow | Avg Snow | |
|---|---|---|---|---|---|---|---|---|---|---|---|---|---|
| Record | 124.70 °F | — | 69.85 °F | 108.86 °F | — | 55.04 °F | 94.28 °F | — | 45.86 °F | 5.55 in | — | — | — |
| January | 108.86 °F | 89.96 °F | 69.85 °F | 96.08 °F | 75.13 °F | 55.04 °F | 78.80 °F | 60.74 °F | 45.86 °F | 0.28 in | 0.00 in | — | — |
| February | 111.20 °F | 95.51 °F | 73.04 °F | 99.14 °F | 80.64 °F | 63.32 °F | 82.22 °F | 65.61 °F | 47.84 °F | 0.06 in | 0.00 in | — | — |
| March | 120.20 °F | 101.33 °F | 78.98 °F | 101.84 °F | 86.96 °F | 68.36 °F | 91.04 °F | 72.46 °F | 50.00 °F | 0.24 in | 0.00 in | — | — |
| April | 124.70 °F | 105.48 °F | 84.20 °F | 108.86 °F | 92.30 °F | 74.48 °F | 92.48 °F | 78.63 °F | 59.00 °F | 0.47 in | 0.01 in | — | — |
| May | 119.30 °F | 106.07 °F | 84.72 °F | 106.52 °F | 93.96 °F | 77.72 °F | 94.28 °F | 82.11 °F | 67.10 °F | 0.94 in | 0.03 in | — | — |
| June | 116.06 °F | 101.82 °F | 80.96 °F | 102.74 °F | 90.59 °F | 76.82 °F | 93.38 °F | 80.35 °F | 64.40 °F | 2.95 in | 0.09 in | — | — |
| July | 111.92 °F | 95.35 °F | 78.80 °F | 97.88 °F | 85.33 °F | 73.22 °F | 86.00 °F | 76.65 °F | 59.00 °F | 3.35 in | 0.18 in | — | — |
| August | 106.70 °F | 91.36 °F | 75.20 °F | 94.28 °F | 82.51 °F | 73.22 °F | 83.48 °F | 74.89 °F | 59.36 °F | 5.55 in | 0.26 in | — | — |
| September | 107.11 °F | 93.11 °F | 77.90 °F | 95.54 °F | 83.57 °F | 72.68 °F | 85.64 °F | 75.46 °F | 63.32 °F | 3.90 in | 0.15 in | — | — |
| October | 116.60 °F | 97.46 °F | 80.53 °F | 99.86 °F | 85.75 °F | 74.84 °F | 86.00 °F | 75.20 °F | 60.80 °F | 1.50 in | 0.03 in | — | — |
| November | 106.88 °F | 96.58 °F | 78.26 °F | 98.42 °F | 82.04 °F | 67.10 °F | 82.40 °F | 68.20 °F | 50.00 °F | 0.41 in | 0.00 in | — | — |
| December | 103.64 °F | 90.74 °F | 71.42 °F | 91.76 °F | 75.80 °F | 57.38 °F | 77.36 °F | 62.10 °F | 48.02 °F | 0.14 in | 0.00 in | — | — |
Data Visualisations
Remove WatermarksCurrent Year Climate Trends vs Historical


Max Temperature this Year | 1 of 6
Climate 12-Month Moving Averages


Max Temperature 12-Month MA | 1 of 6
Daily Data Points and Averages Throughout the Year


Average Max Temperature Throughout Year | 1 of 5
