Climate for Station: Nouasseur, Casablanca-Settat, Morocco
Loading live weather...
Climate Analysis & Overview
The climate profile for Nouasseur reveals a complex interplay of warming trends and precipitation shifts. Over the past decade, temperatures have risen significantly, with highs increasing by 1.68°C (3.02°F) and lows by 0.96°C (1.73°F). Meanwhile, a decrease in the Precipitation Concentration Index suggests a more even distribution of rainfall, contrasting with the broader regional warming trends.
A Warming Trend in Nouasseur
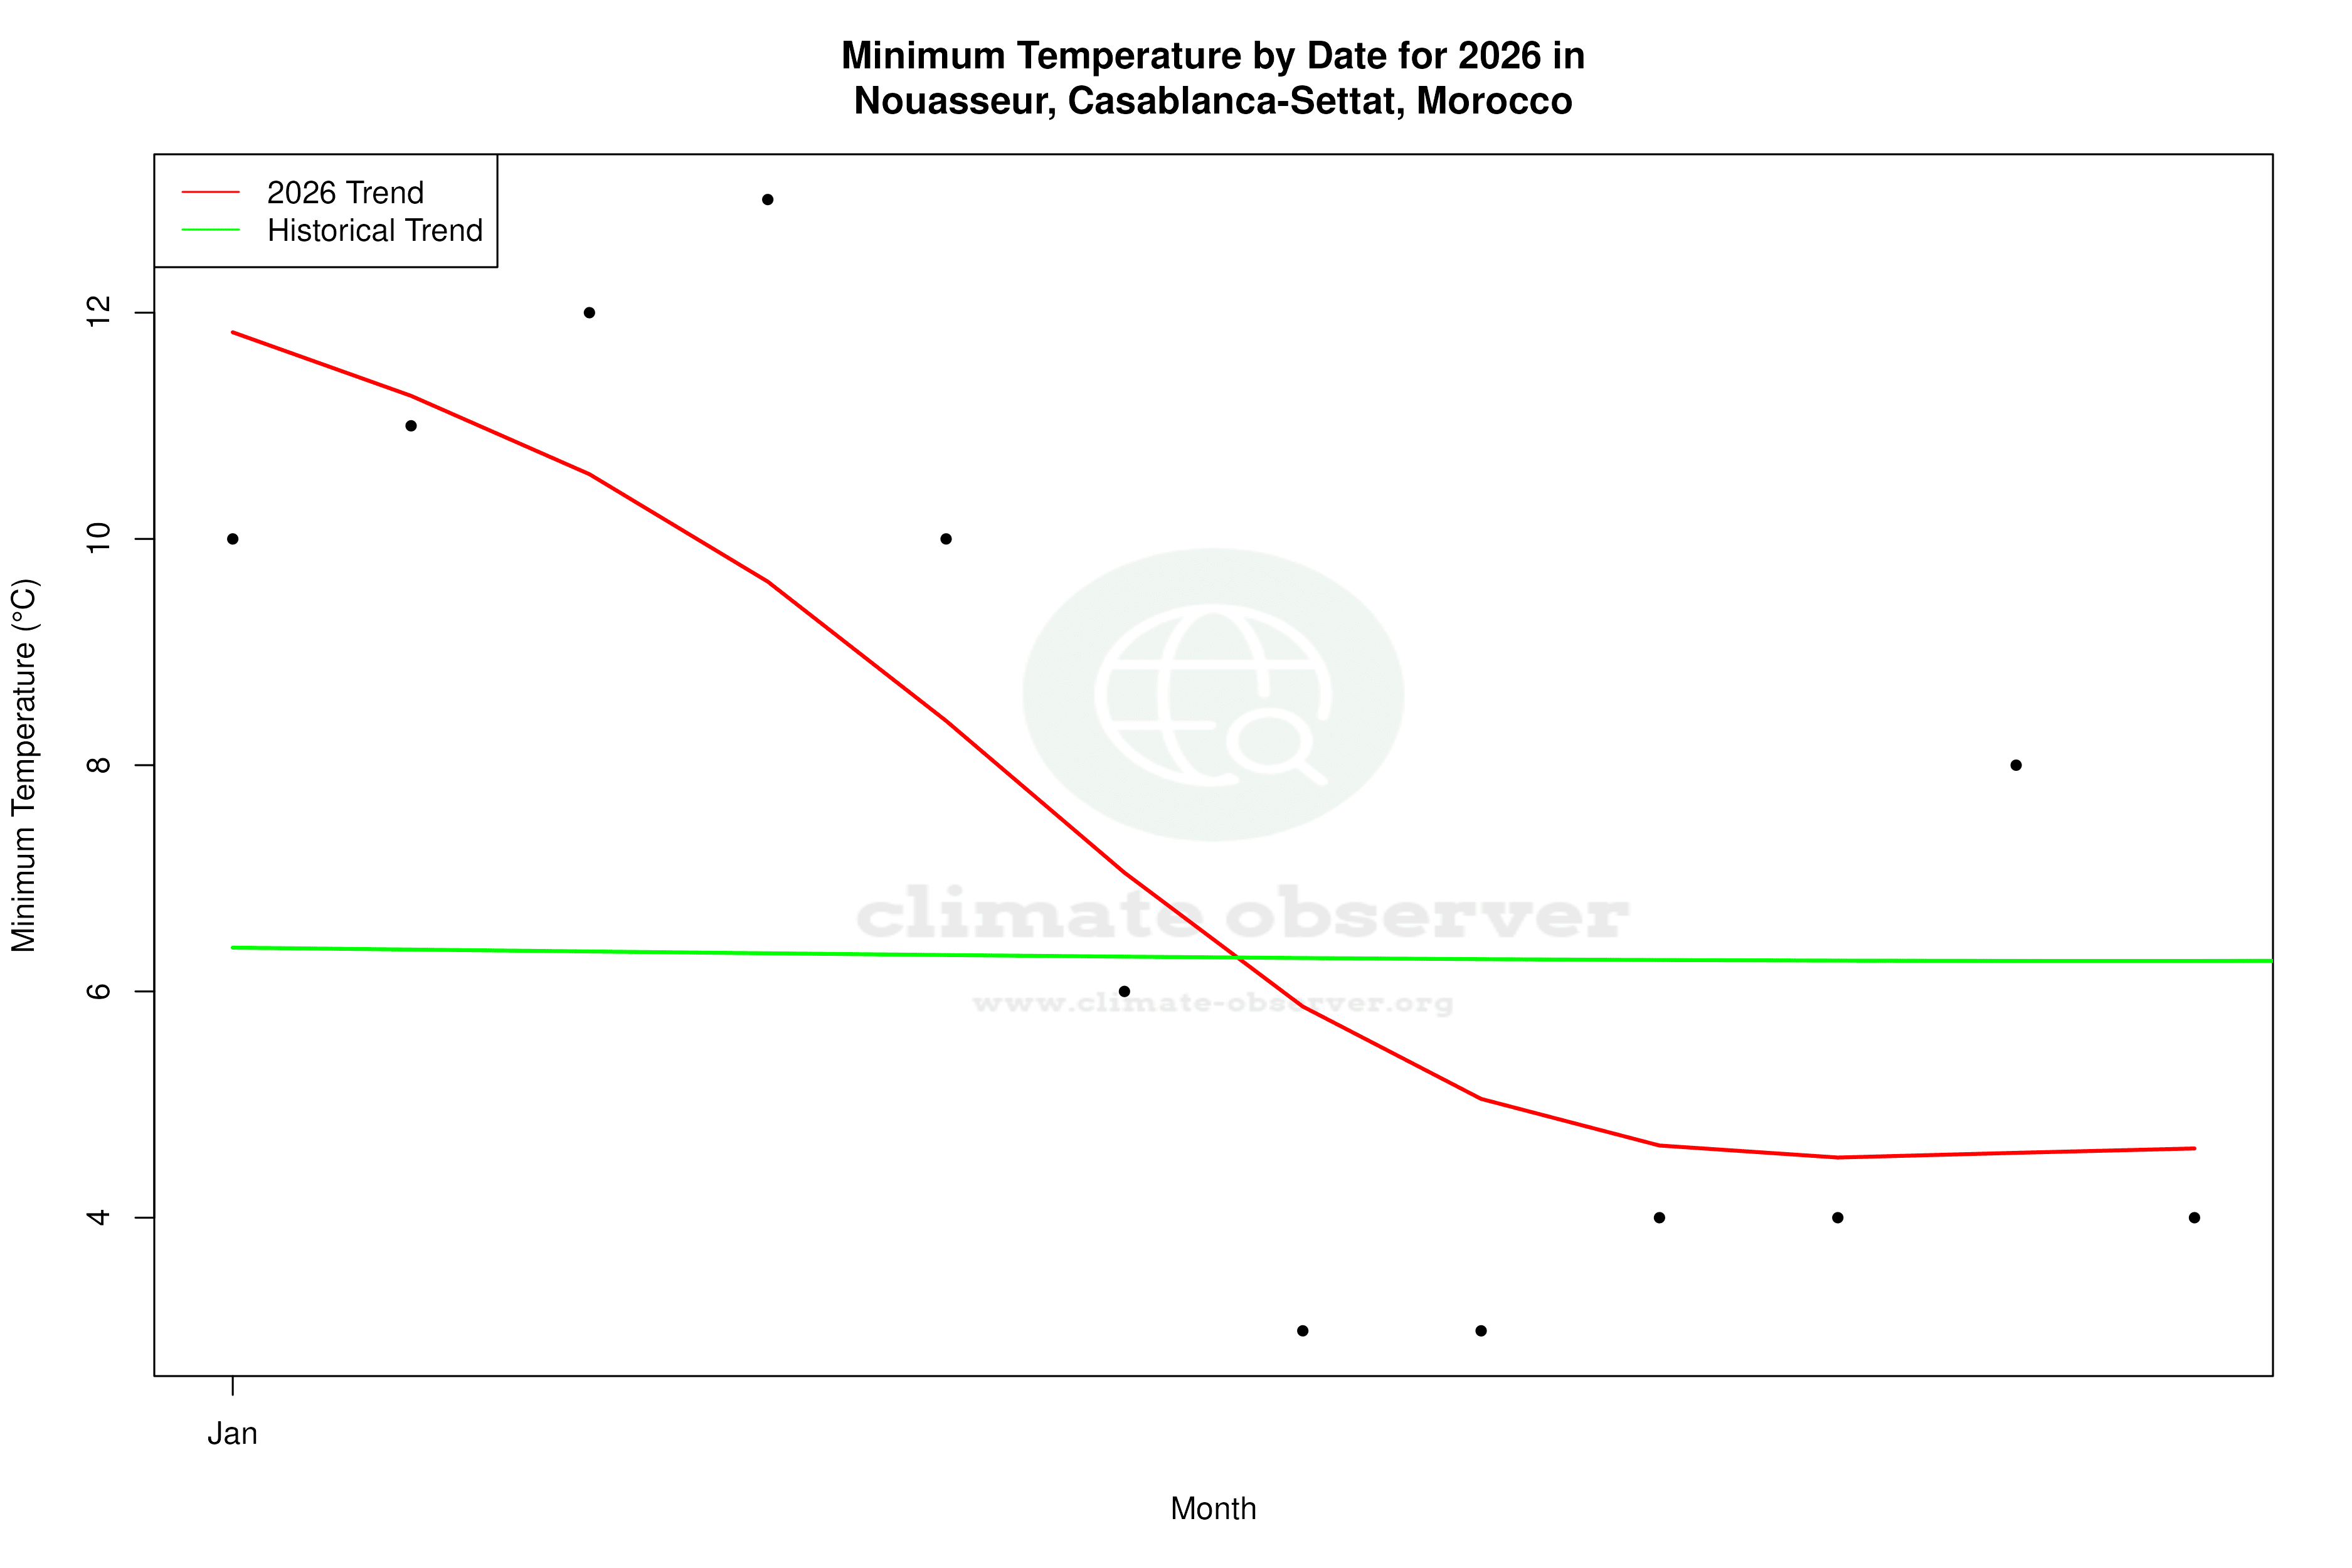
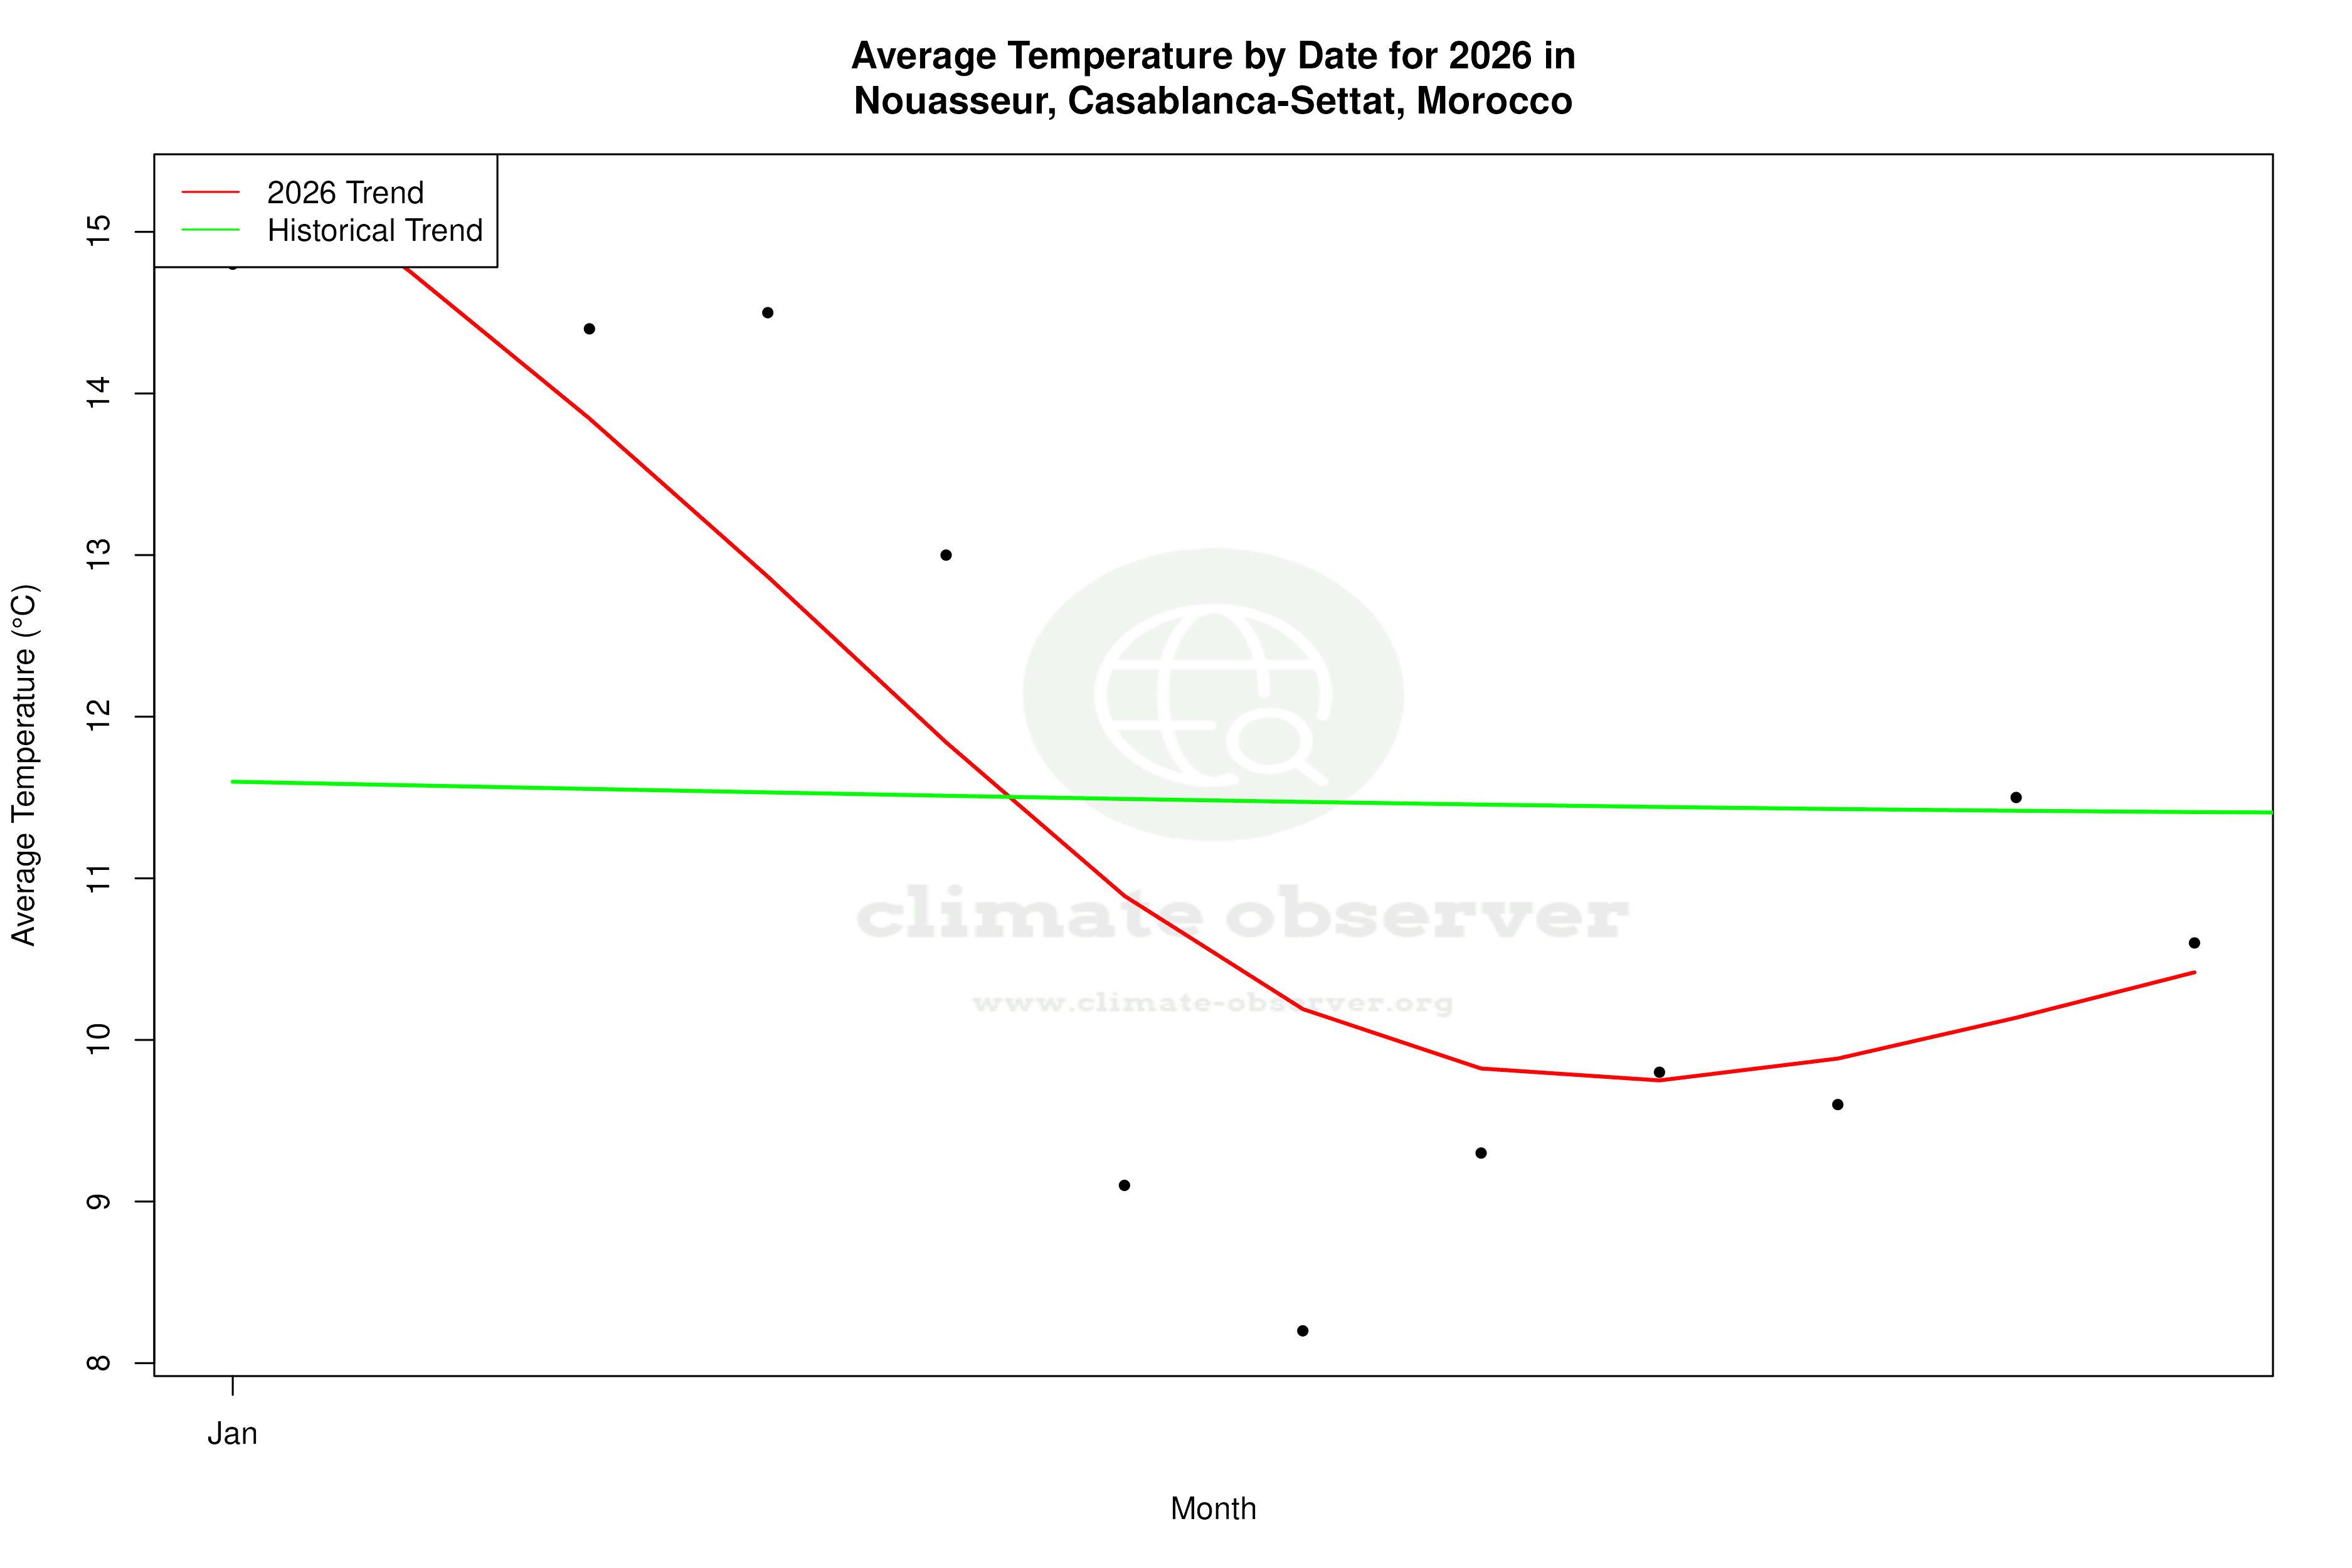
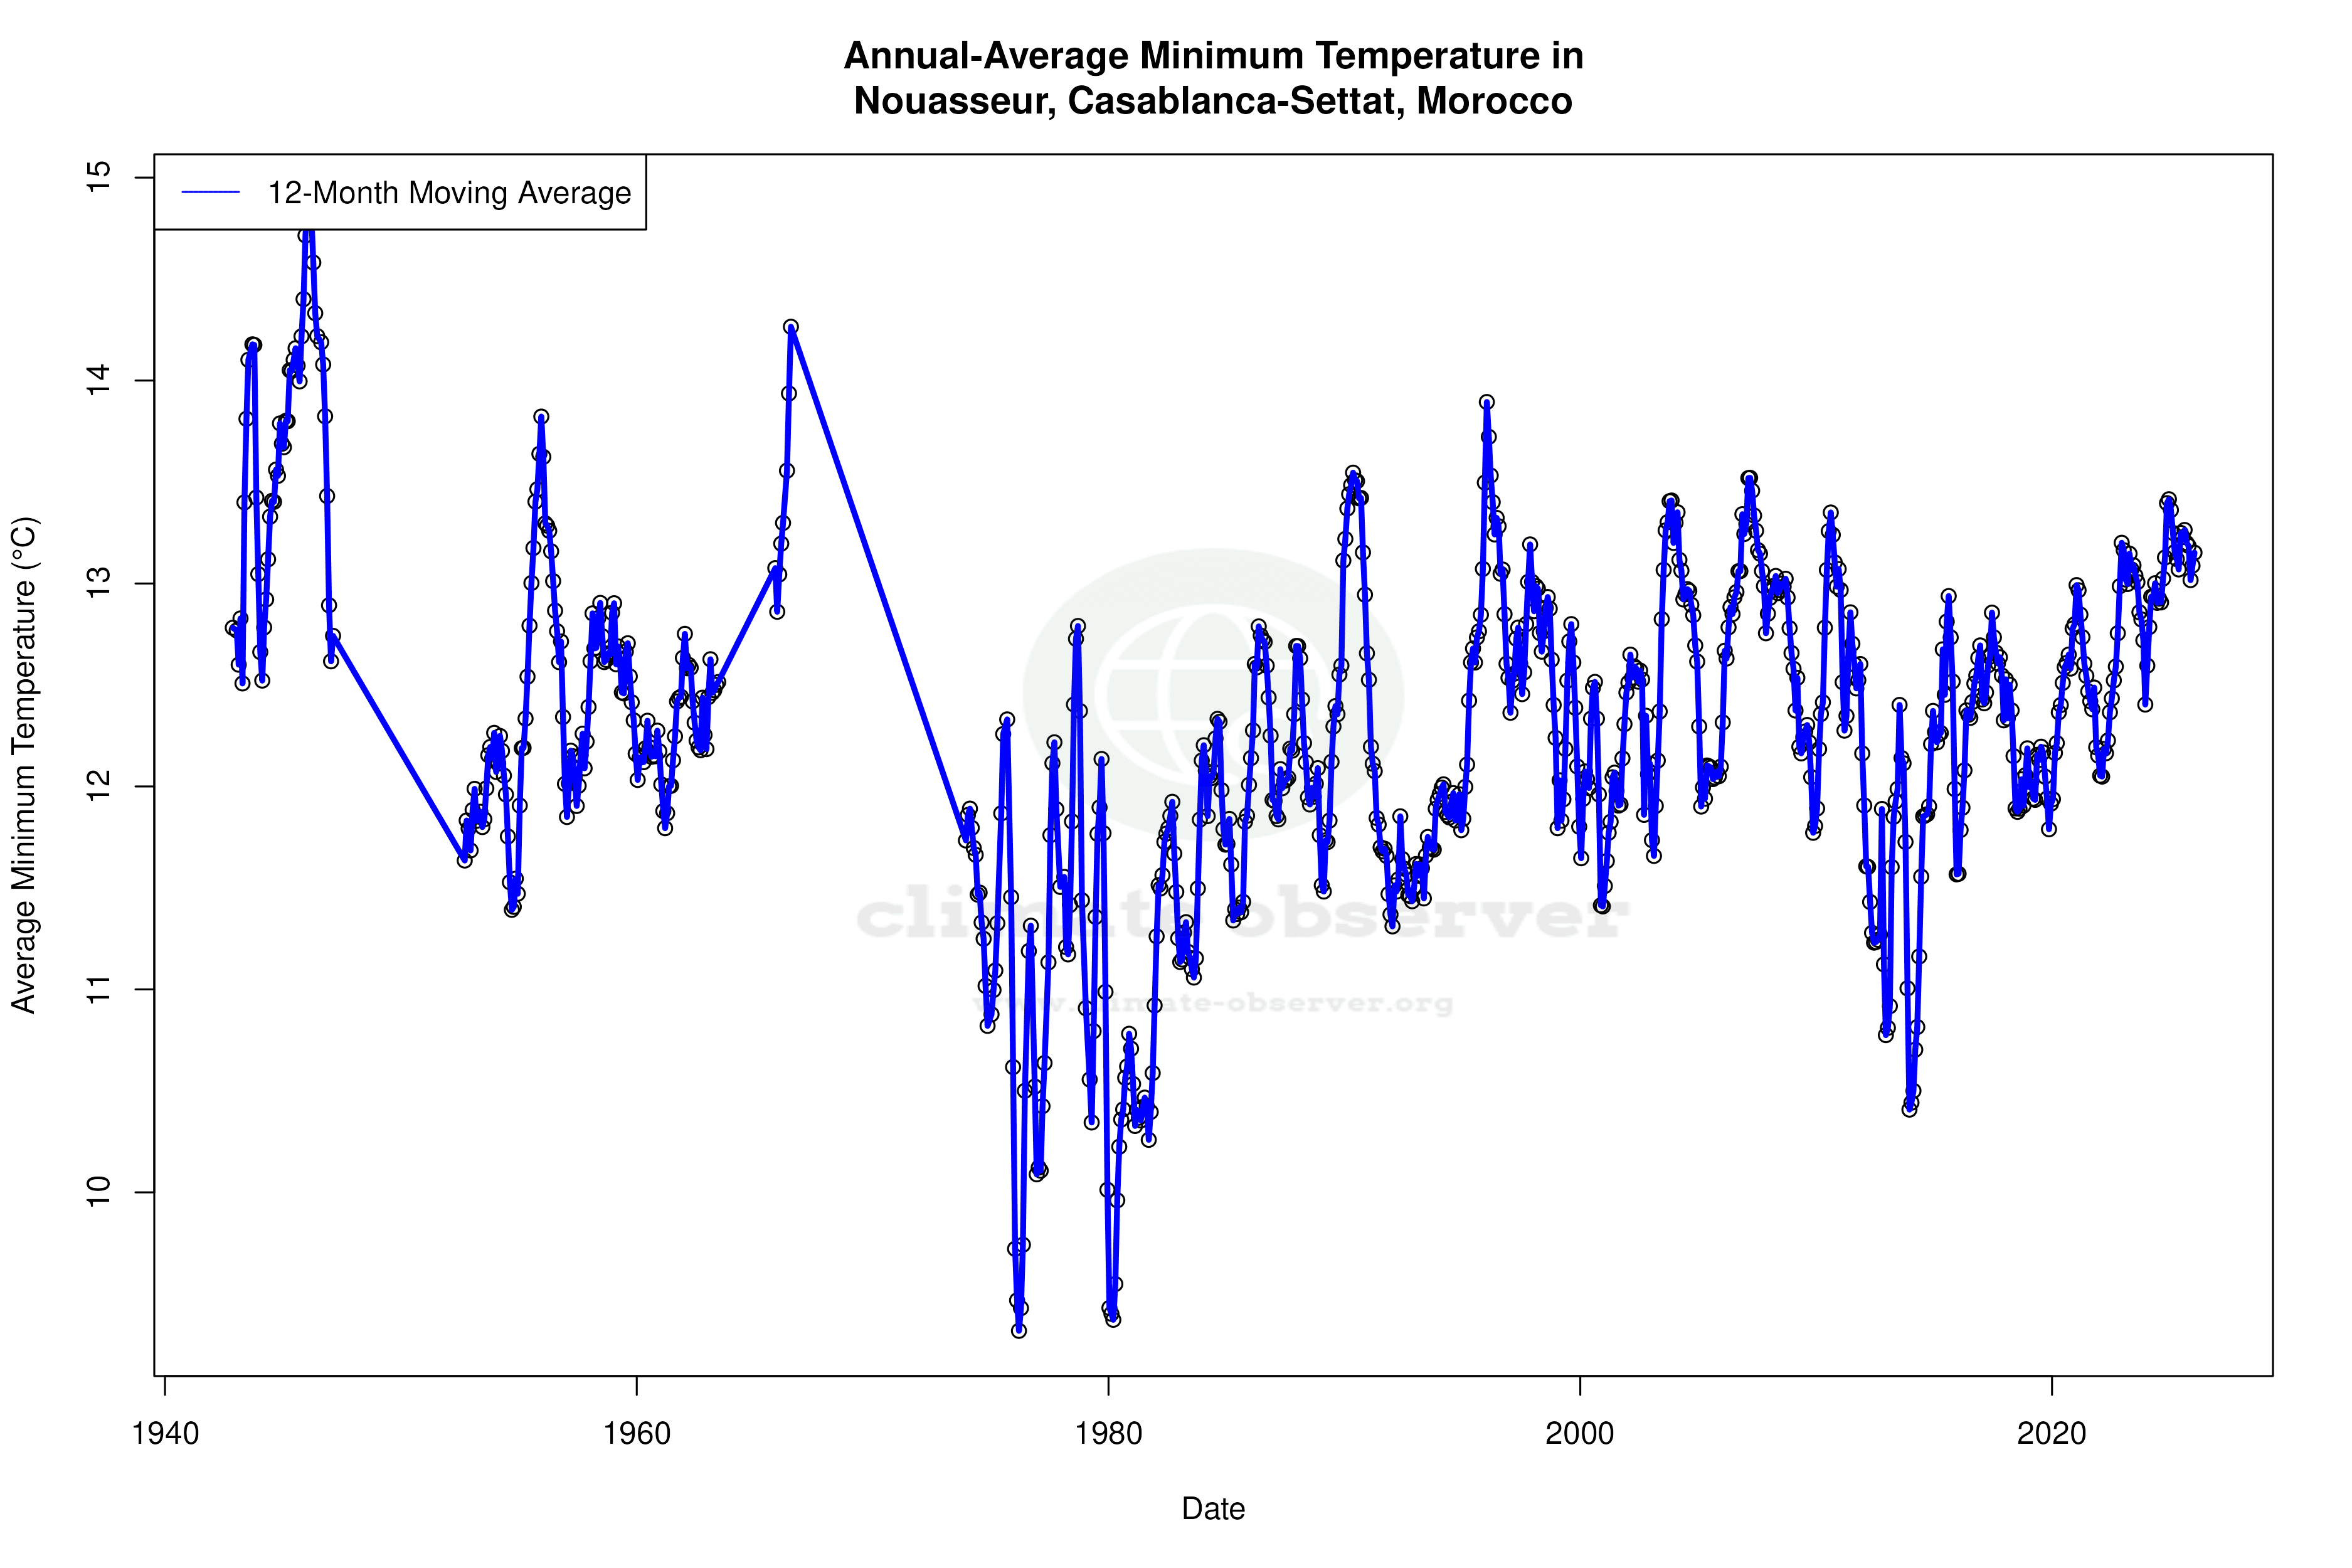
Nouasseur, located near the bustling city of Casablanca, is characterised by a hot-summer Mediterranean climate (Csa) according to the Köppen classification. This region experiences hot, dry summers and mild, wet winters, influenced by its proximity to the Atlantic Ocean. The all-time temperature trends indicate a warming pattern, with highs rising by 0.35°C (0.63°F). Interestingly, the lows have shown a slight cooling of 0.02°C (0.04°F), which is relatively negligible but noteworthy in the context of a generally warming climate. These trends highlight the nuanced nature of climate dynamics in this area, where oceanic influences may moderate extreme temperature changes.
Decadal Dynamics: A Closer Look
Over the past decade, Nouasseur has experienced more pronounced warming than the all-time trends suggest. High temperatures have increased by 1.68°C (3.02°F), while lows have risen by 0.96°C (1.73°F). This indicates a more rapid warming trend in recent years, which could be attributed to urbanisation and global climate change influences. The region's record high of 47.4°C (117.3°F) and record low of -3.5°C (25.7°F) provide a stark illustration of the temperature extremes possible in this locale.
Precipitation Patterns: A Shift Towards Evenness
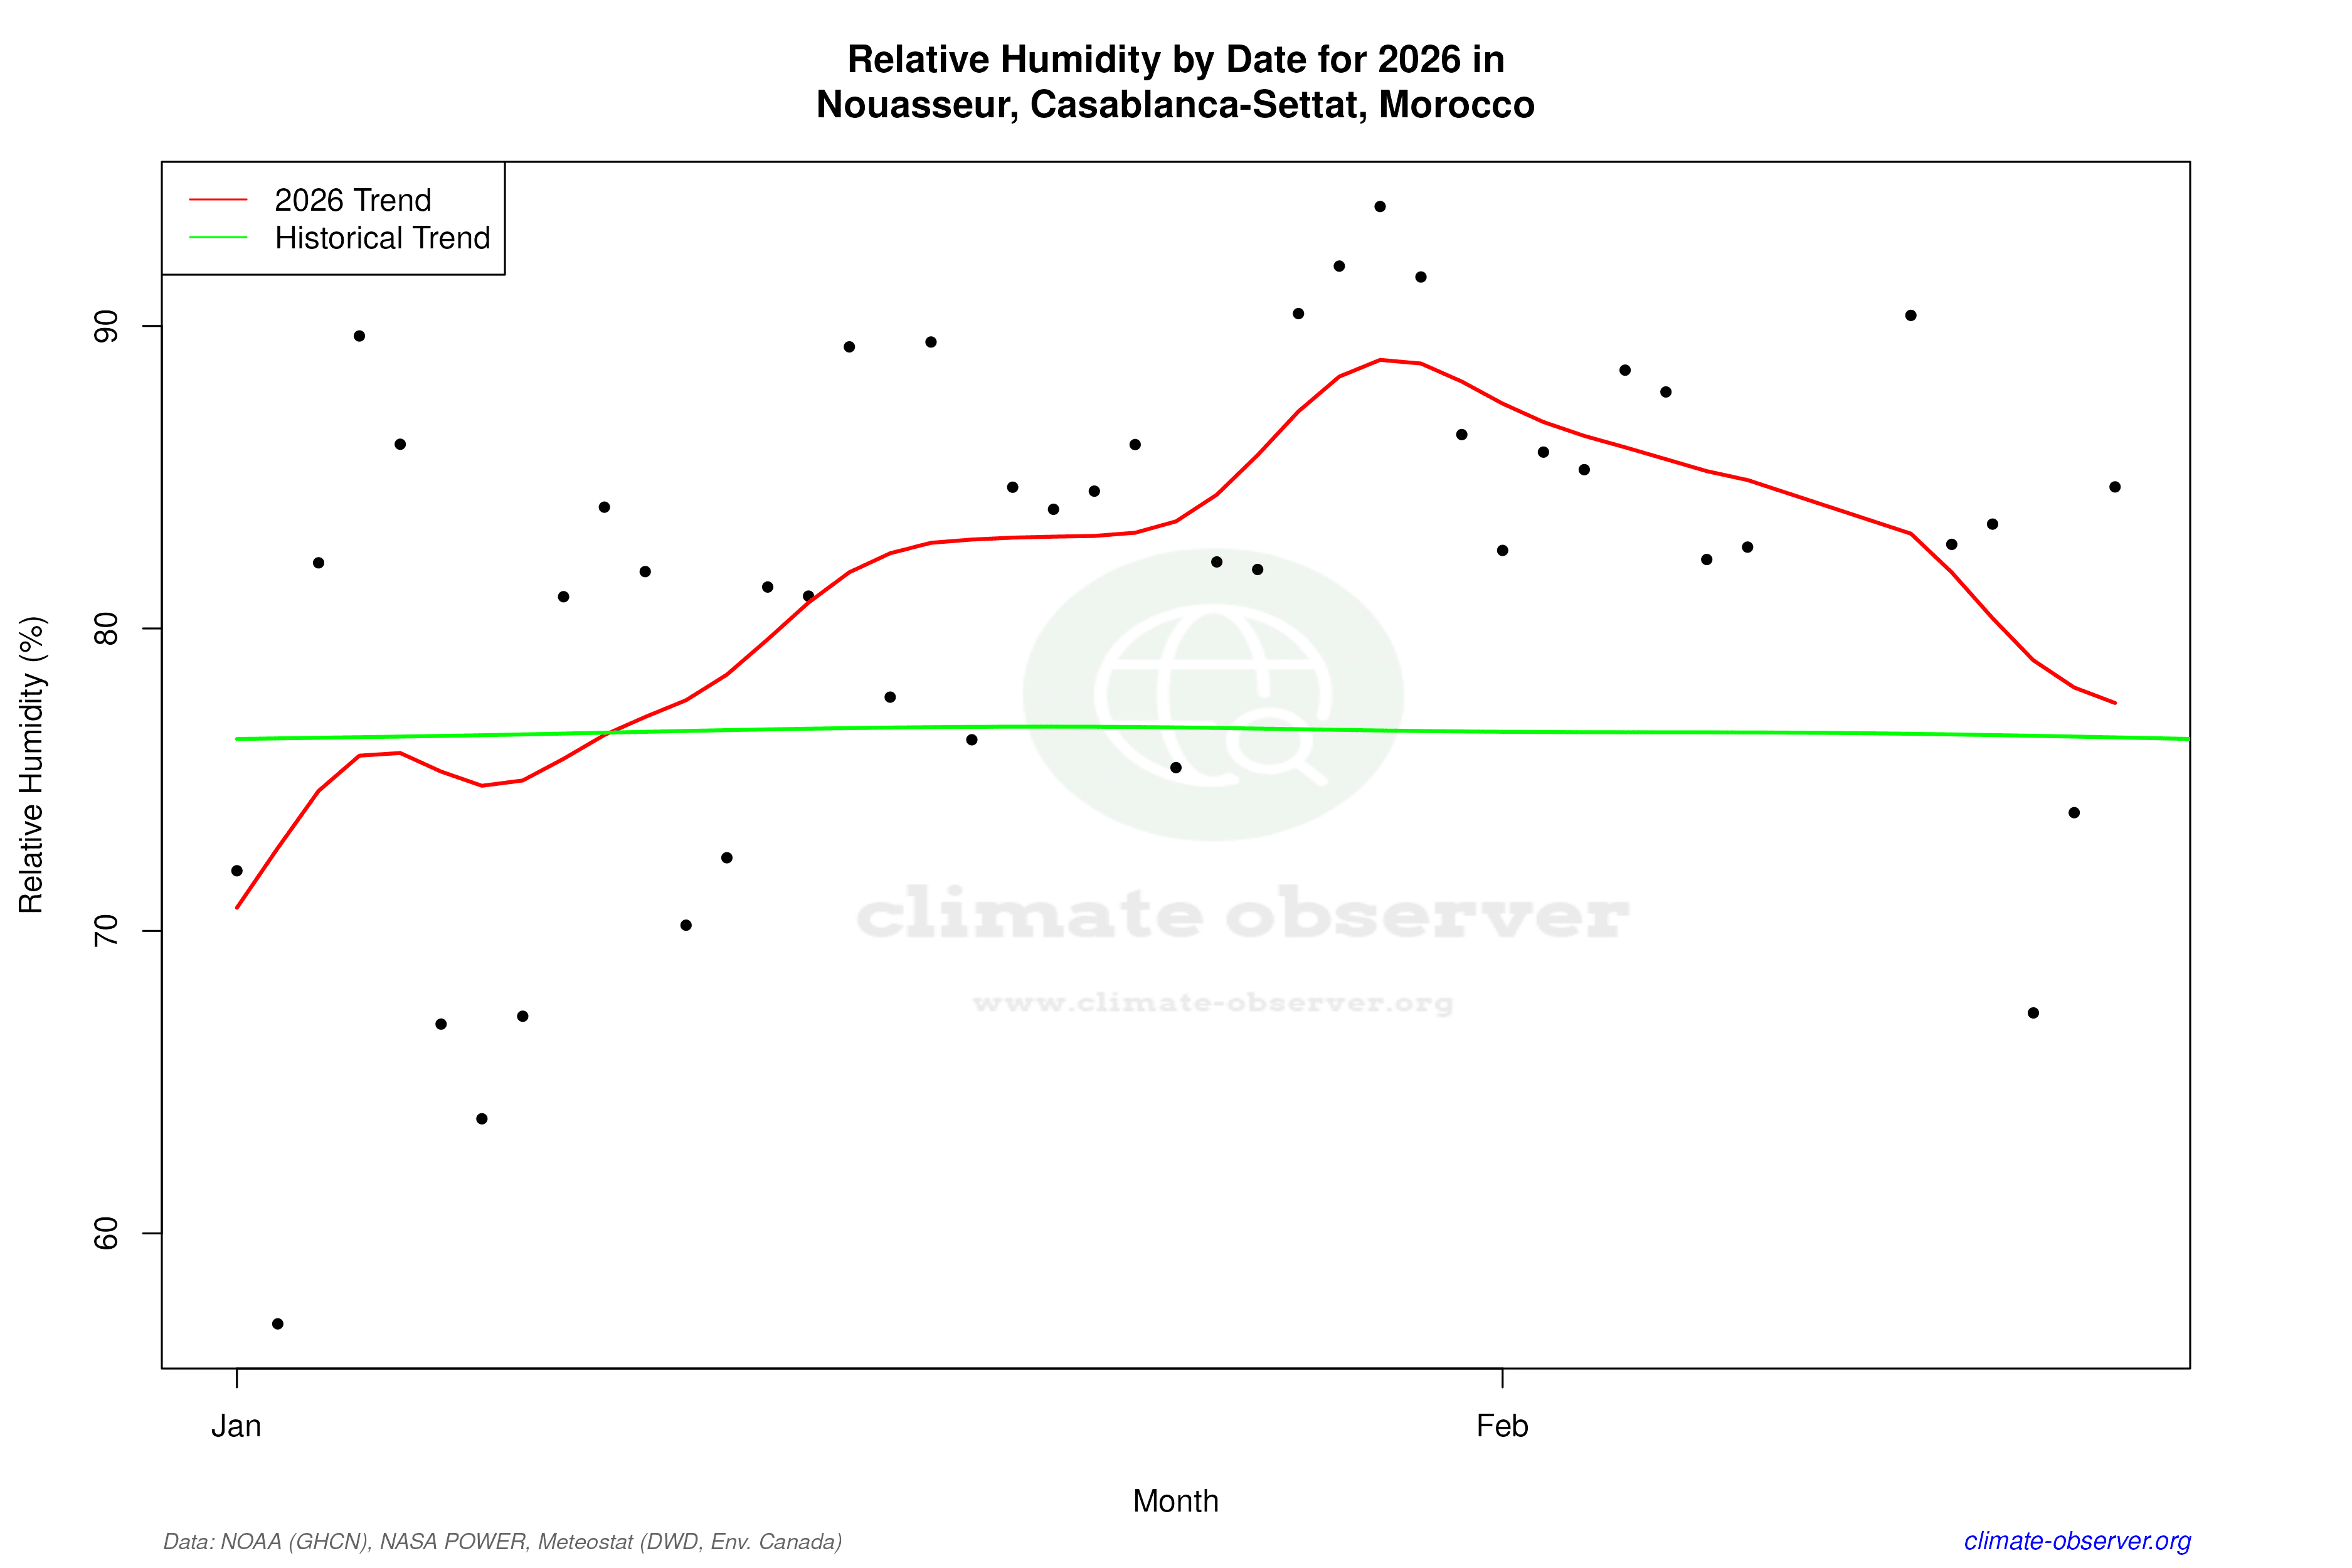
The Precipitation Concentration Index (PCI) for Nouasseur has decreased from a baseline of 20.47 to 17.64, indicating a more even distribution of rainfall events. This shift suggests that while the region may experience less intense rainfall events, the precipitation is spread more consistently throughout the year. This change could have significant implications for agriculture and water management, as more evenly distributed rainfall can mitigate drought impacts and improve water availability.
Regional Climate Context and Implications
Morocco has been actively pursuing climate goals, focusing on sustainable agriculture and water management strategies. The trends observed in Nouasseur, particularly the warming and changes in precipitation distribution, align with broader regional climate objectives aimed at adapting to climate variability. Recent weather events, such as heatwaves, underscore the urgency of these initiatives. The data from Nouasseur serves as a microcosm of the challenges and opportunities faced by Morocco as it navigates the complexities of climate change adaptation and mitigation.
Station Statistics
10-Year Trend
High: +2.88 °F/decade
Low: +2.05 °F/decade
Rain: -0.005 in/decade
25-Year Trend
High: +1.19 °F/decade
Low: +0.10 °F/decade
Rain: -0.005 in/decade
50-Year Trend
High: +0.87 °F/decade
Low: +0.51 °F/decade
Rain: +0.001 in/decade
All-Time Trend
High: +0.65 °F/decade
Low: -0.00 °F/decade
Rain: -0.001 in/decade
Percentage Above-Average Days
Last 12 Months: 51.7%
This Year: 46.3%
Precipitation Concentration Index (PCI) ℹ️
Last 12 Months: 23.8
Historical Average: 20.9
Percentile Rank of Last 12 Months ℹ️
High: 96th percentile
Low: 90th percentile
Rain: 66th percentile
Change in Variance ℹ️
High: +16.3%
Low: +15.4%
Intraday: +14.1%
Data Coverage
83.5%
First Year of Data
1942
Station Location
Historical Weather Records
| Max High | Avg High | Min High | Max Avg | Avg Avg | Min Avg | Max Low | Avg Low | Min Low | Max Precipitation | Avg Precipitation | Max Snow | Avg Snow | |
|---|---|---|---|---|---|---|---|---|---|---|---|---|---|
| Record | 117.32 °F | — | 46.40 °F | 96.28 °F | — | 37.04 °F | 84.74 °F | — | 25.70 °F | 5.35 in | — | — | — |
| January | 85.64 °F | 63.60 °F | 46.40 °F | 68.72 °F | 52.74 °F | 37.04 °F | 61.34 °F | 43.57 °F | 26.60 °F | 1.77 in | 0.06 in | — | — |
| February | 97.34 °F | 65.50 °F | 48.38 °F | 71.60 °F | 54.52 °F | 41.18 °F | 62.42 °F | 44.99 °F | 25.70 °F | 1.42 in | 0.06 in | — | — |
| March | 101.12 °F | 68.84 °F | 51.80 °F | 77.72 °F | 57.68 °F | 45.32 °F | 64.76 °F | 47.58 °F | 31.10 °F | 5.35 in | 0.06 in | — | — |
| April | 99.68 °F | 71.19 °F | 51.80 °F | 79.88 °F | 60.53 °F | 48.56 °F | 70.34 °F | 50.48 °F | 33.44 °F | 1.06 in | 0.04 in | — | — |
| May | 107.96 °F | 75.67 °F | 59.00 °F | 87.08 °F | 65.31 °F | 52.52 °F | 75.38 °F | 55.48 °F | 39.20 °F | 1.77 in | 0.02 in | — | — |
| June | 110.12 °F | 79.76 °F | 66.38 °F | 91.06 °F | 69.93 °F | 58.28 °F | 81.32 °F | 61.08 °F | 37.40 °F | 2.05 in | 0.00 in | — | — |
| July | 117.32 °F | 84.37 °F | 68.36 °F | 96.28 °F | 73.97 °F | 62.42 °F | 84.74 °F | 65.09 °F | 50.00 °F | 0.43 in | 0.00 in | — | — |
| August | 117.32 °F | 85.34 °F | 71.60 °F | 94.60 °F | 74.67 °F | 64.94 °F | 80.60 °F | 65.90 °F | 48.20 °F | 0.39 in | 0.00 in | — | — |
| September | 111.20 °F | 82.50 °F | 68.18 °F | 88.52 °F | 71.85 °F | 60.08 °F | 77.00 °F | 62.96 °F | 44.60 °F | 1.10 in | 0.01 in | — | — |
| October | 102.20 °F | 78.16 °F | 57.20 °F | 86.00 °F | 66.89 °F | 51.80 °F | 74.30 °F | 57.43 °F | 37.40 °F | 4.25 in | 0.04 in | — | — |
| November | 95.90 °F | 70.95 °F | 52.34 °F | 79.16 °F | 59.91 °F | 45.68 °F | 69.26 °F | 50.46 °F | 30.20 °F | 2.90 in | 0.06 in | — | — |
| December | 86.00 °F | 65.58 °F | 46.40 °F | 69.08 °F | 54.92 °F | 38.66 °F | 63.50 °F | 46.05 °F | 27.32 °F | 2.01 in | 0.07 in | — | — |
Data Visualisations
Remove WatermarksCurrent Year Climate Trends vs Historical


Max Temperature this Year | 1 of 6
Climate 12-Month Moving Averages

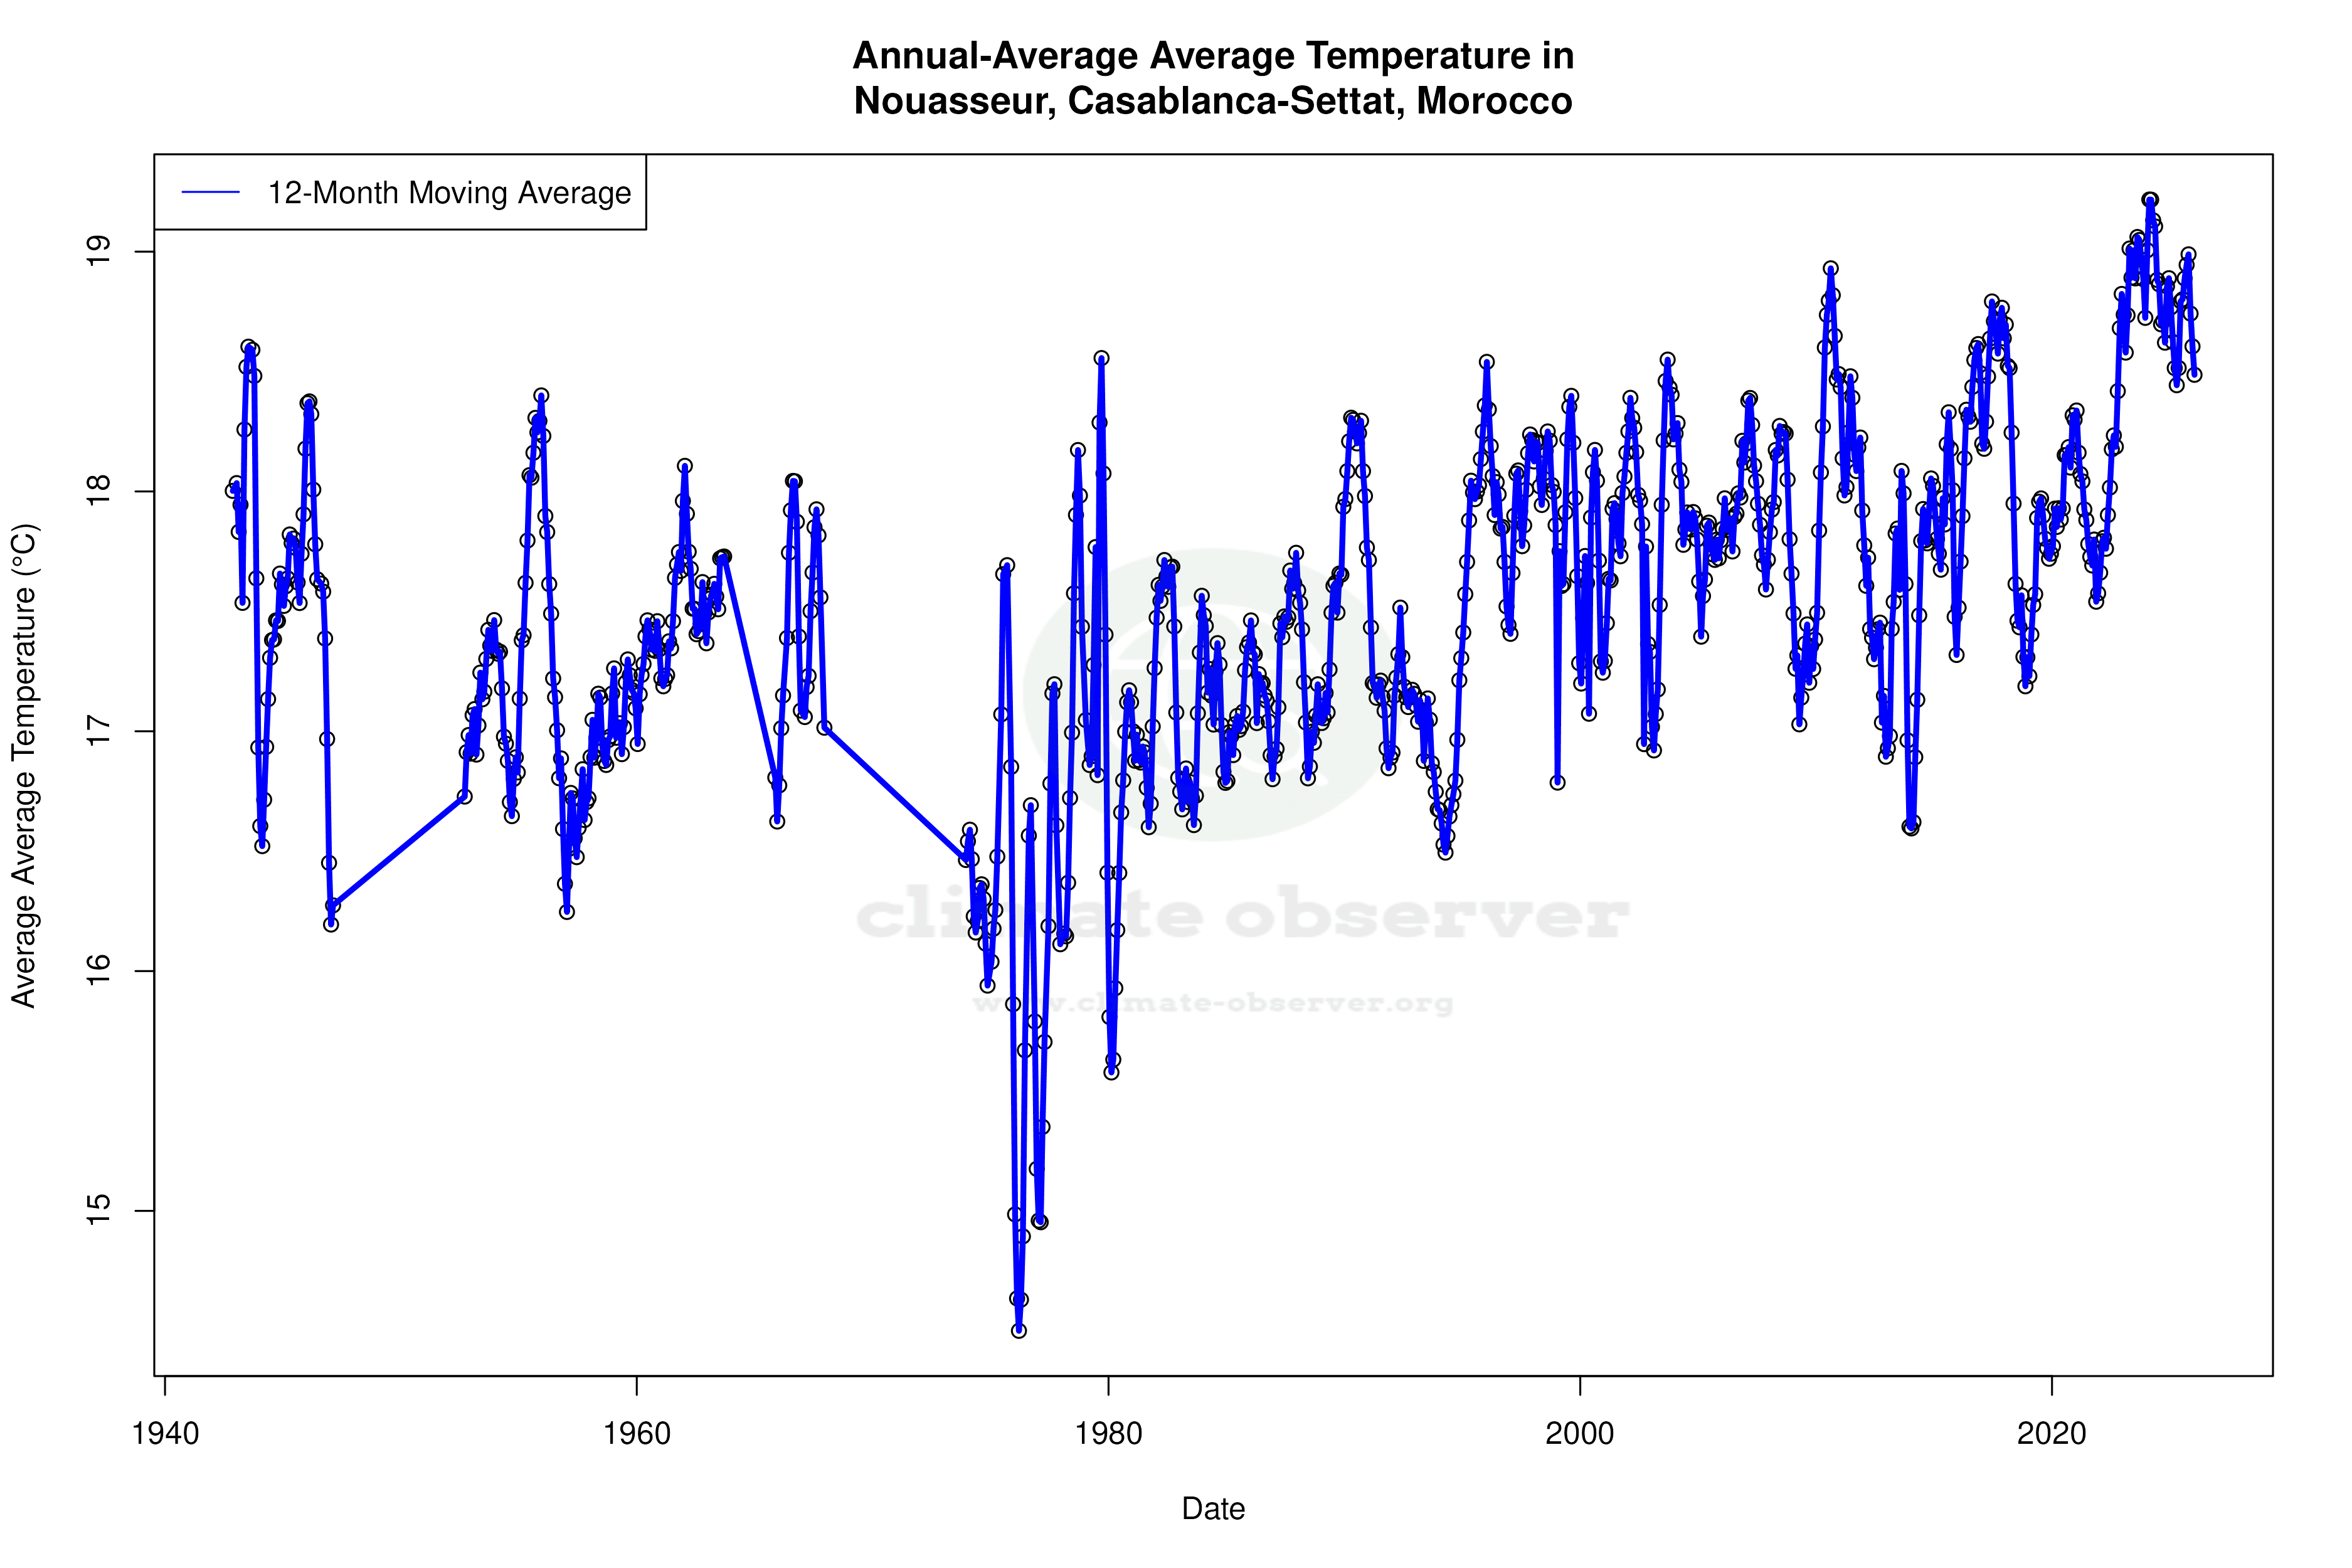


Max Temperature 12-Month MA | 1 of 6
Daily Data Points and Averages Throughout the Year
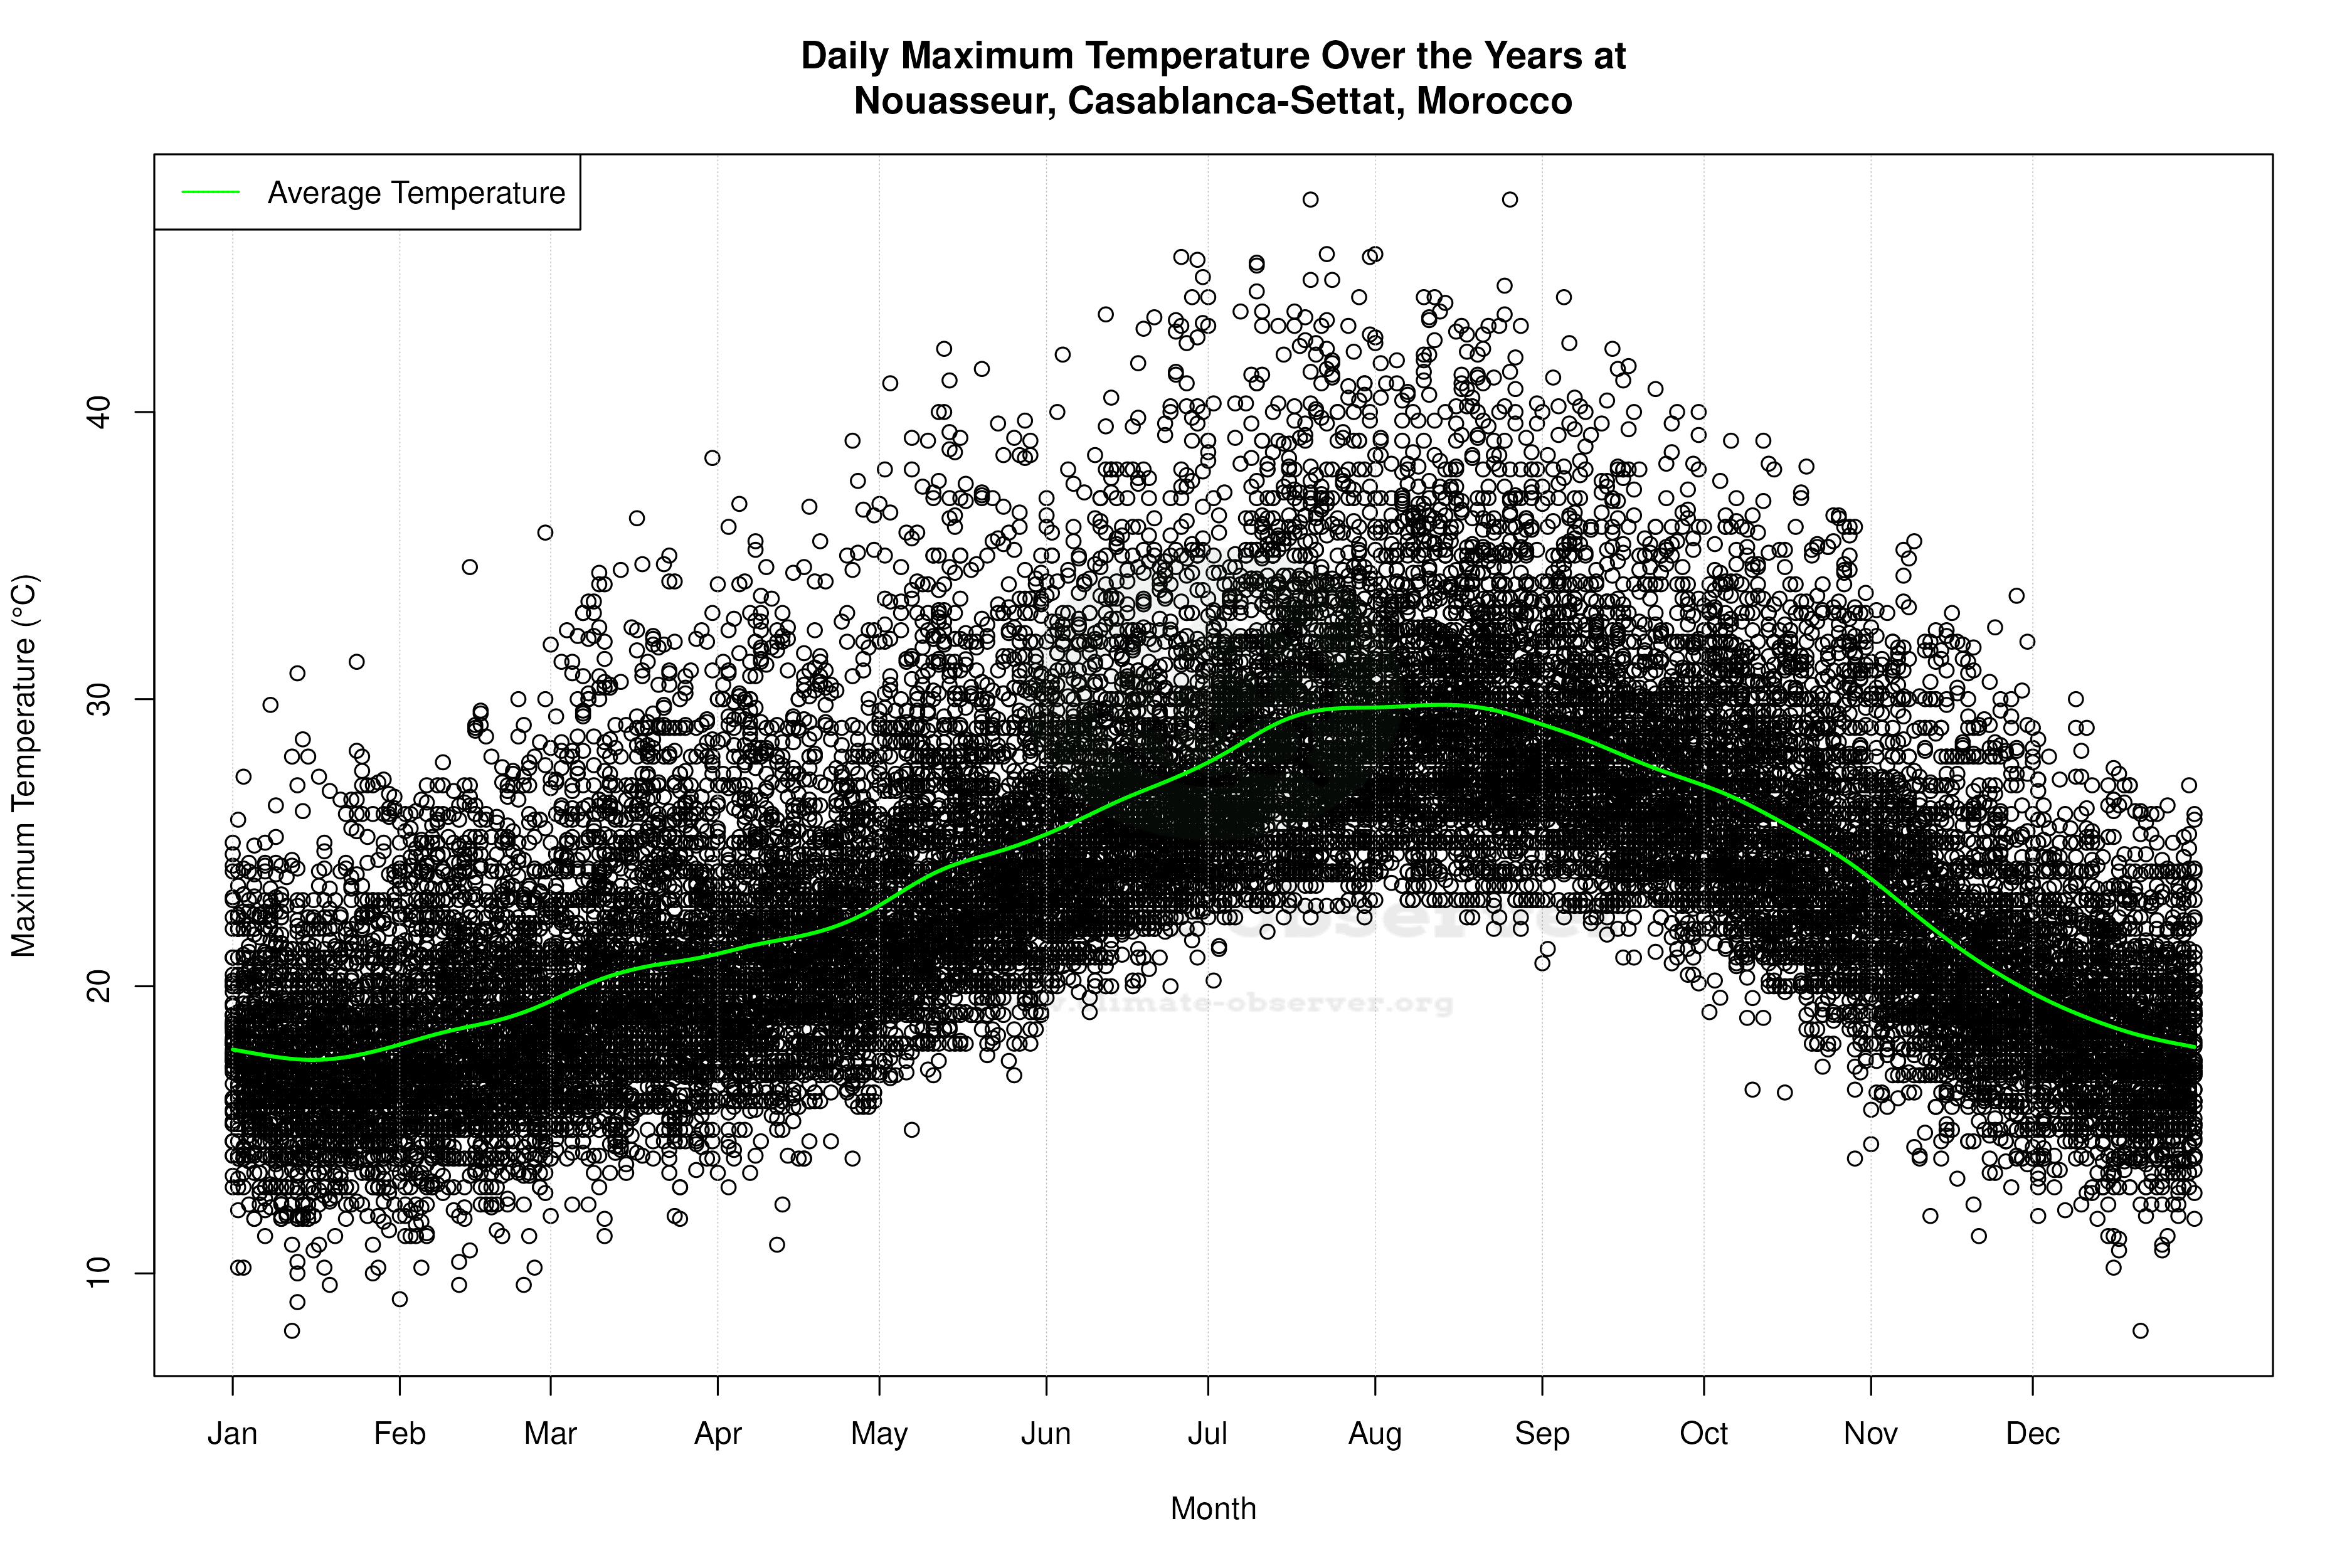

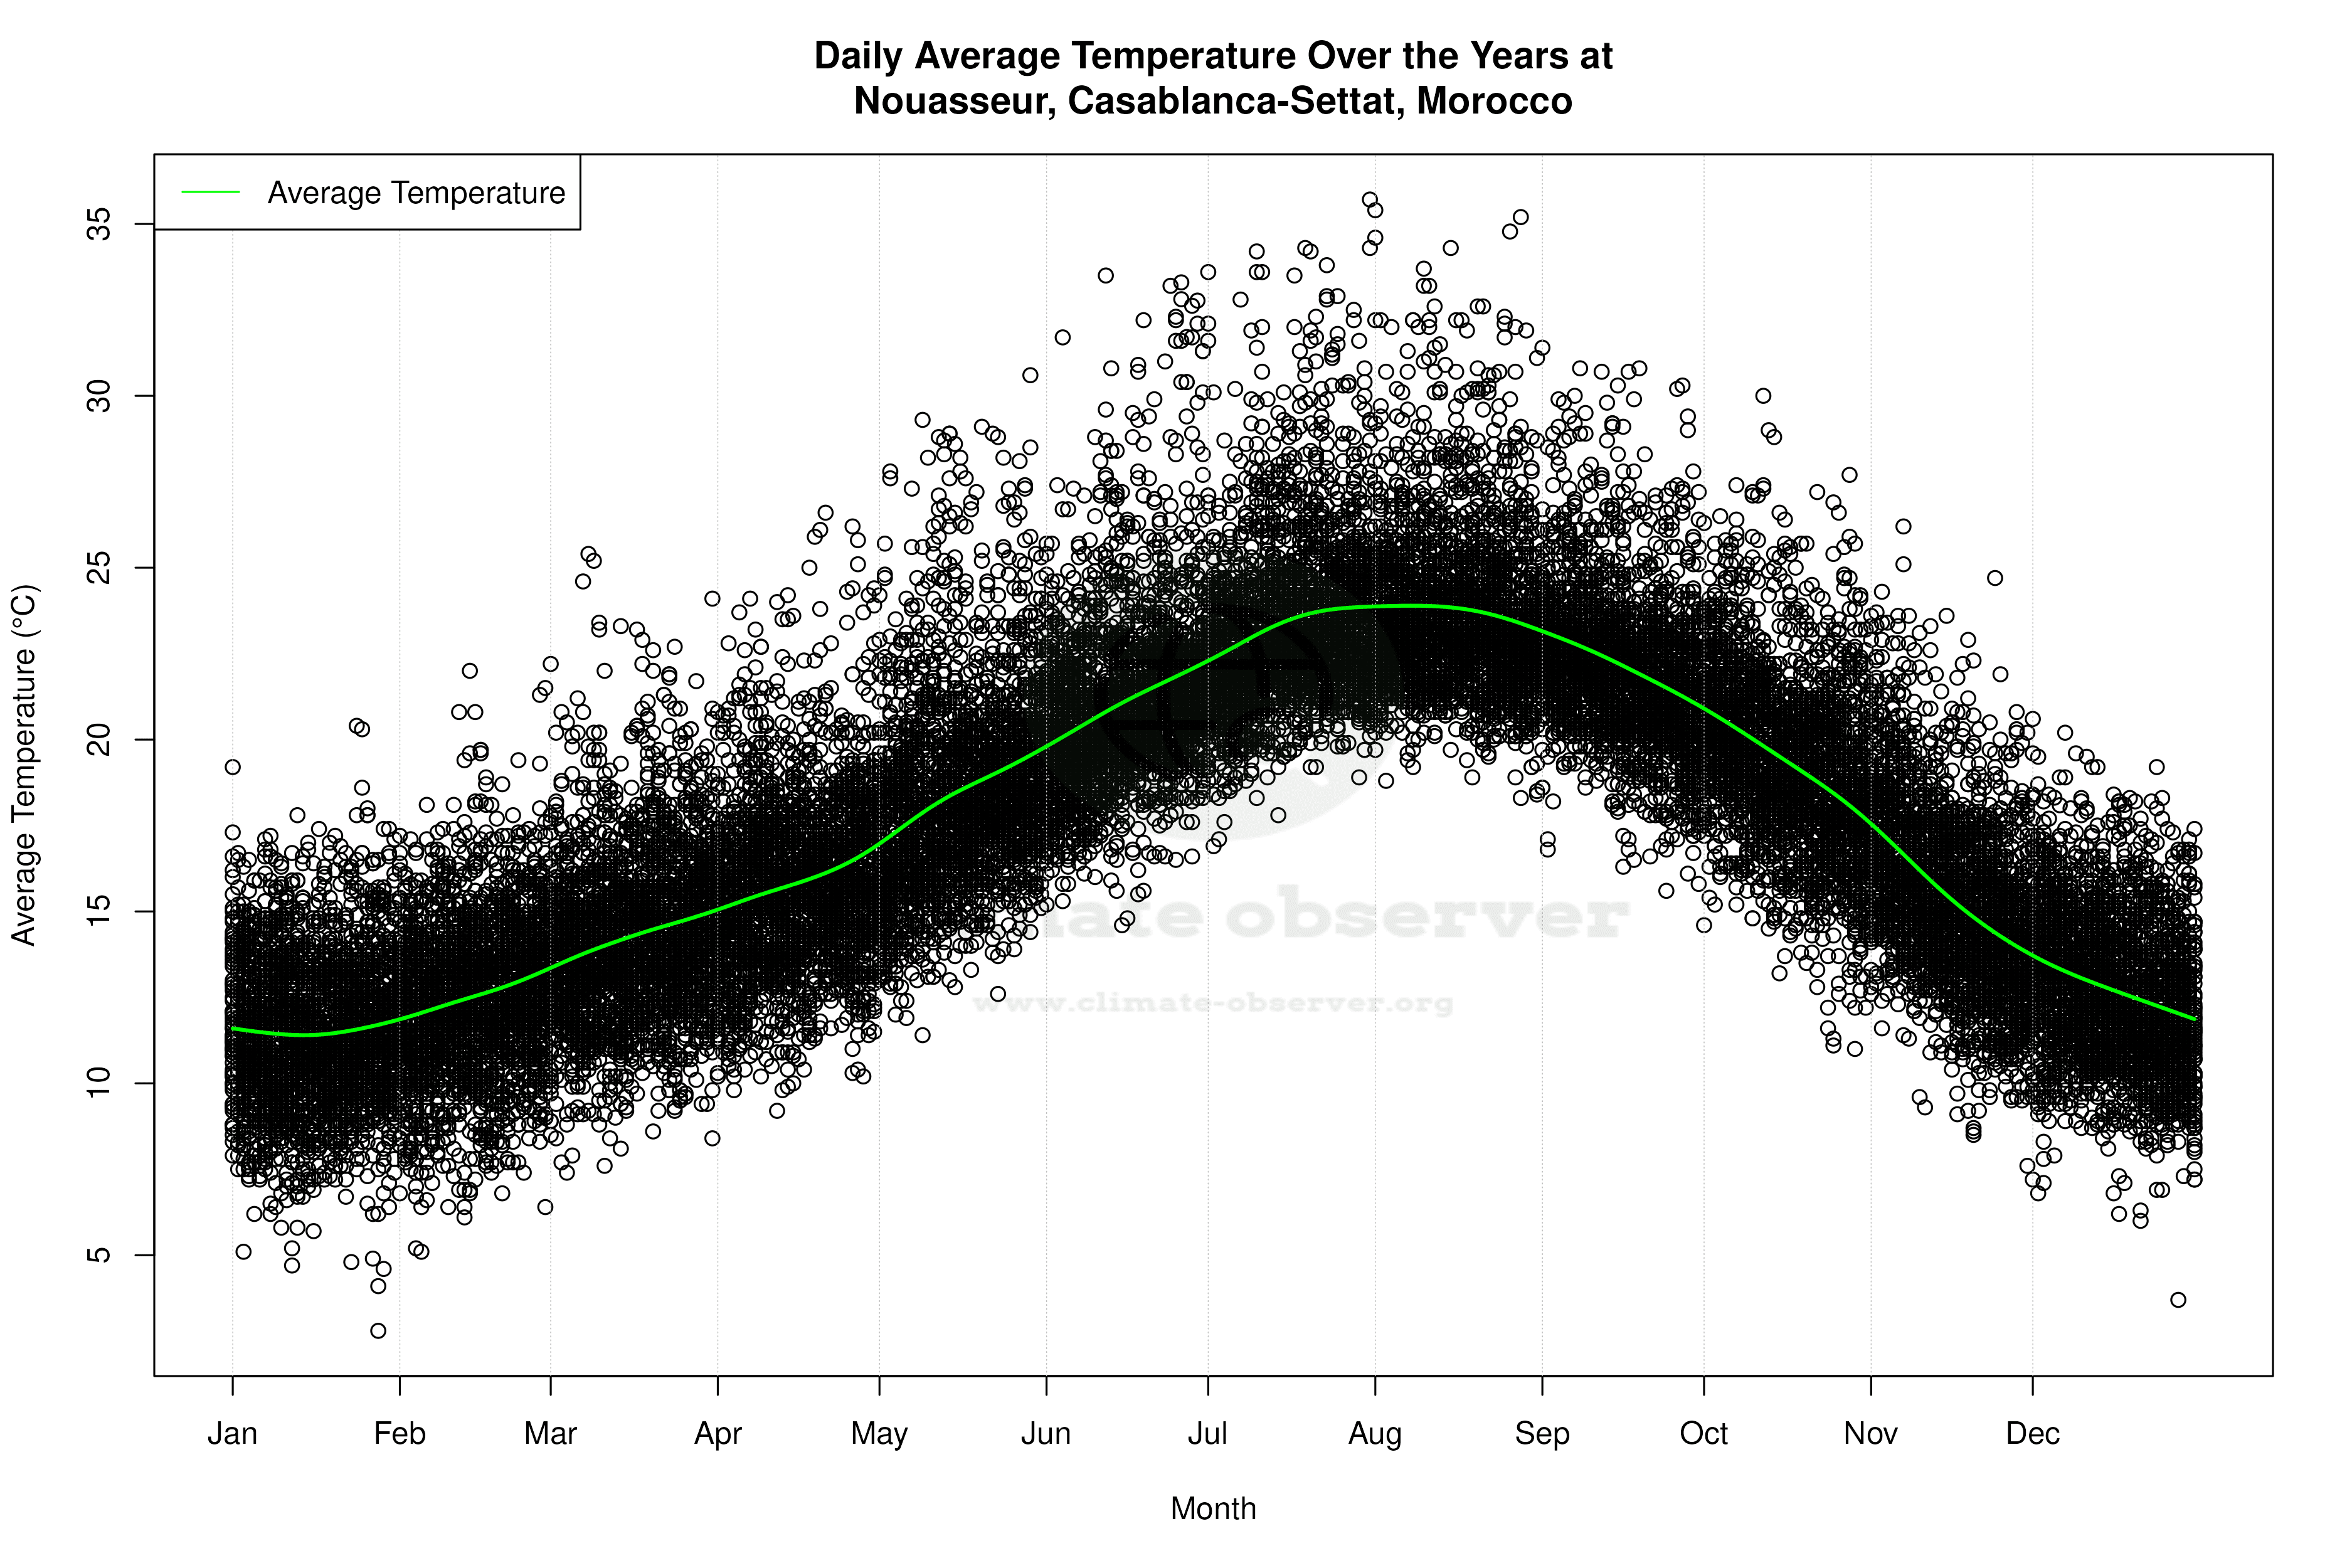


Average Max Temperature Throughout Year | 1 of 5
