Climate for Station: Ouarzazate, Draa-Tafilalet, Morocco
Loading live weather...
Climate Analysis & Overview
Ouarzazate, a city nestled in the heart of Morocco, is experiencing a notable warming trend, with both high and low temperatures rising over the past decade. This increase in temperature is accompanied by a significant concentration of precipitation events, indicating a shift towards more intense weather patterns.
Desert Climate Dynamics
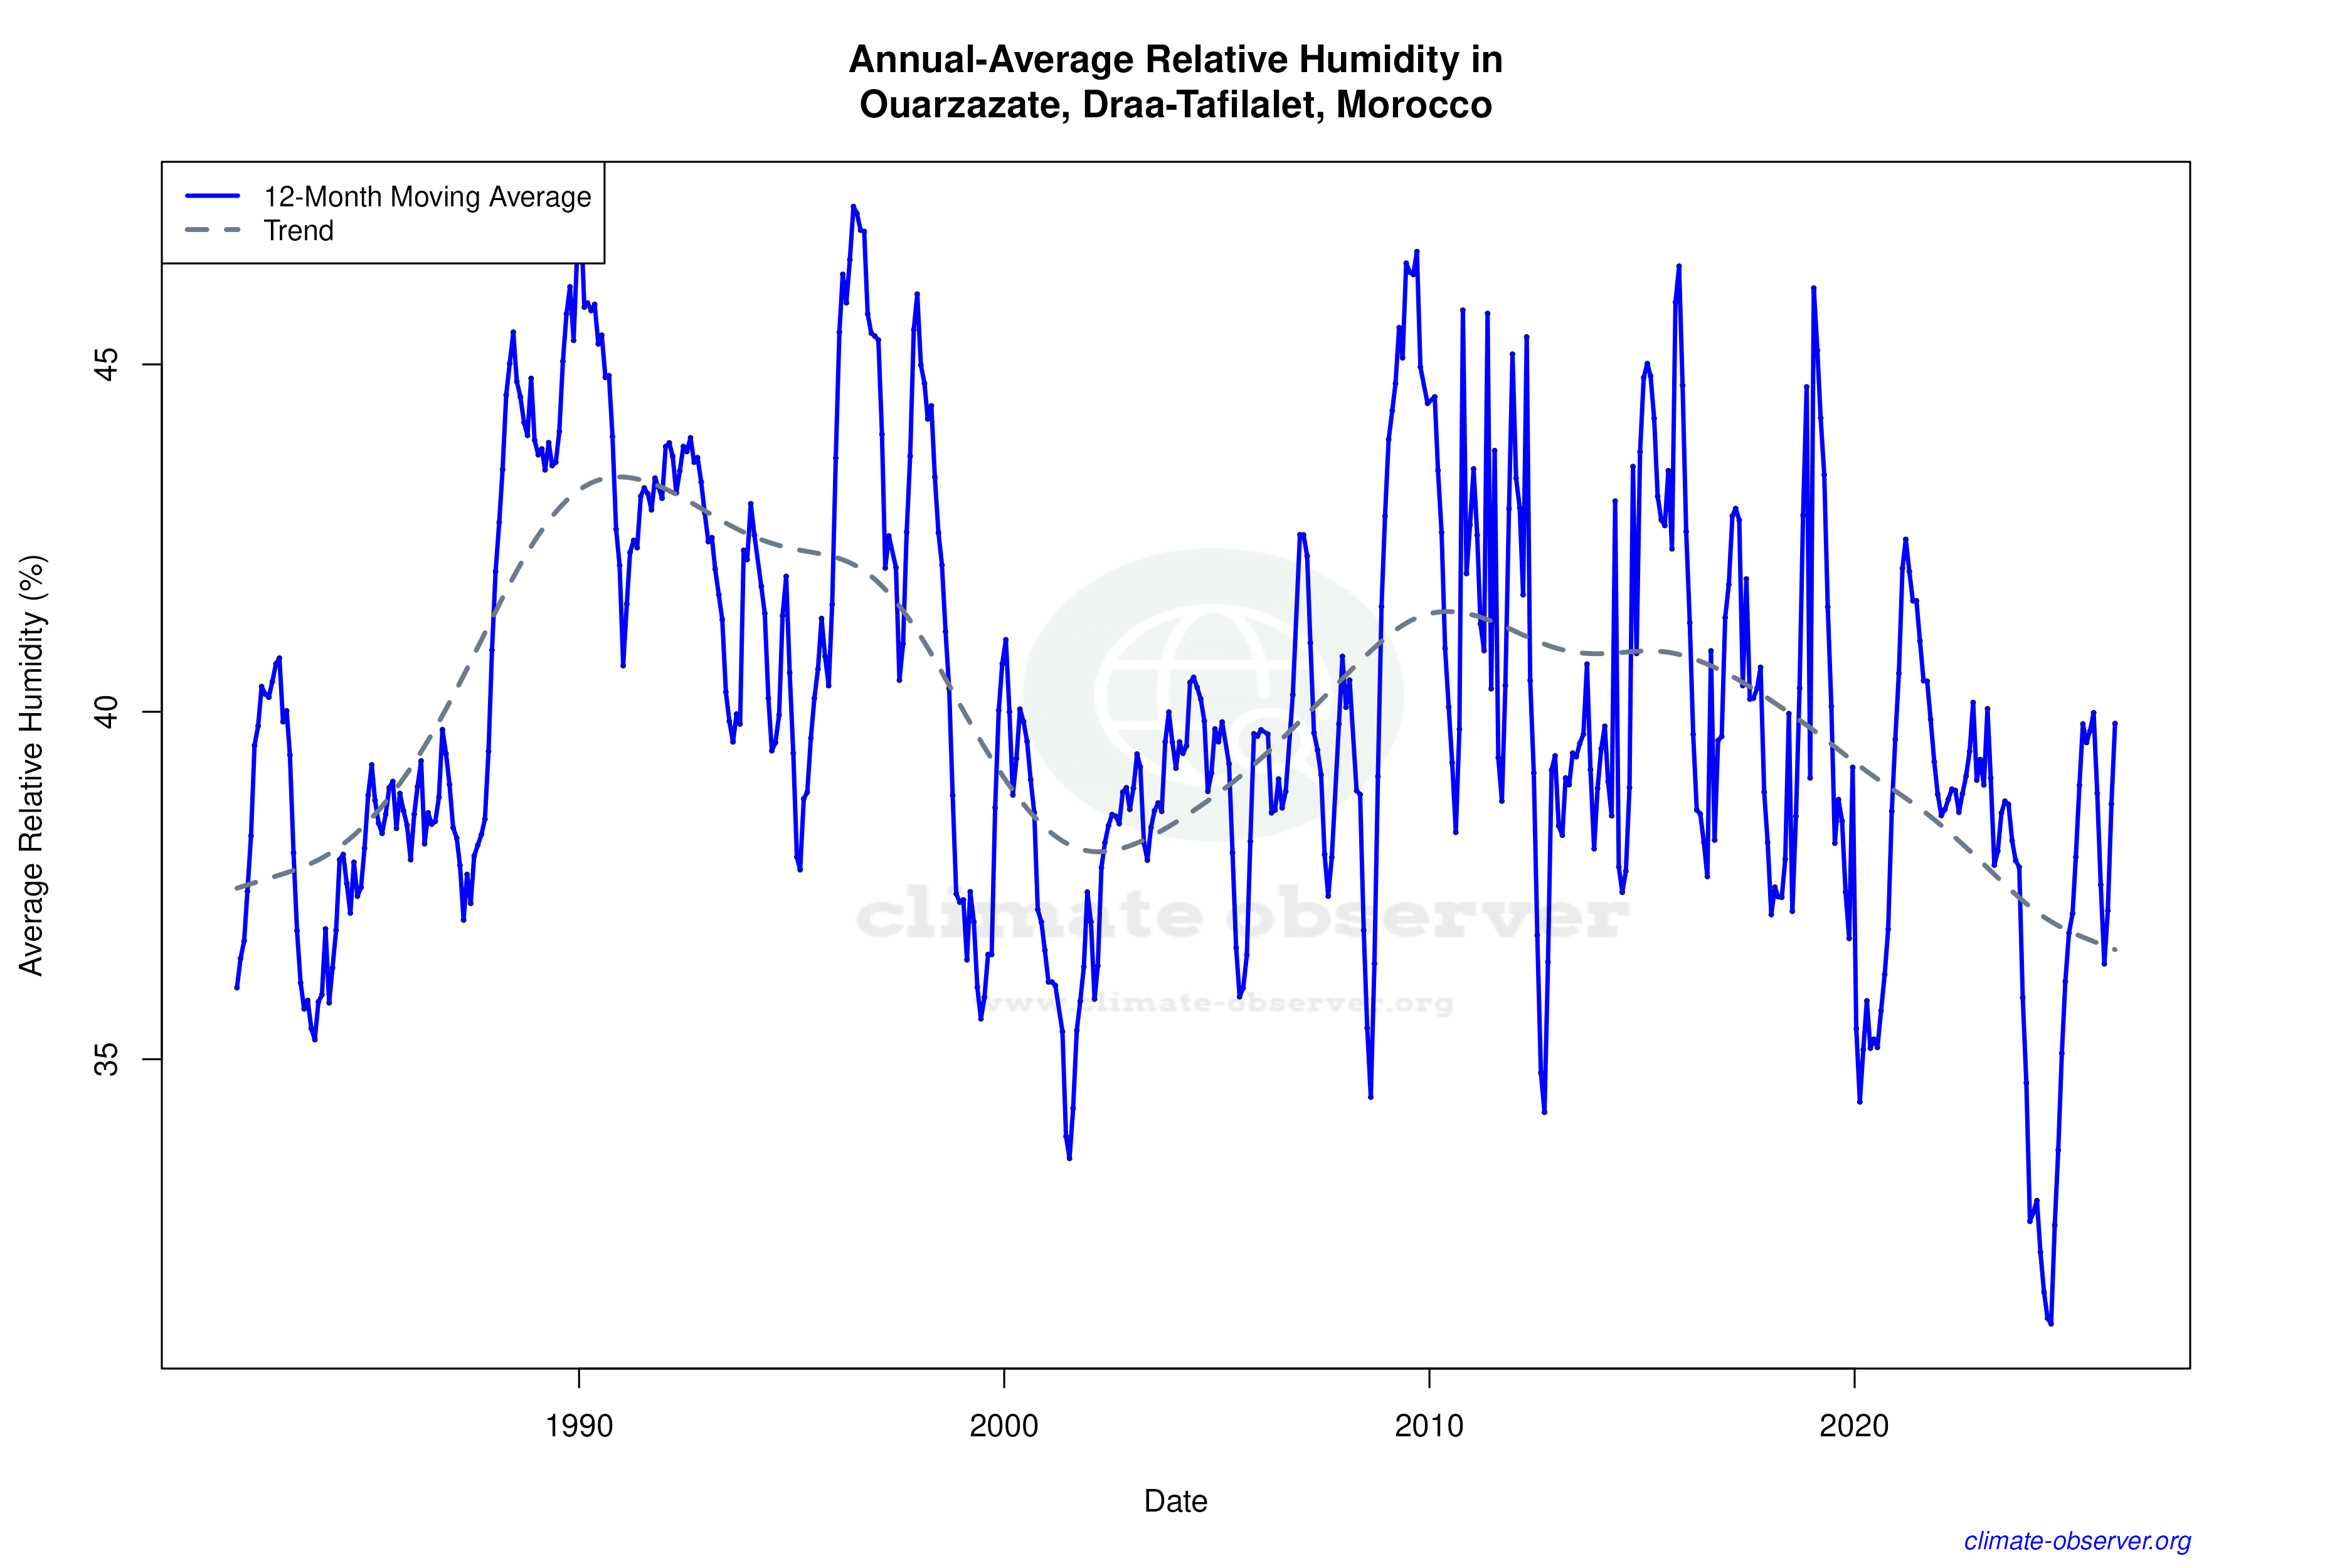
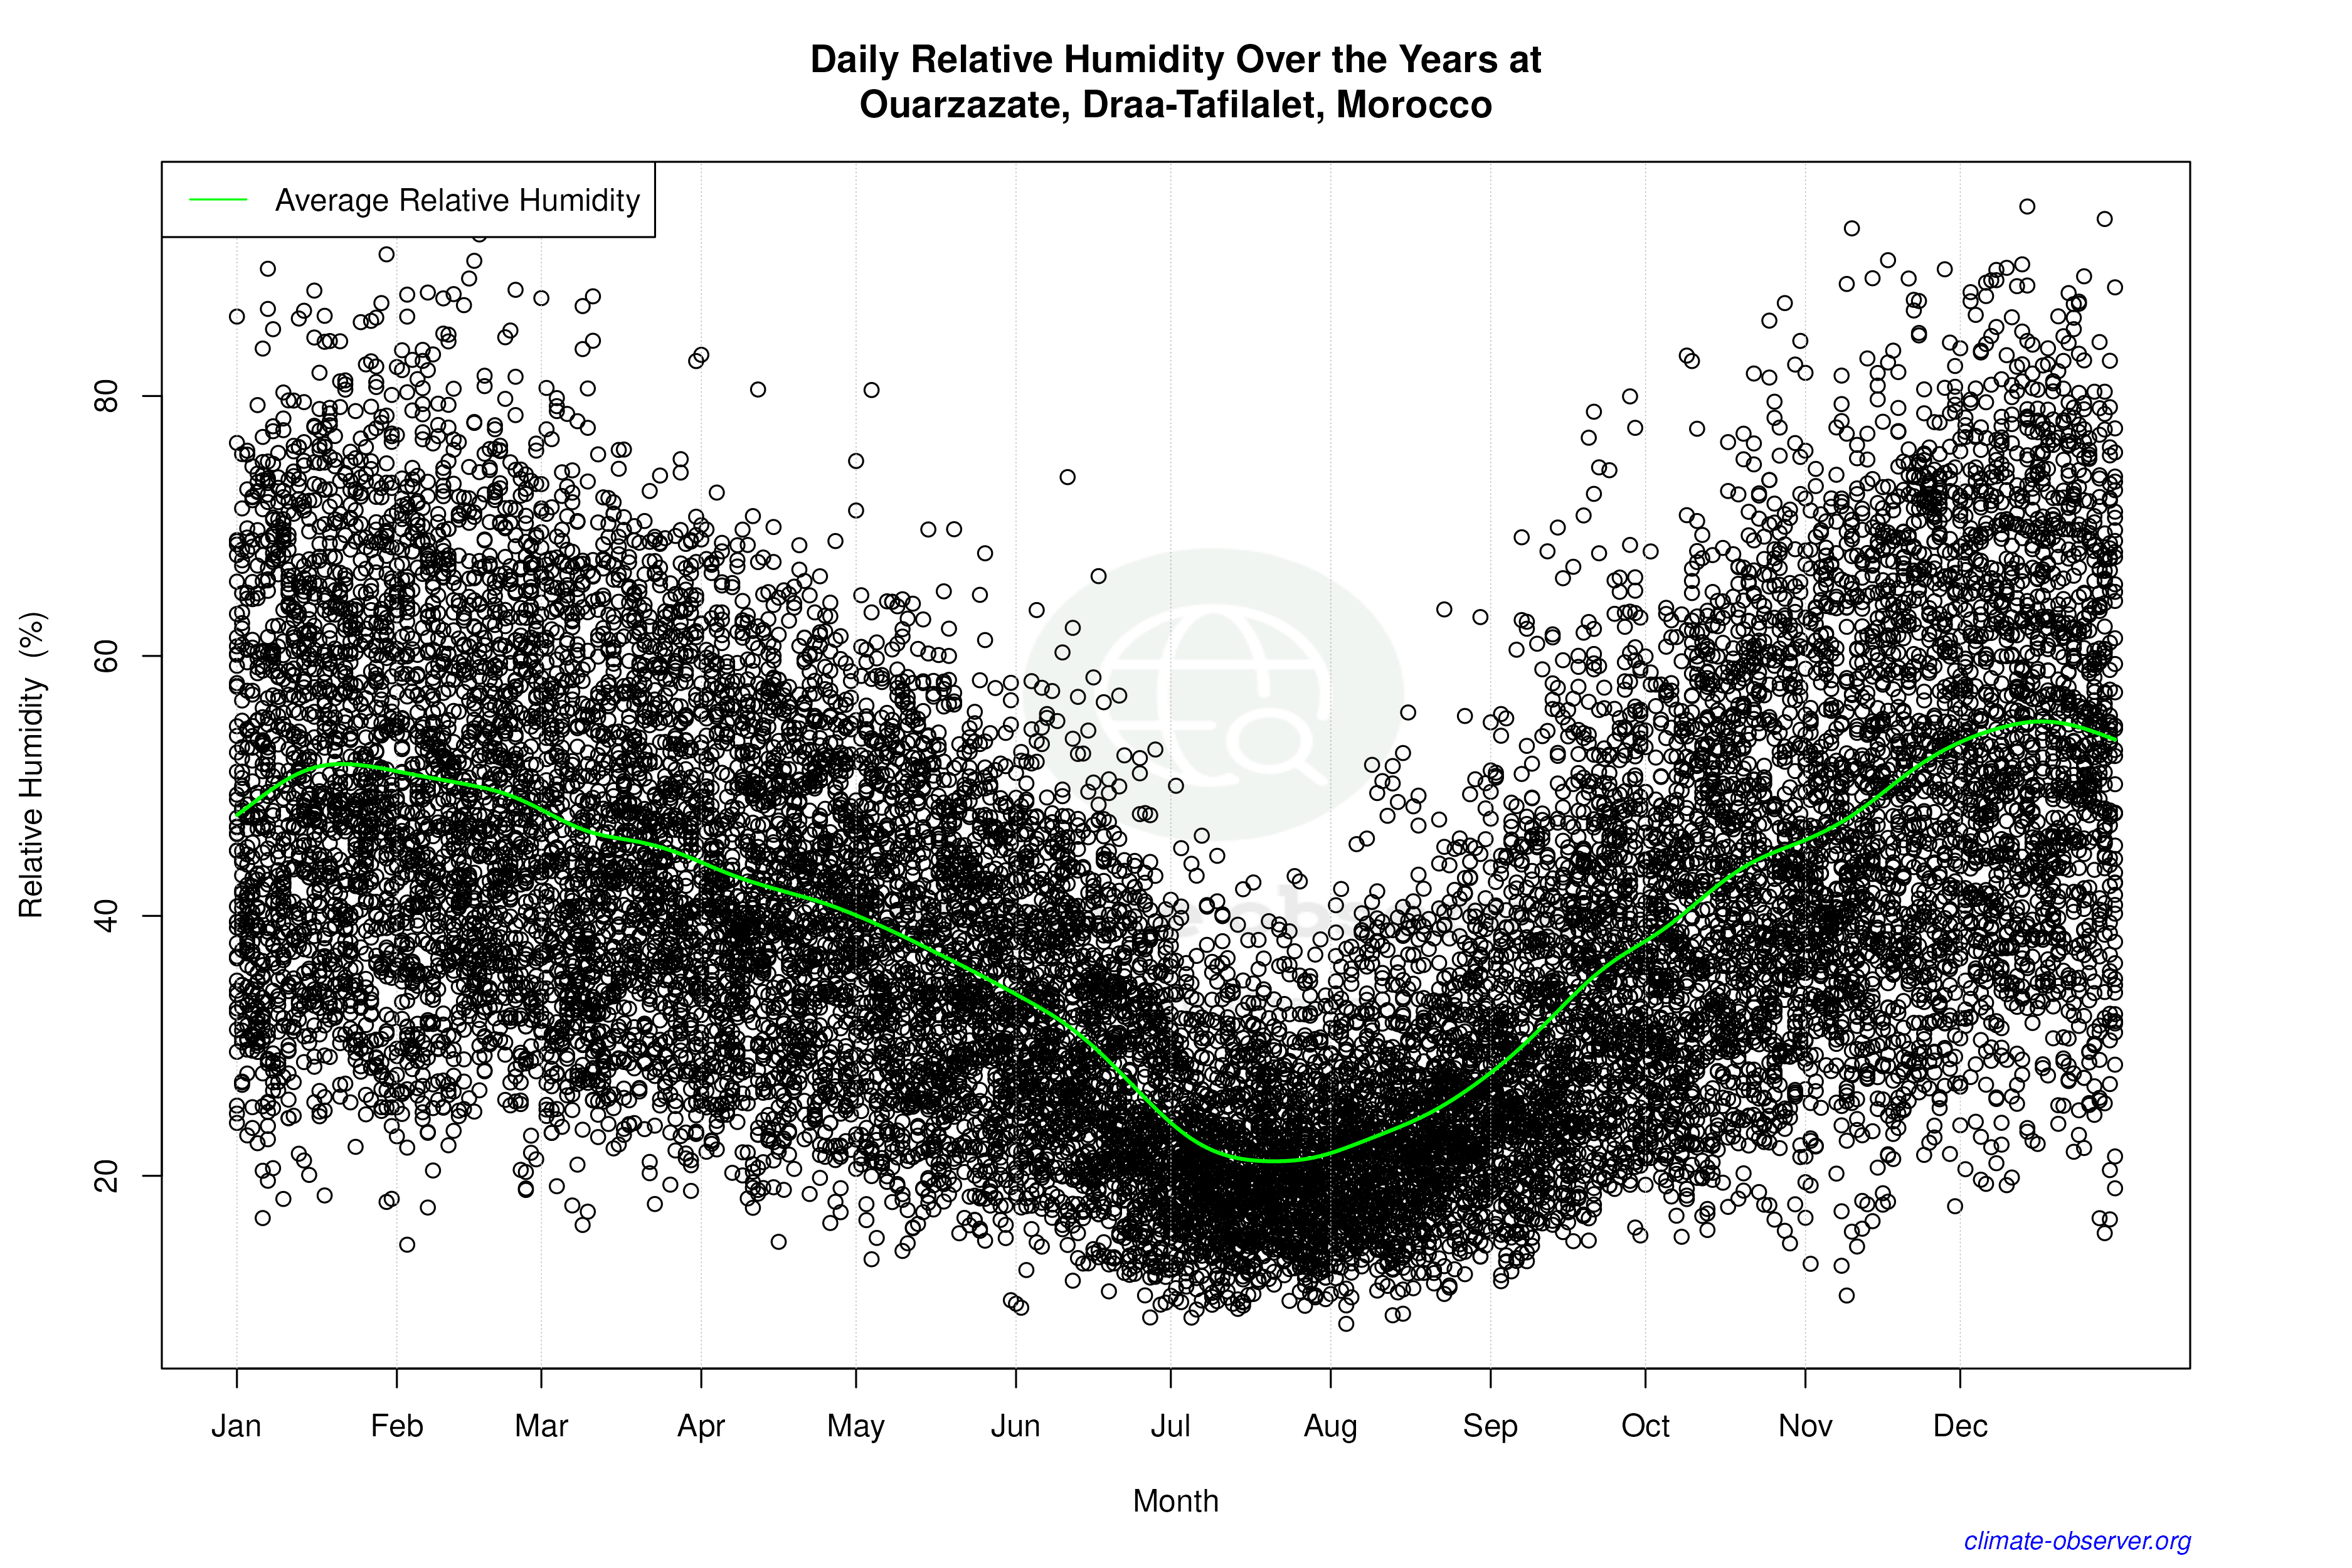
Ouarzazate, located at 30.93°N, -6.9°W, is classified under the Köppen climate classification as a hot desert climate (BWh). This classification is characterised by extremely low annual precipitation and high temperature variability. The city's geographical setting, sheltered by the Atlas Mountains, contributes to its arid conditions. The mountains act as a barrier, limiting moisture-laden winds and enhancing the desert climate's intensity.
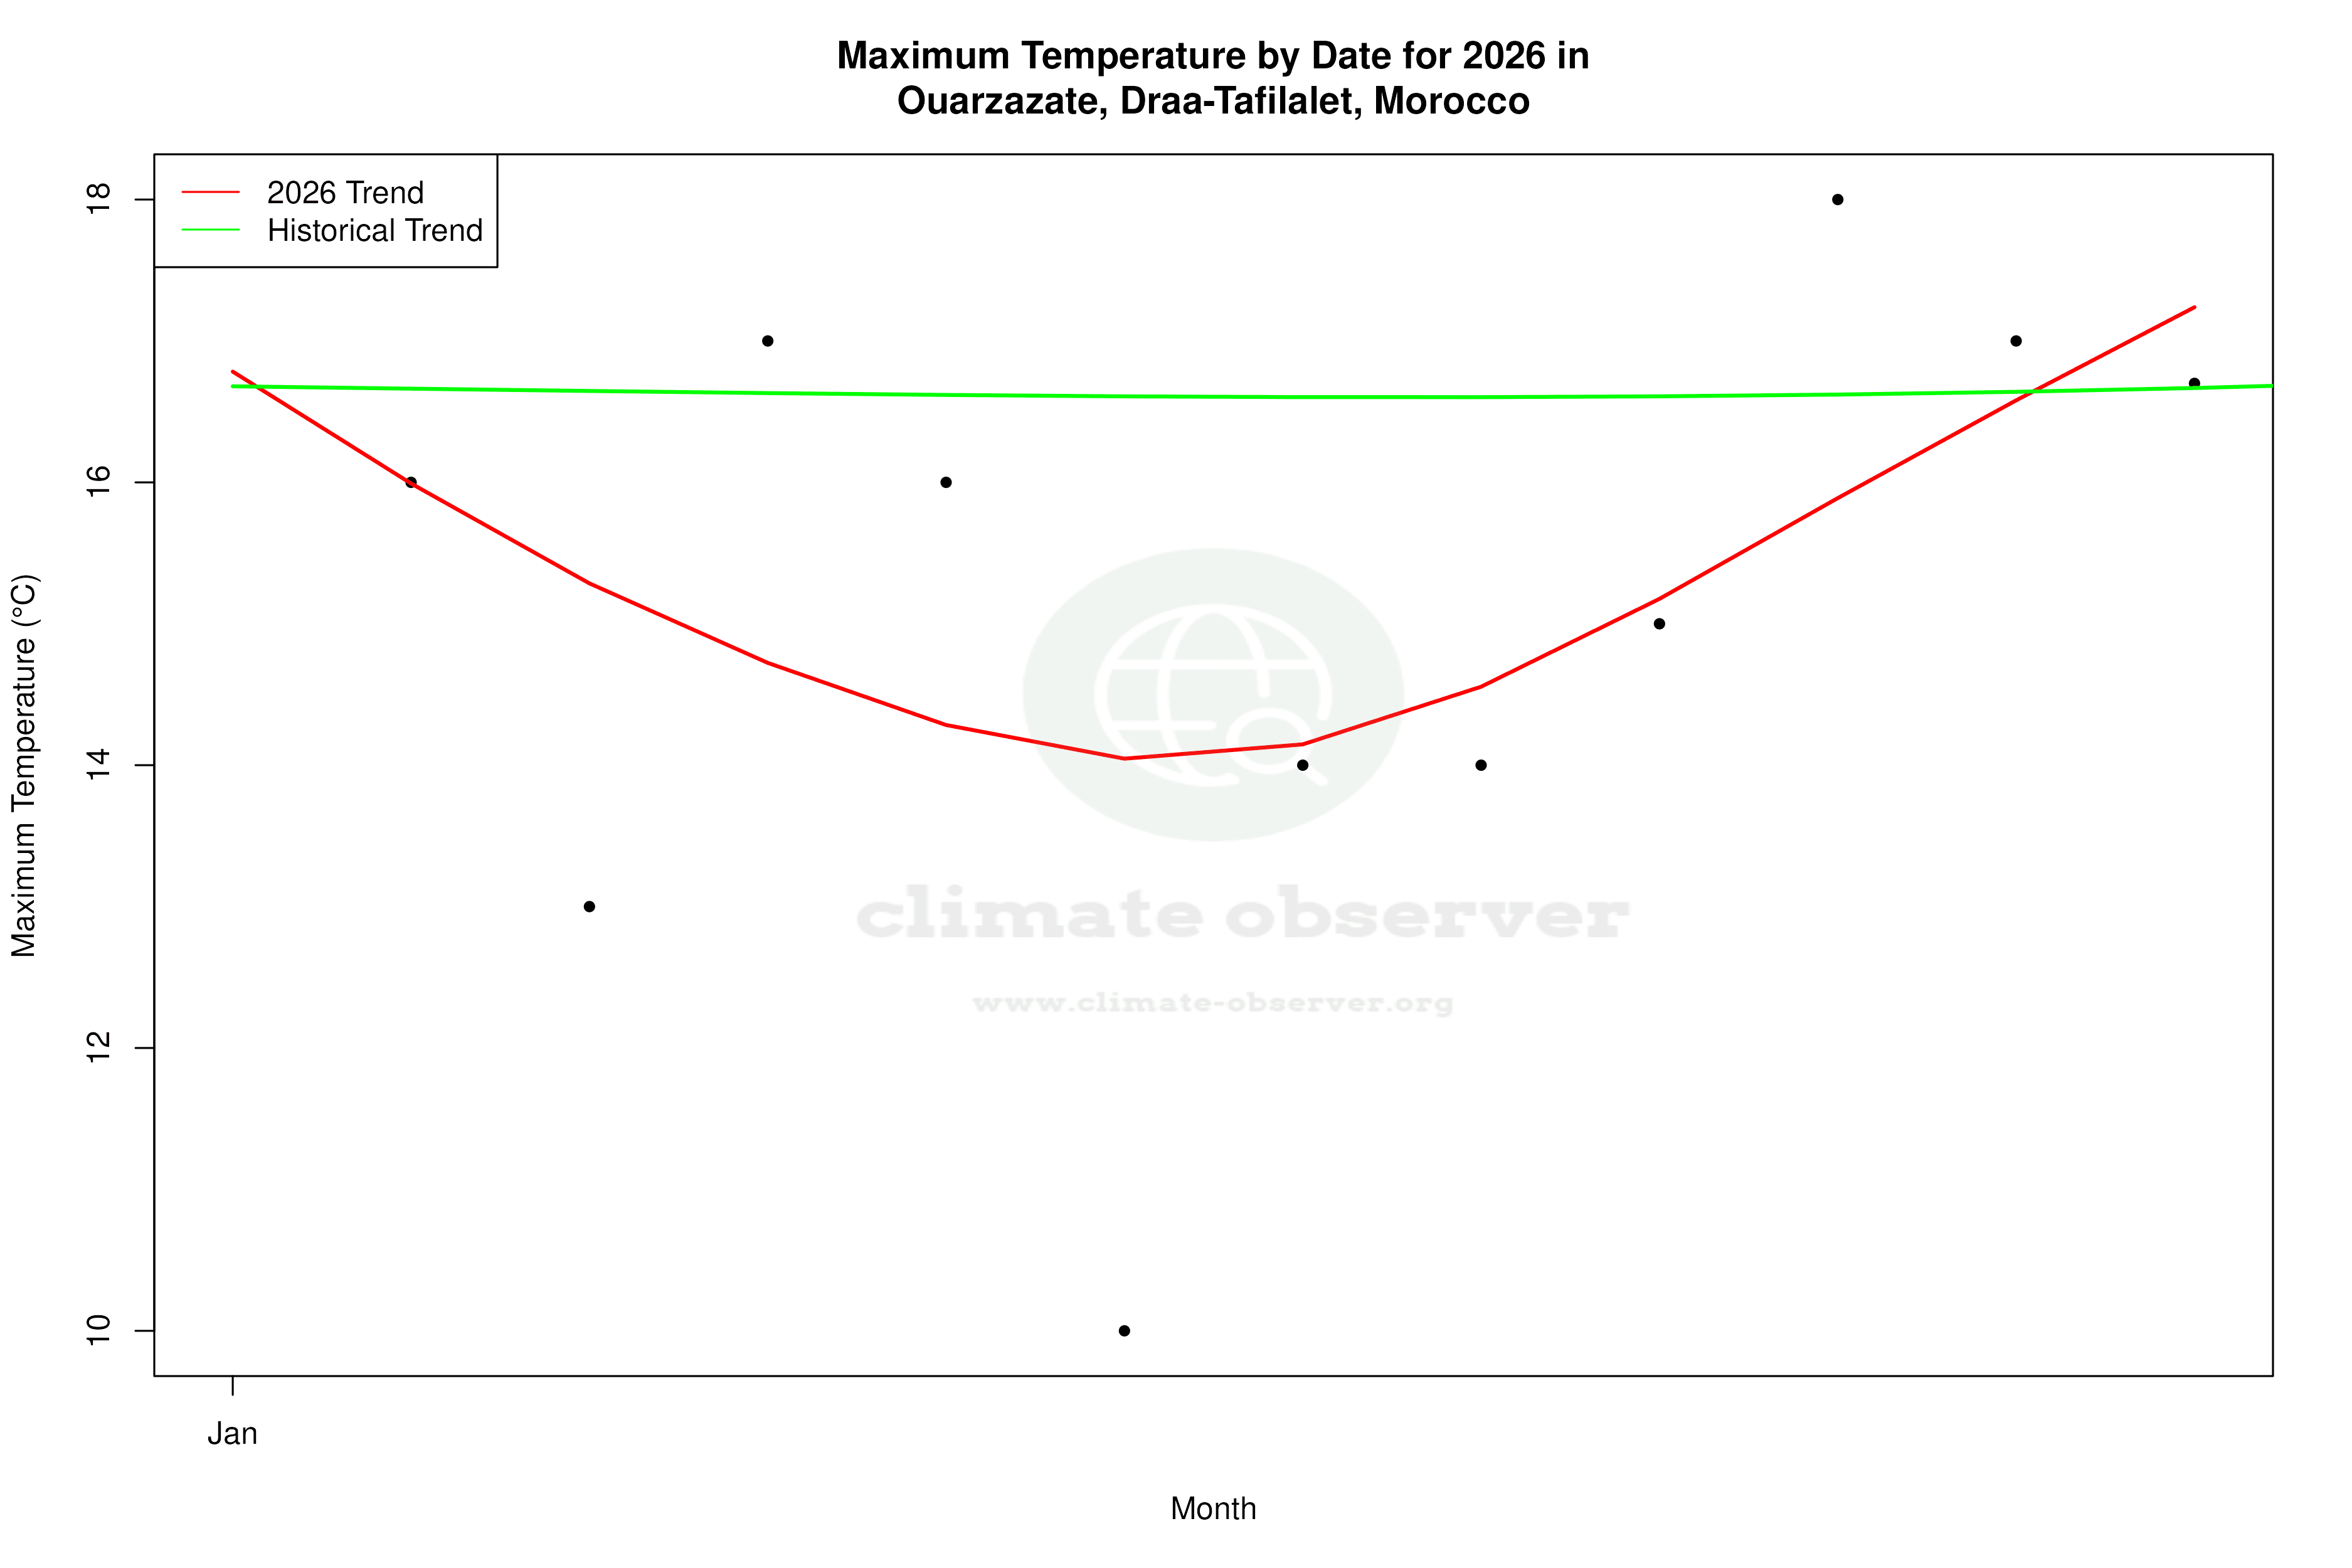
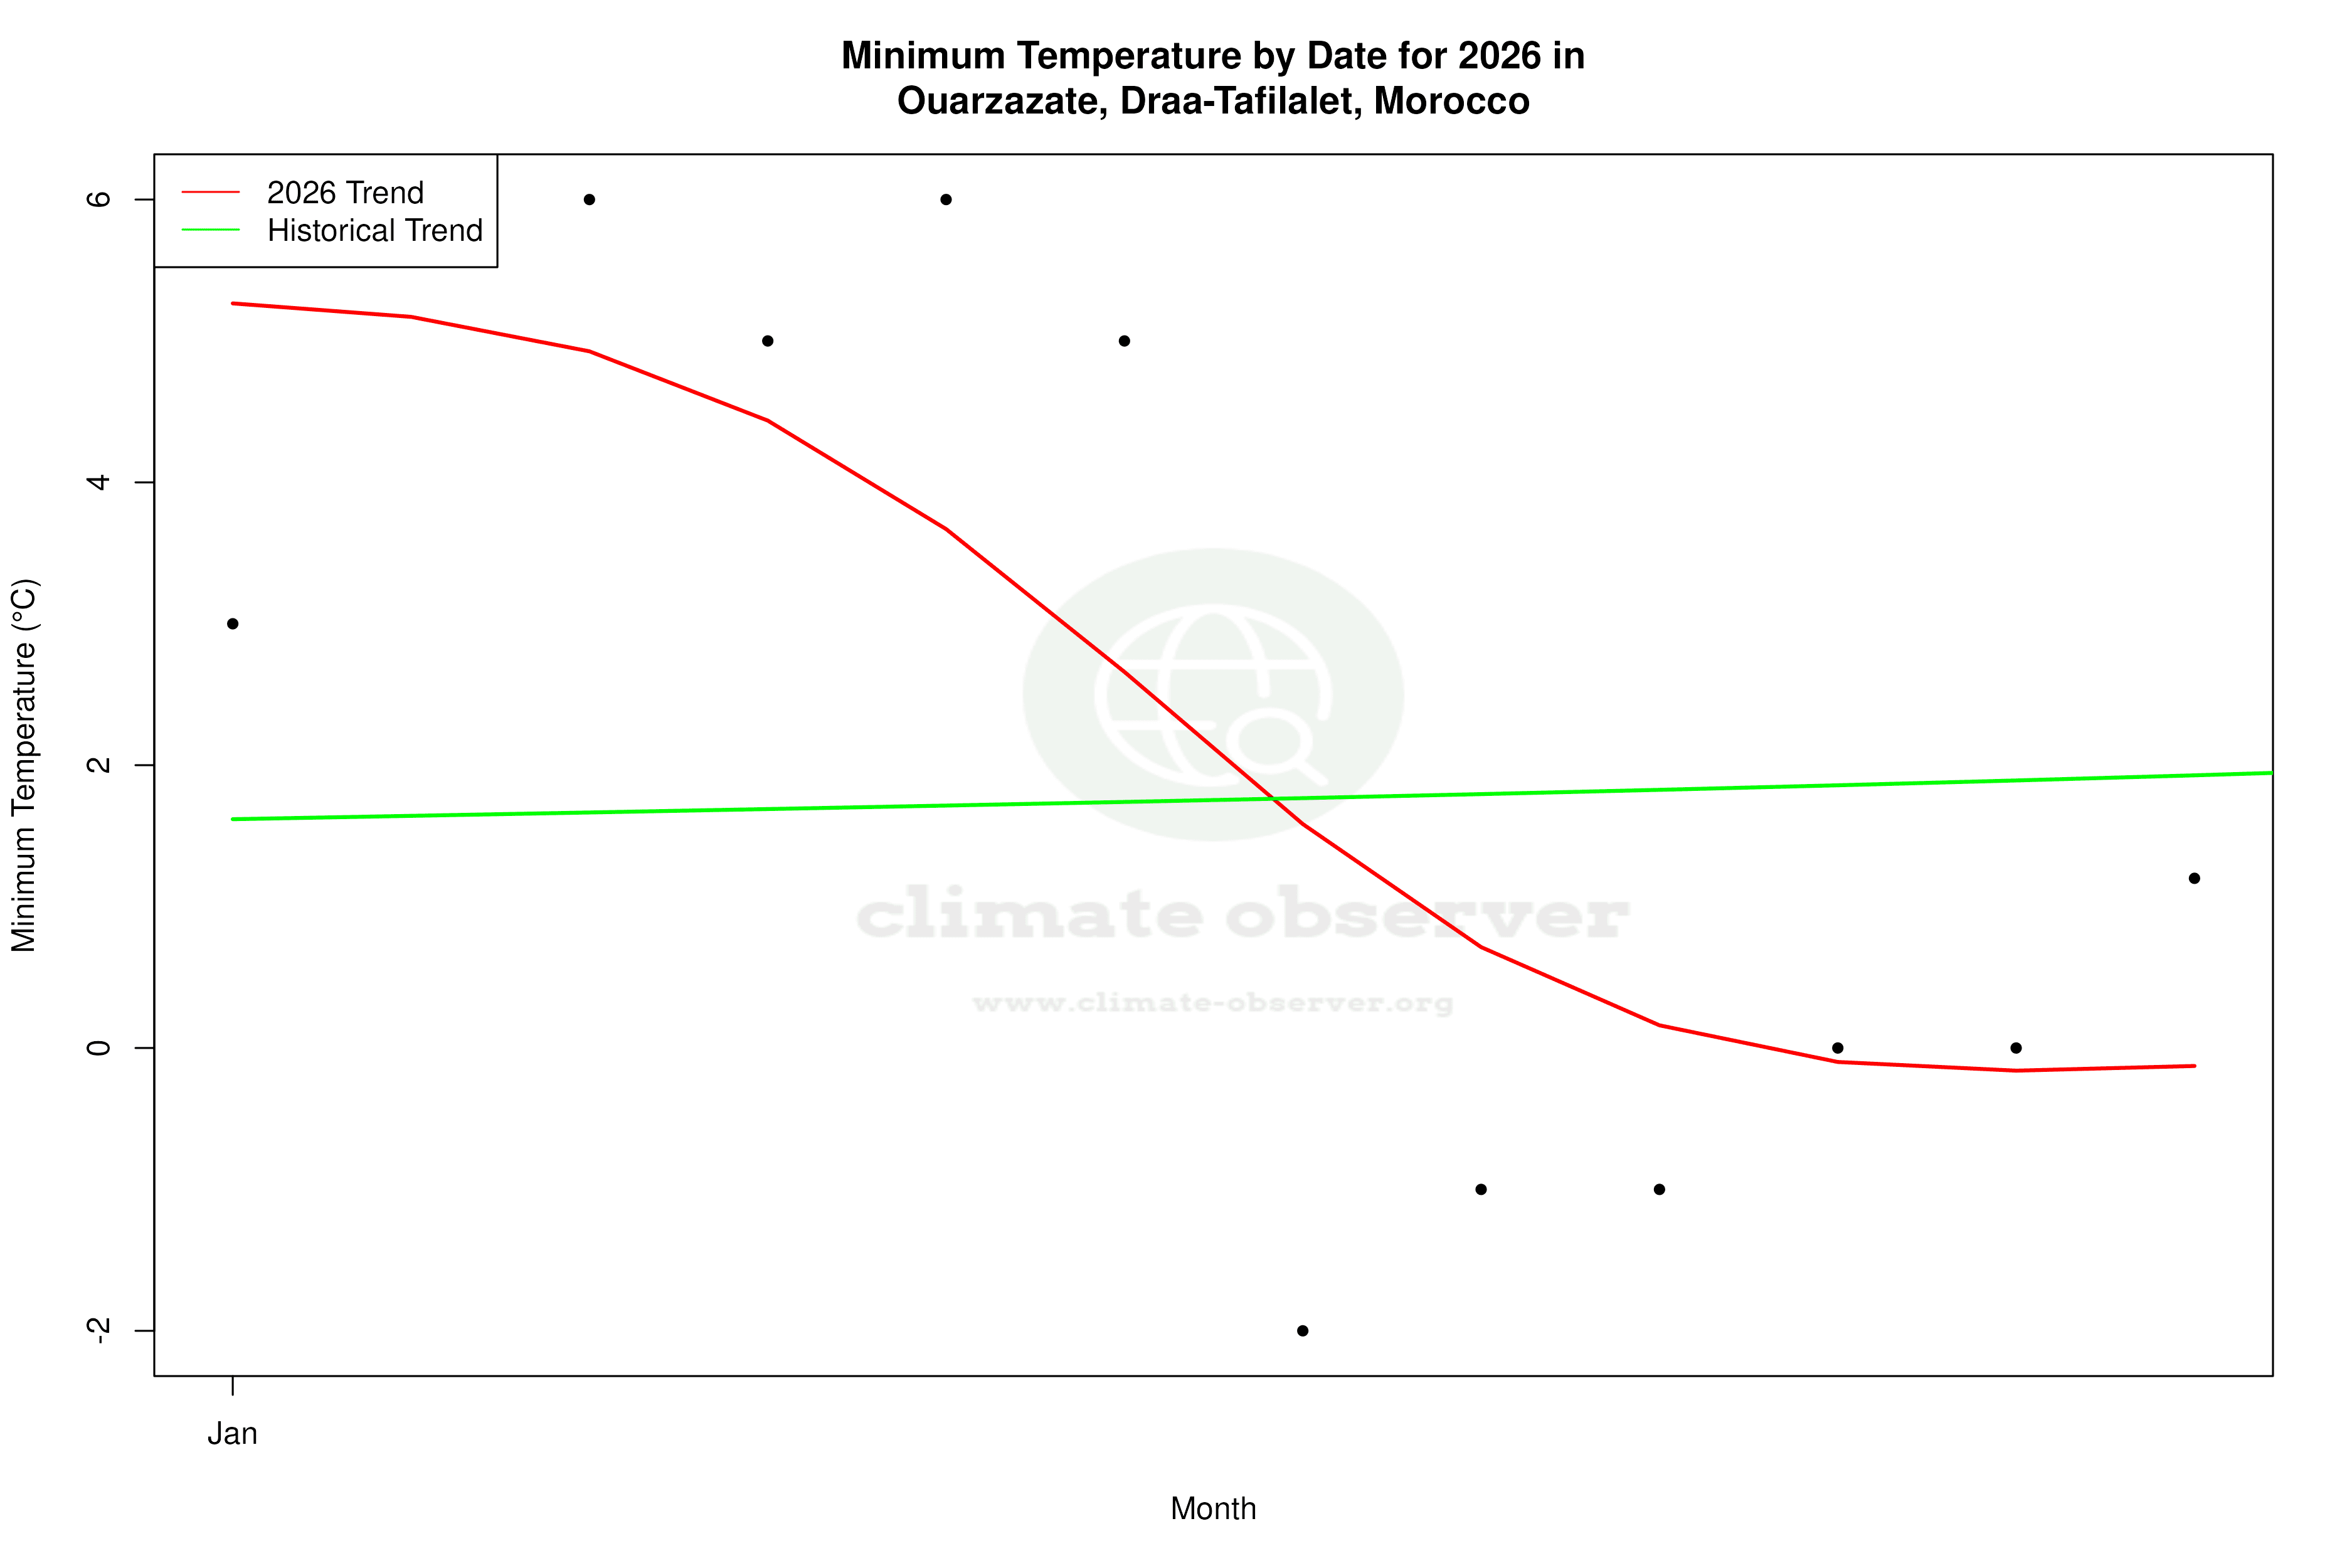
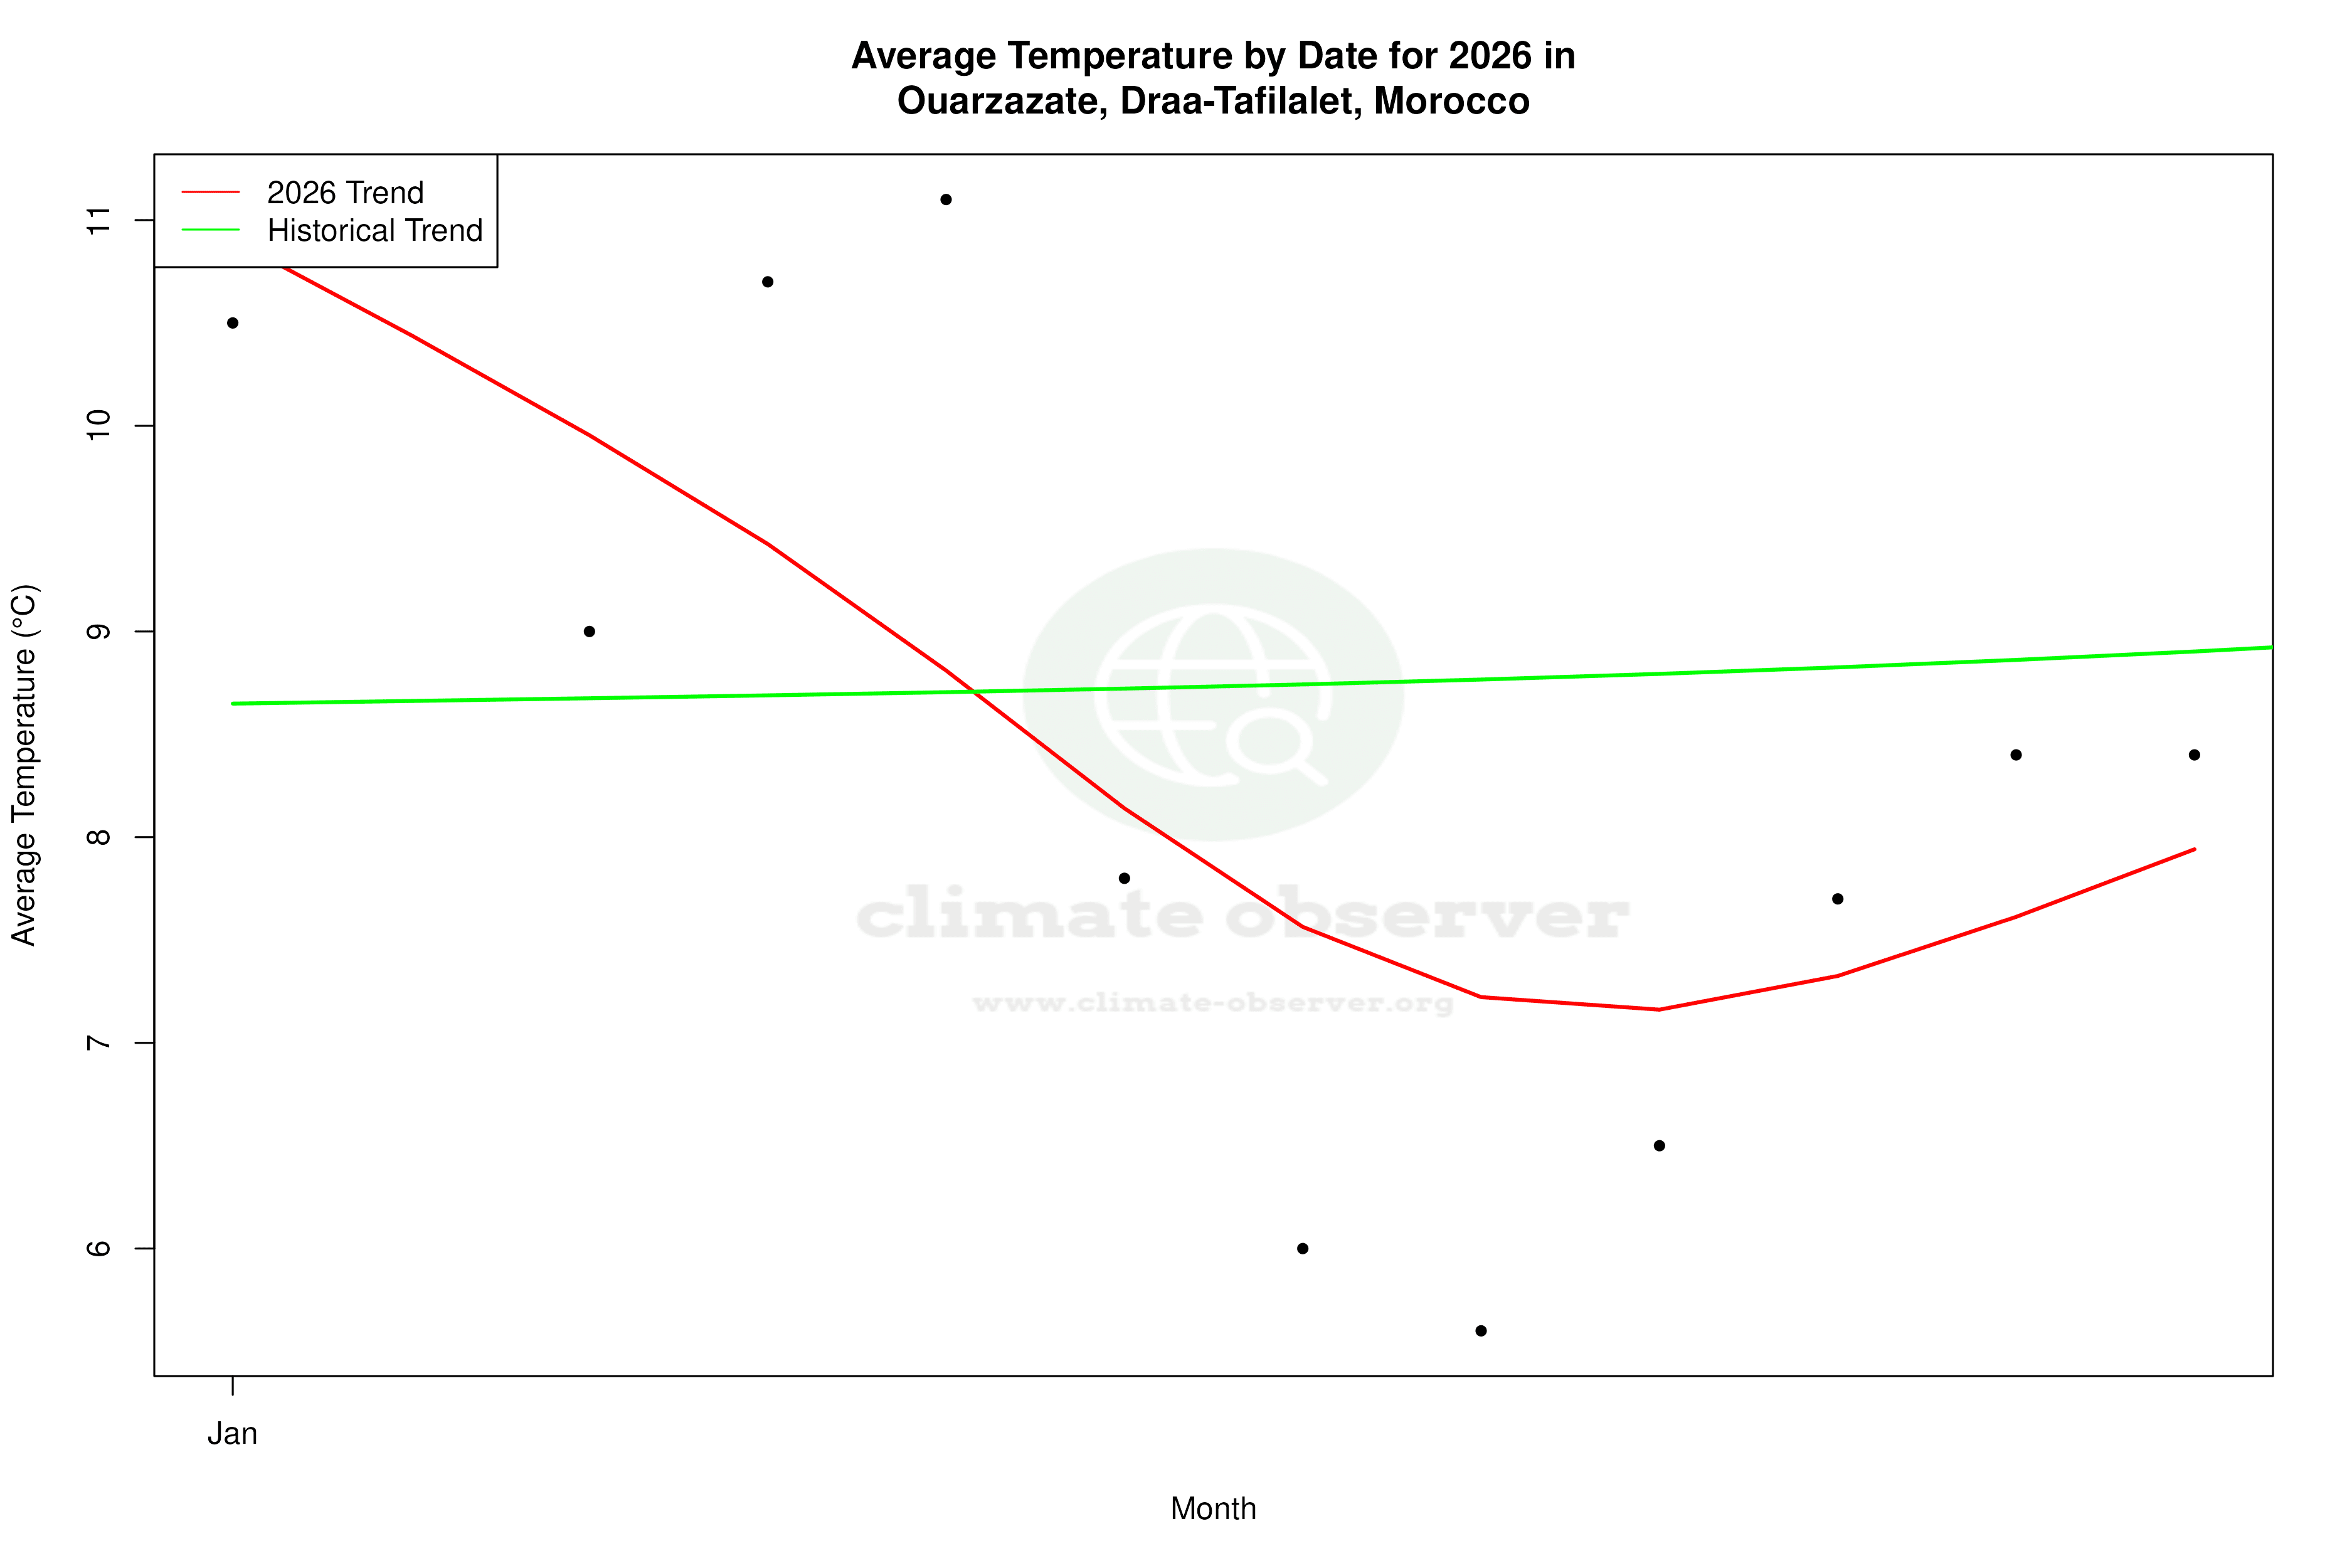
Temperature Trends: A Warming Narrative
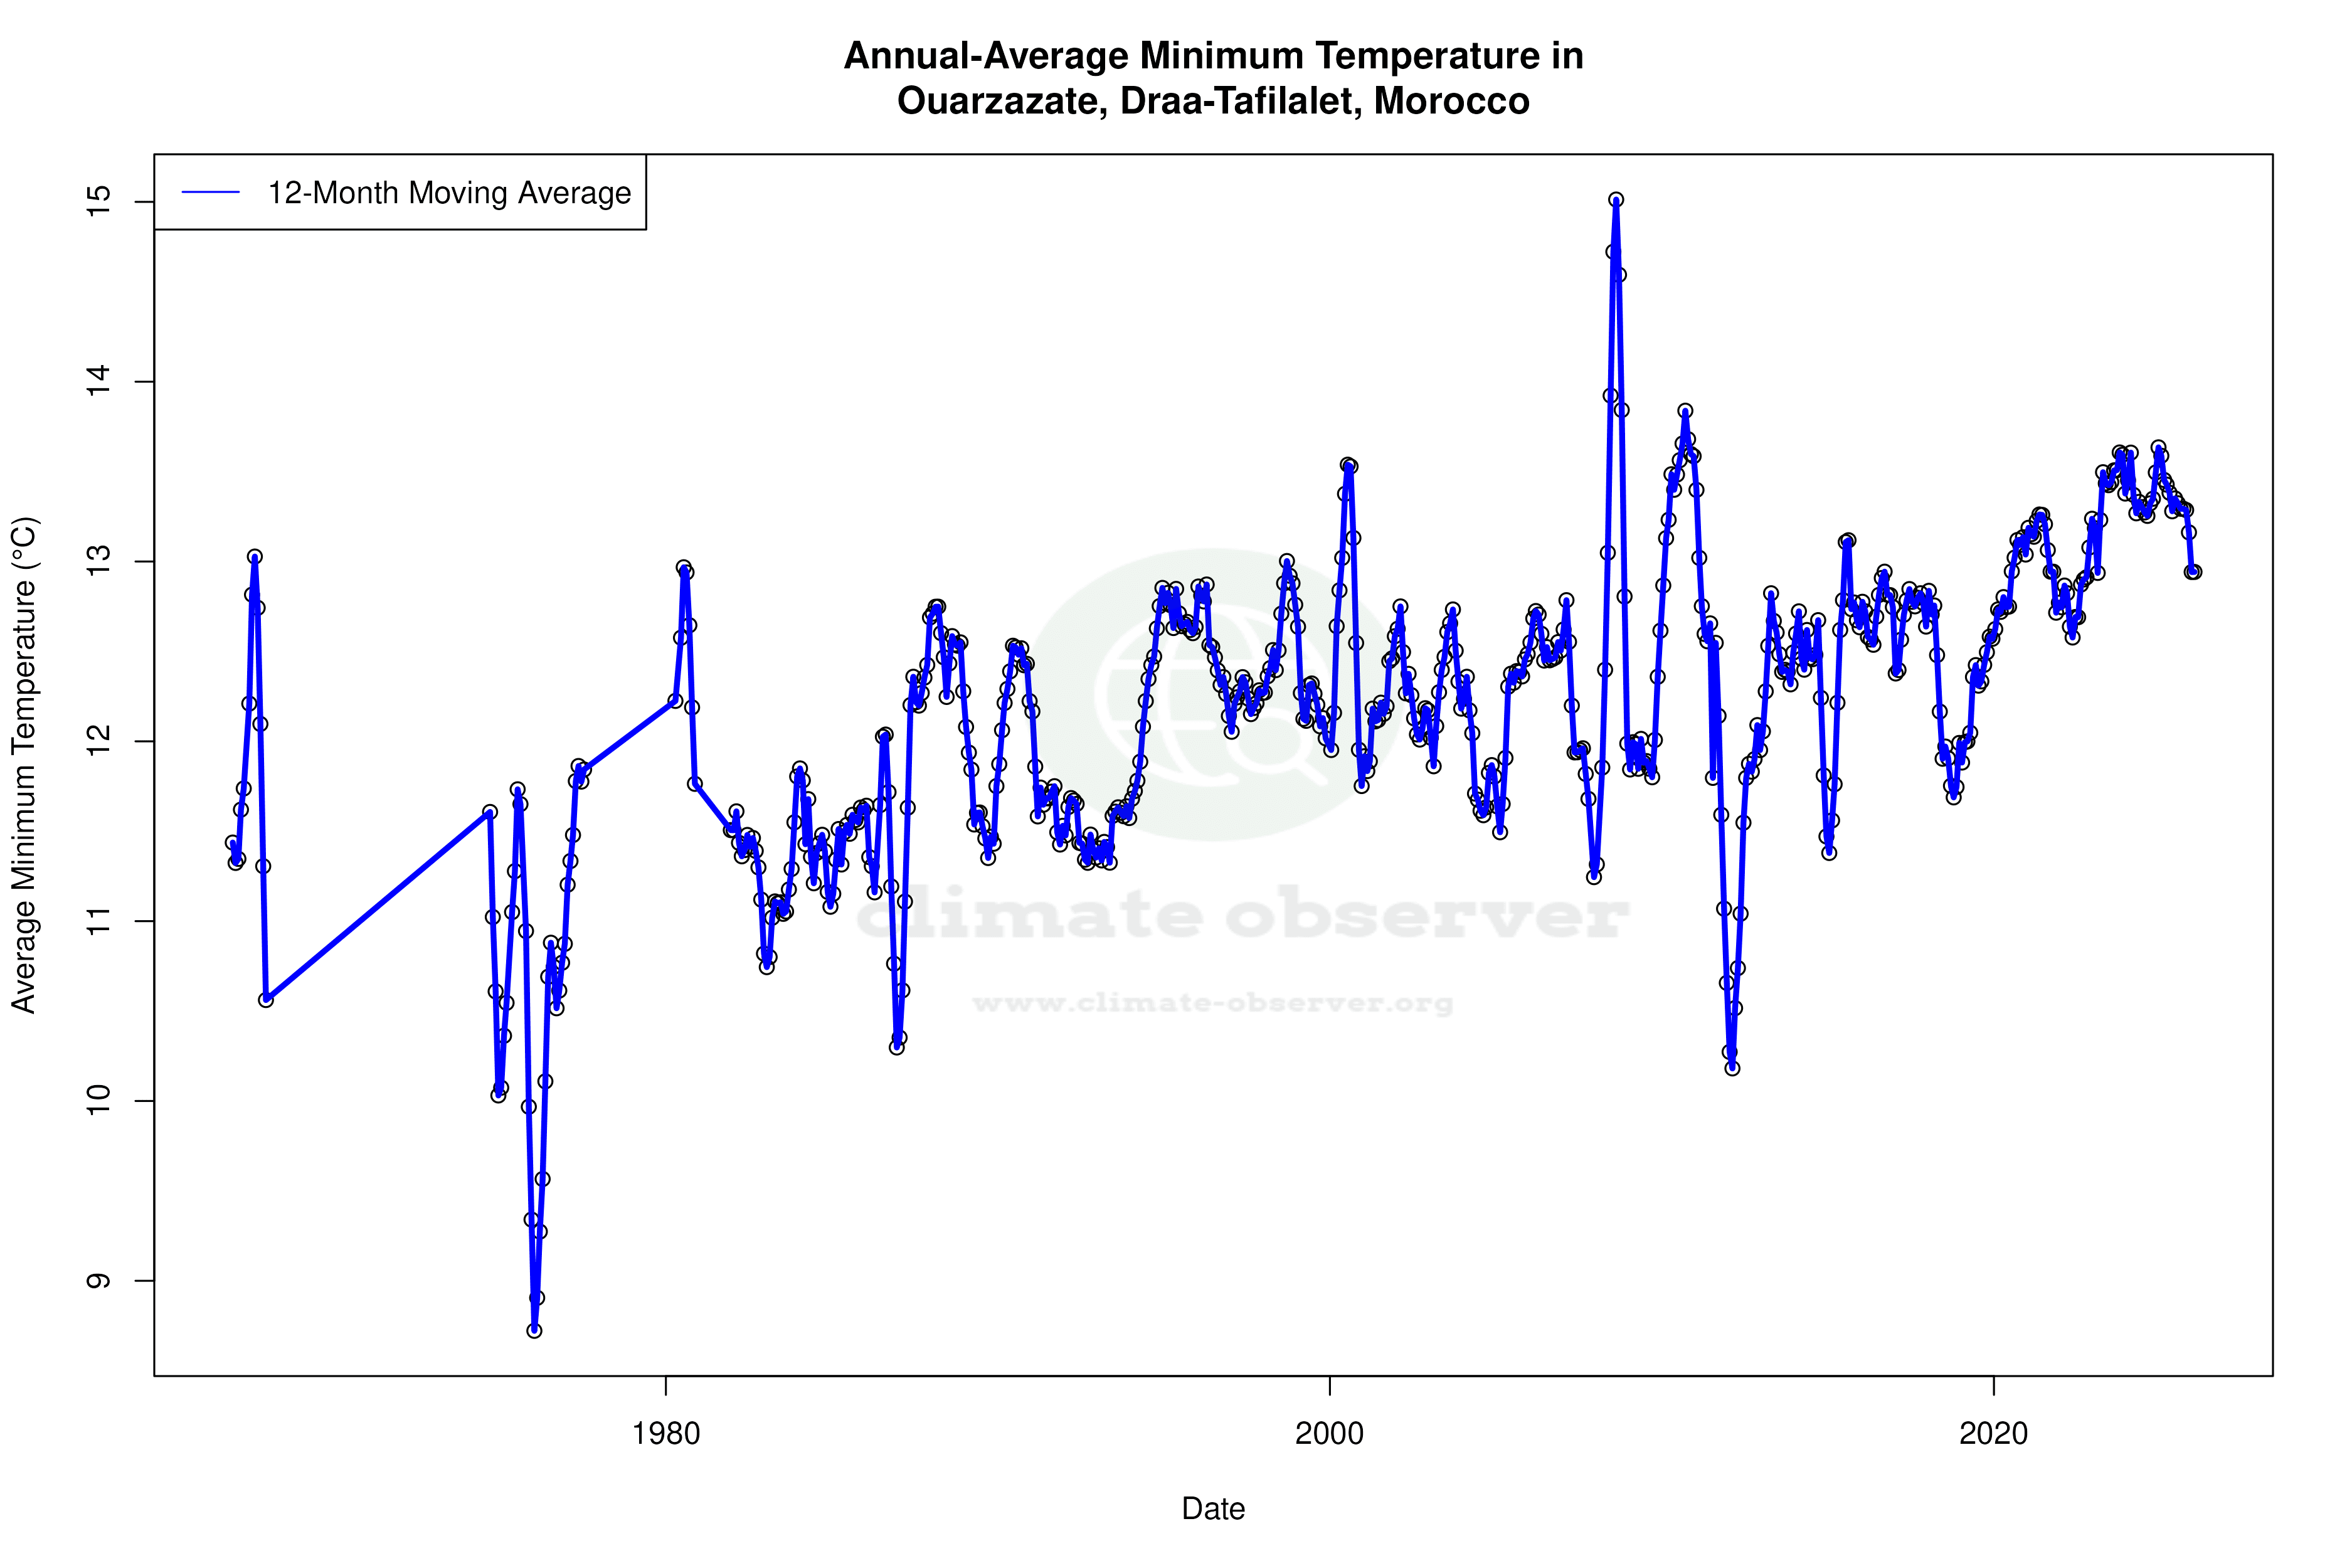
Over the past decade, Ouarzazate has experienced a warming trend, with average high temperatures increasing by 1.07°C (1.93°F) and lows by 1.11°C (2.00°F). This recent trend is more pronounced than the all-time trends, which show a rise of 0.45°C (0.81°F) for highs and 0.34°C (0.61°F) for lows. The divergence between the 10-year and all-time trends suggests an acceleration in warming, a critical insight for regional climate strategies.
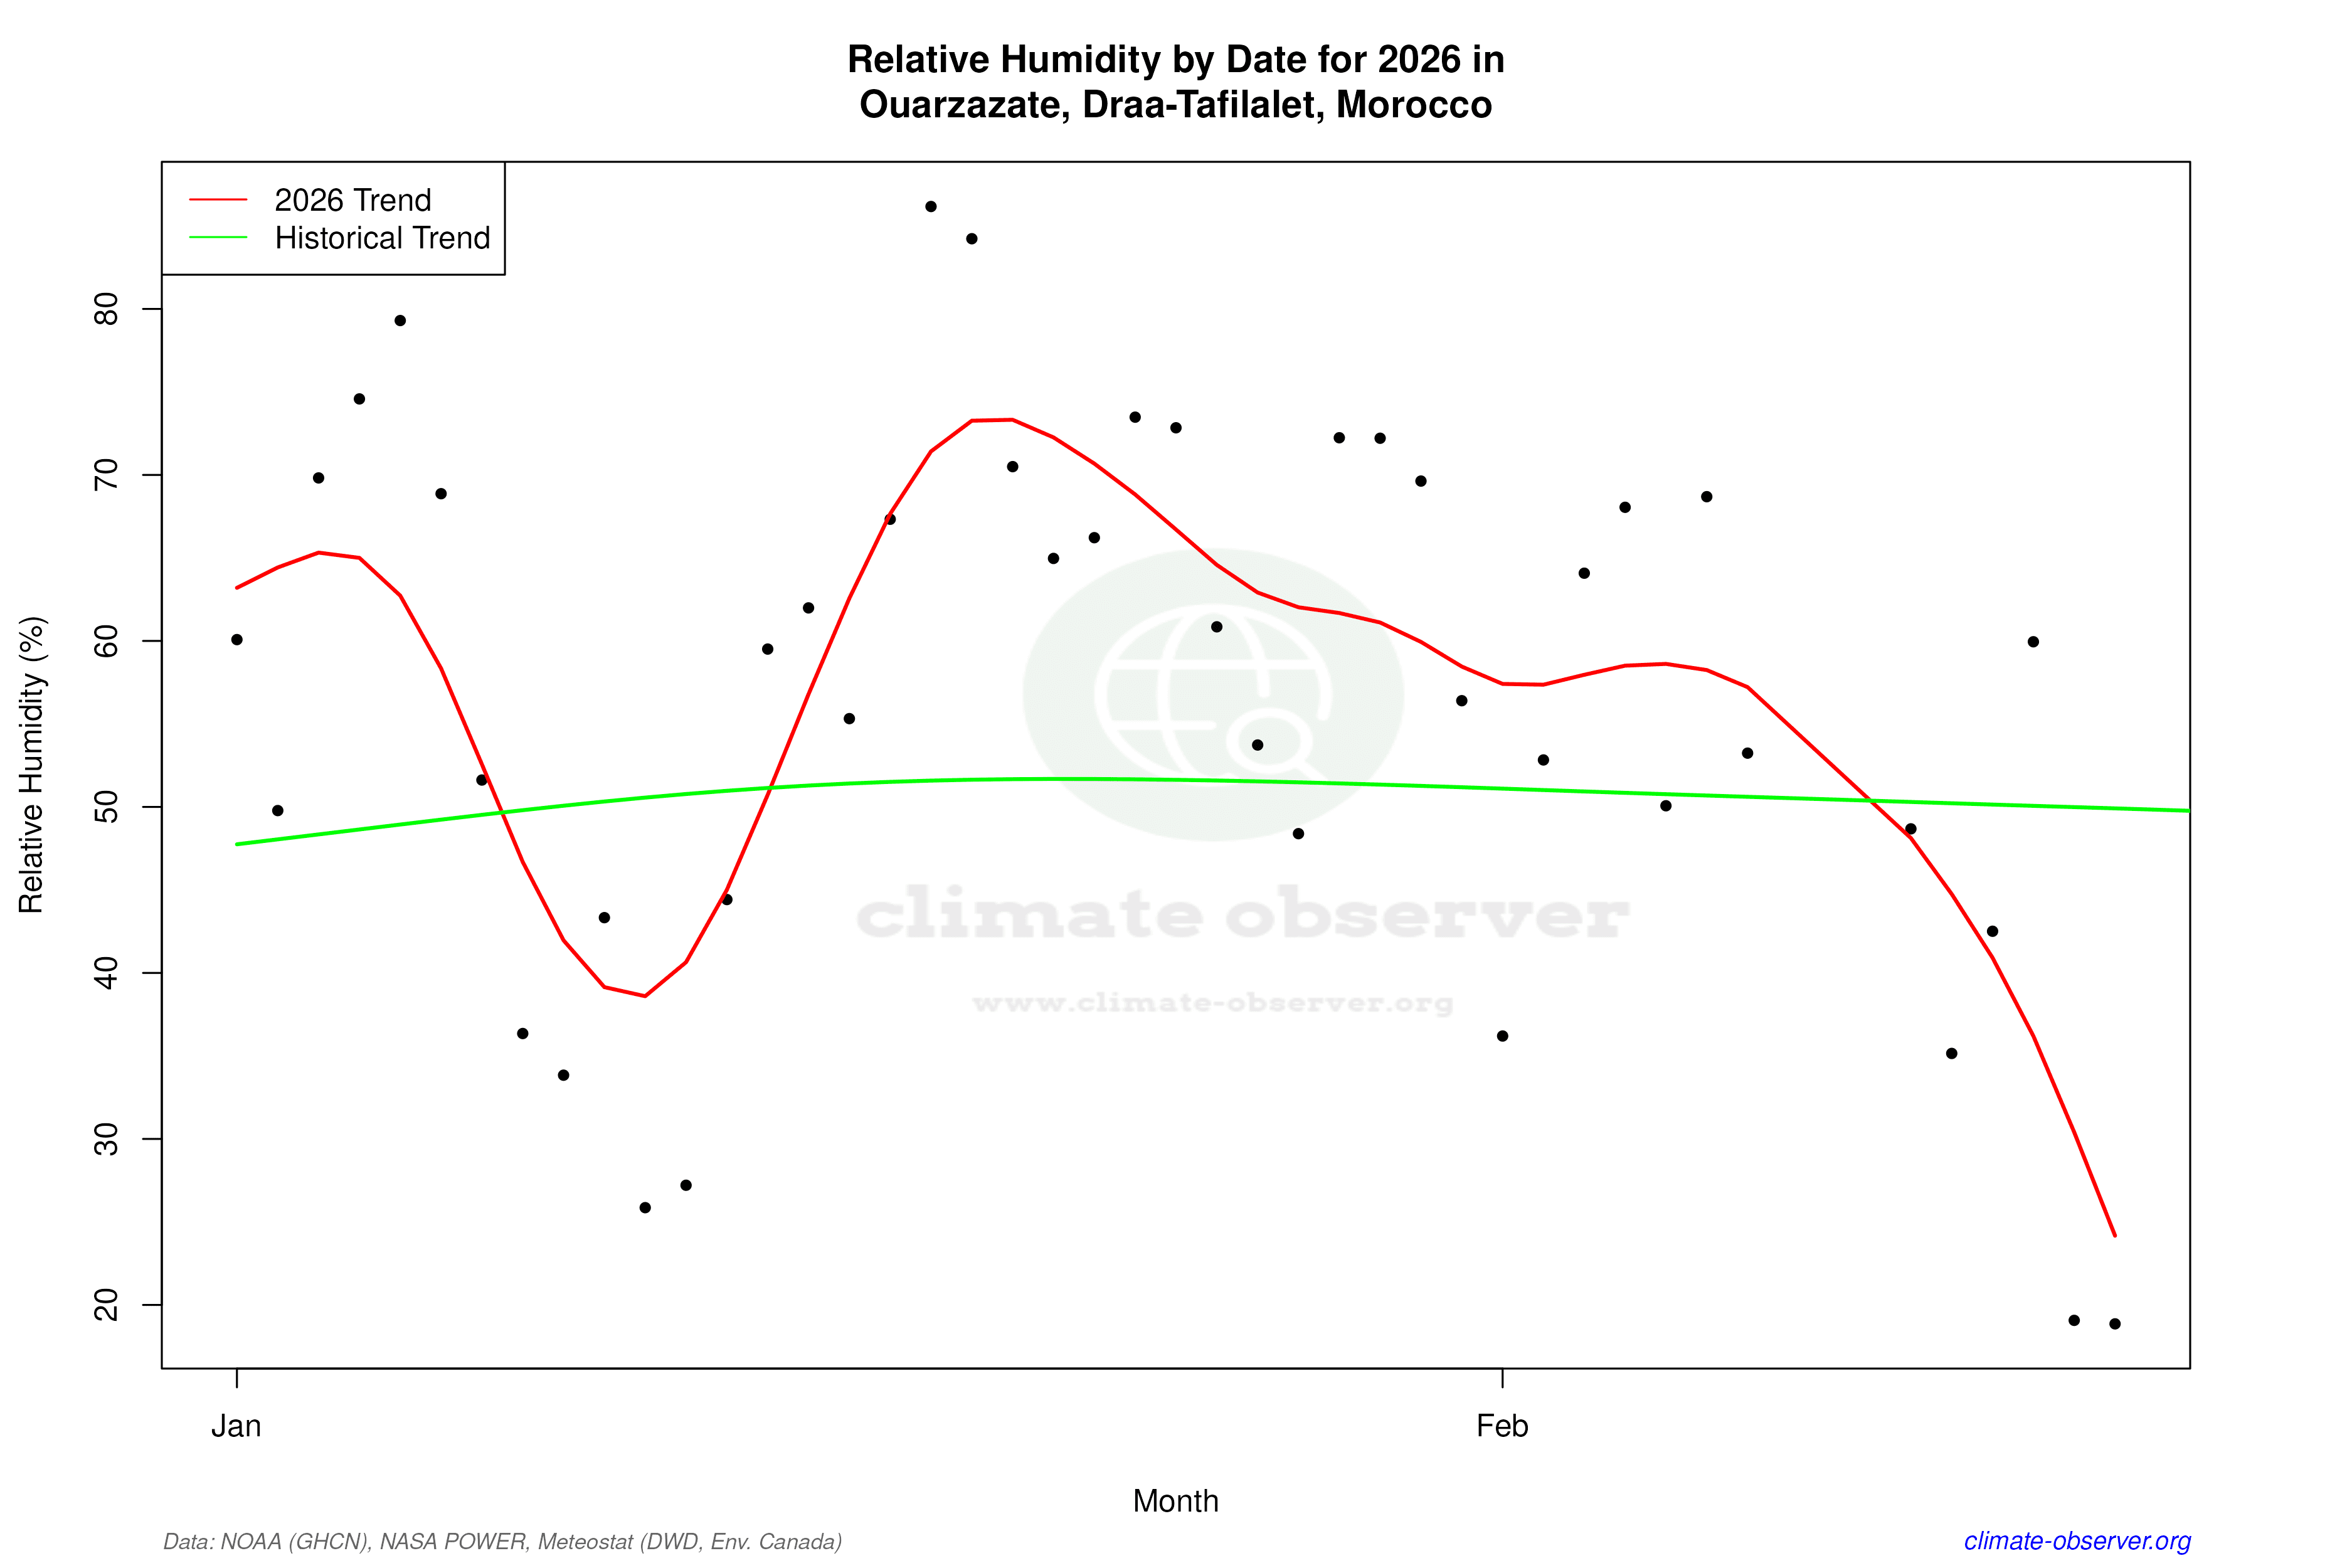
Precipitation Patterns: Intensifying Events
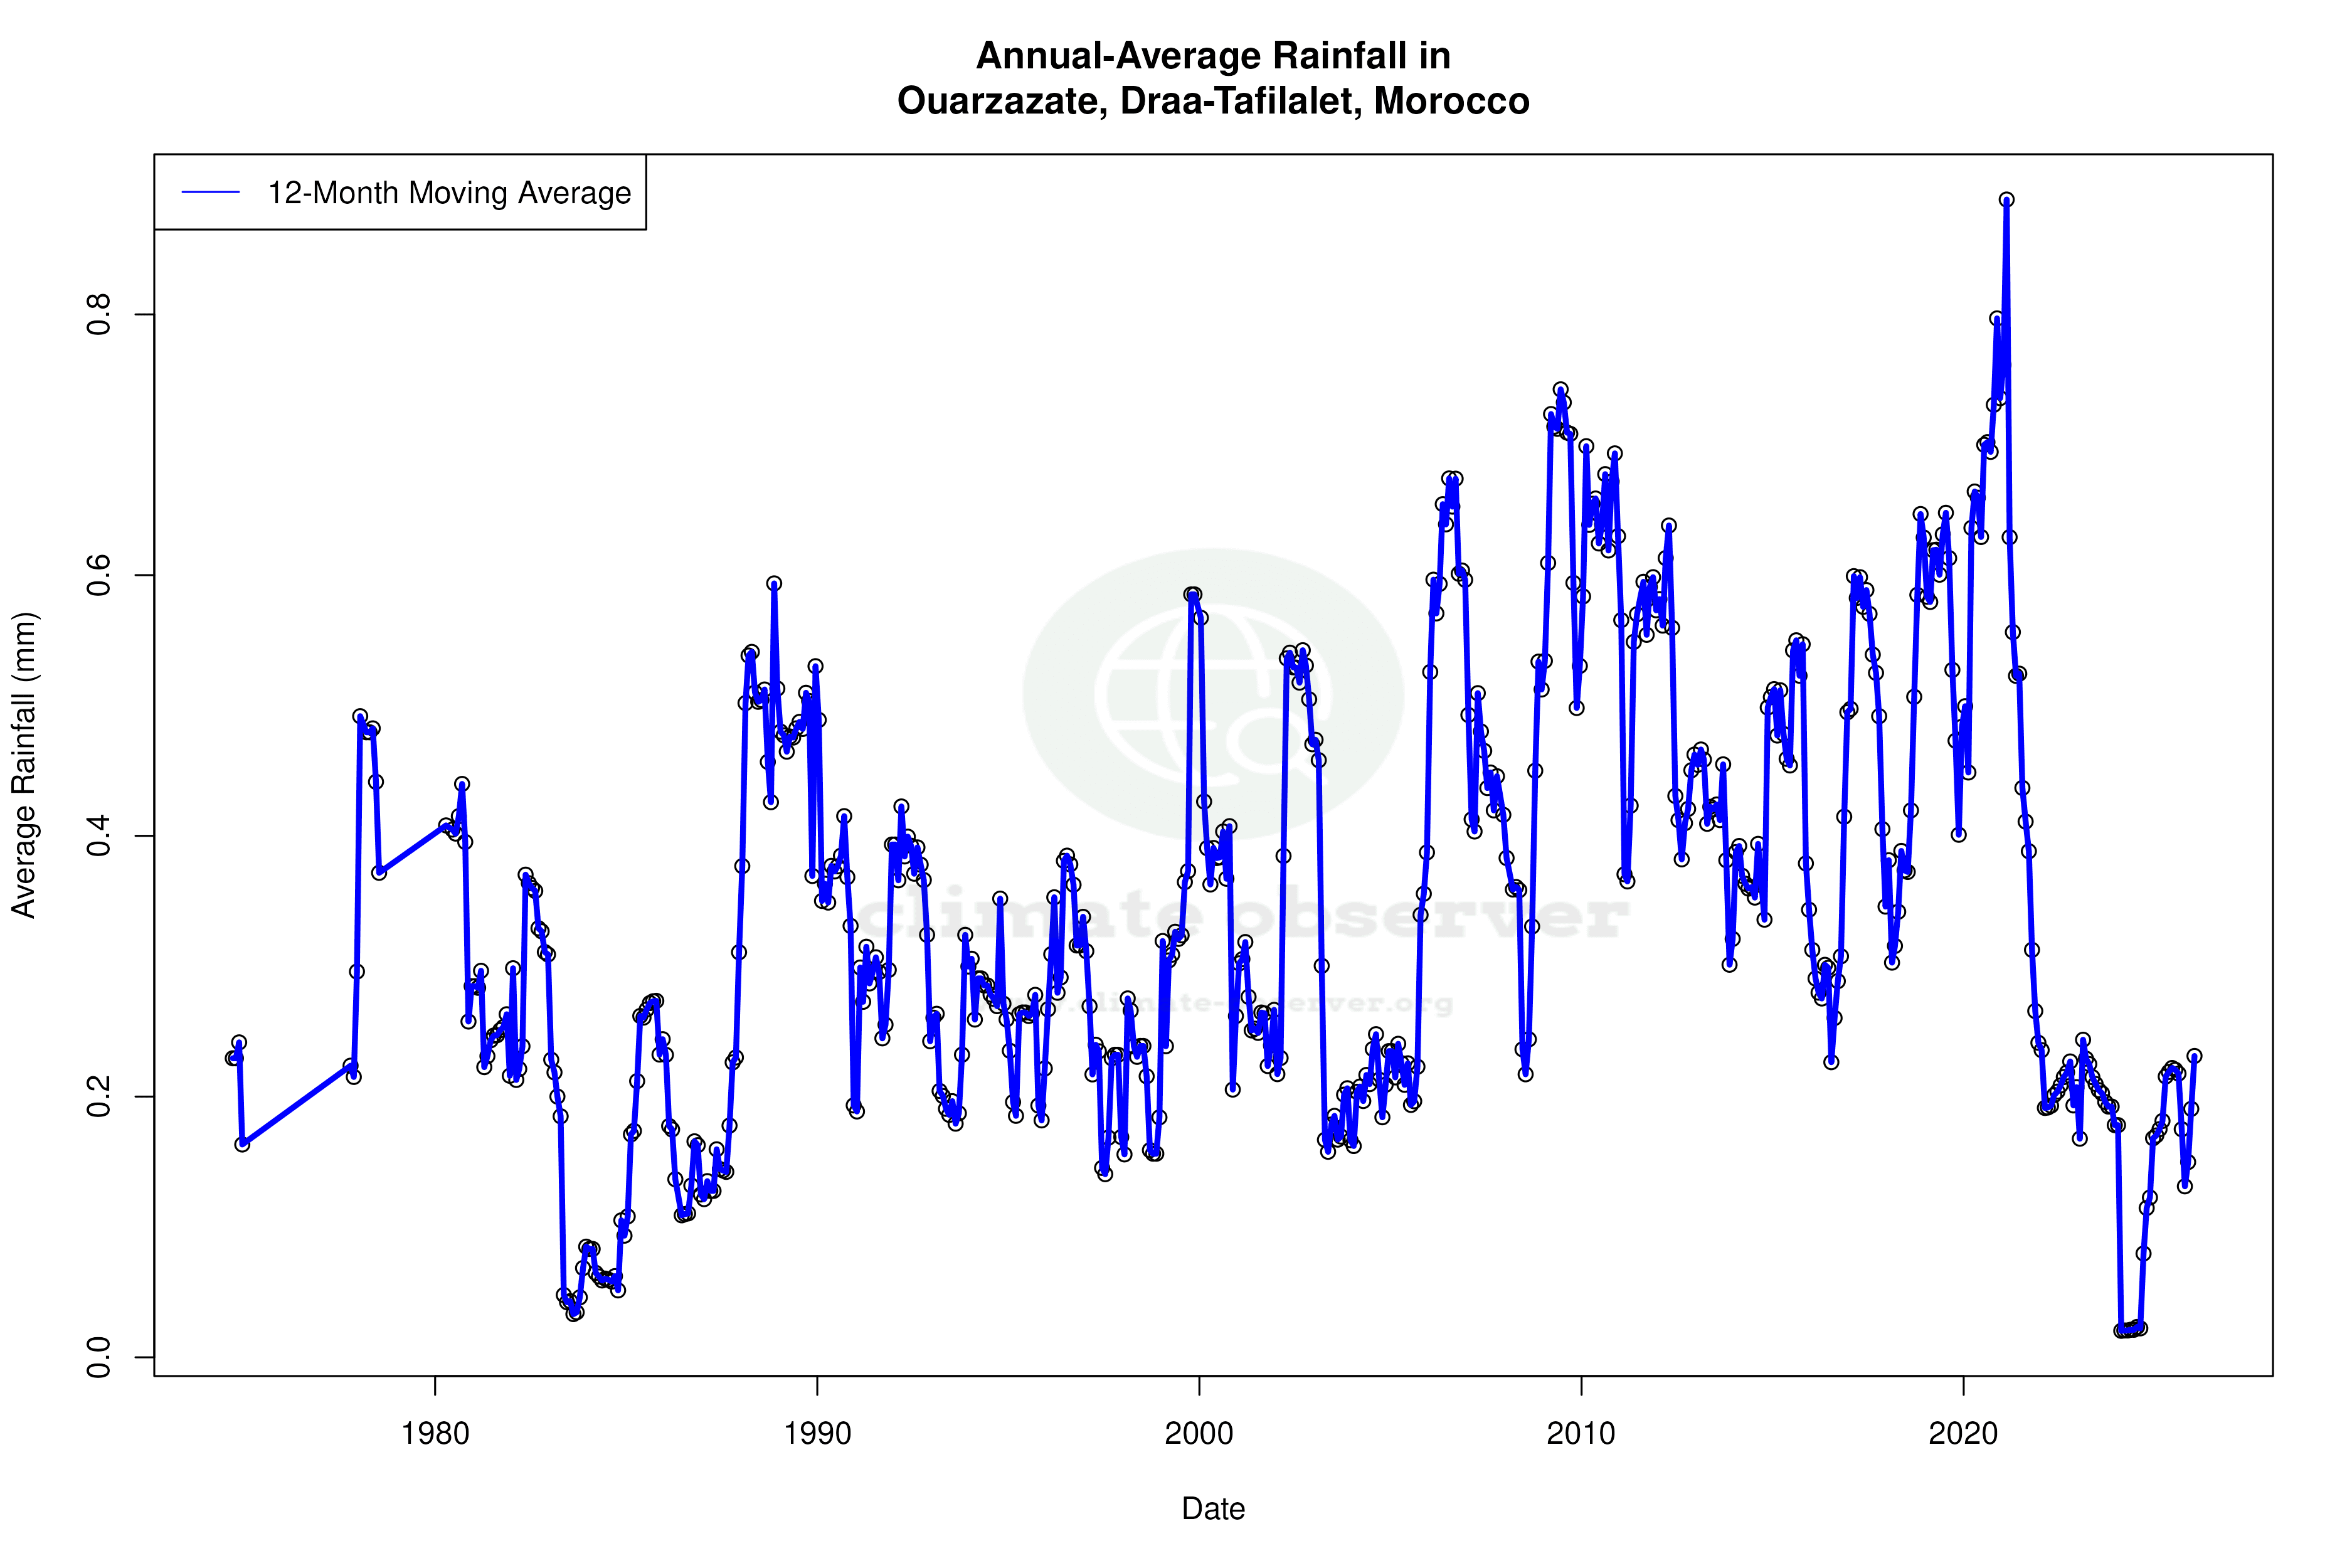
The Precipitation Concentration Index (PCI) for Ouarzazate has risen from a baseline of 18.2 to a current value of 21.0, indicating a significant increase in the concentration of precipitation events. This shift means that rainfall is occurring less frequently but in more intense bursts, a pattern that can lead to flash floods and erosion, challenging local infrastructure and agriculture.
Record Extremes: The Limits of Heat and Cold
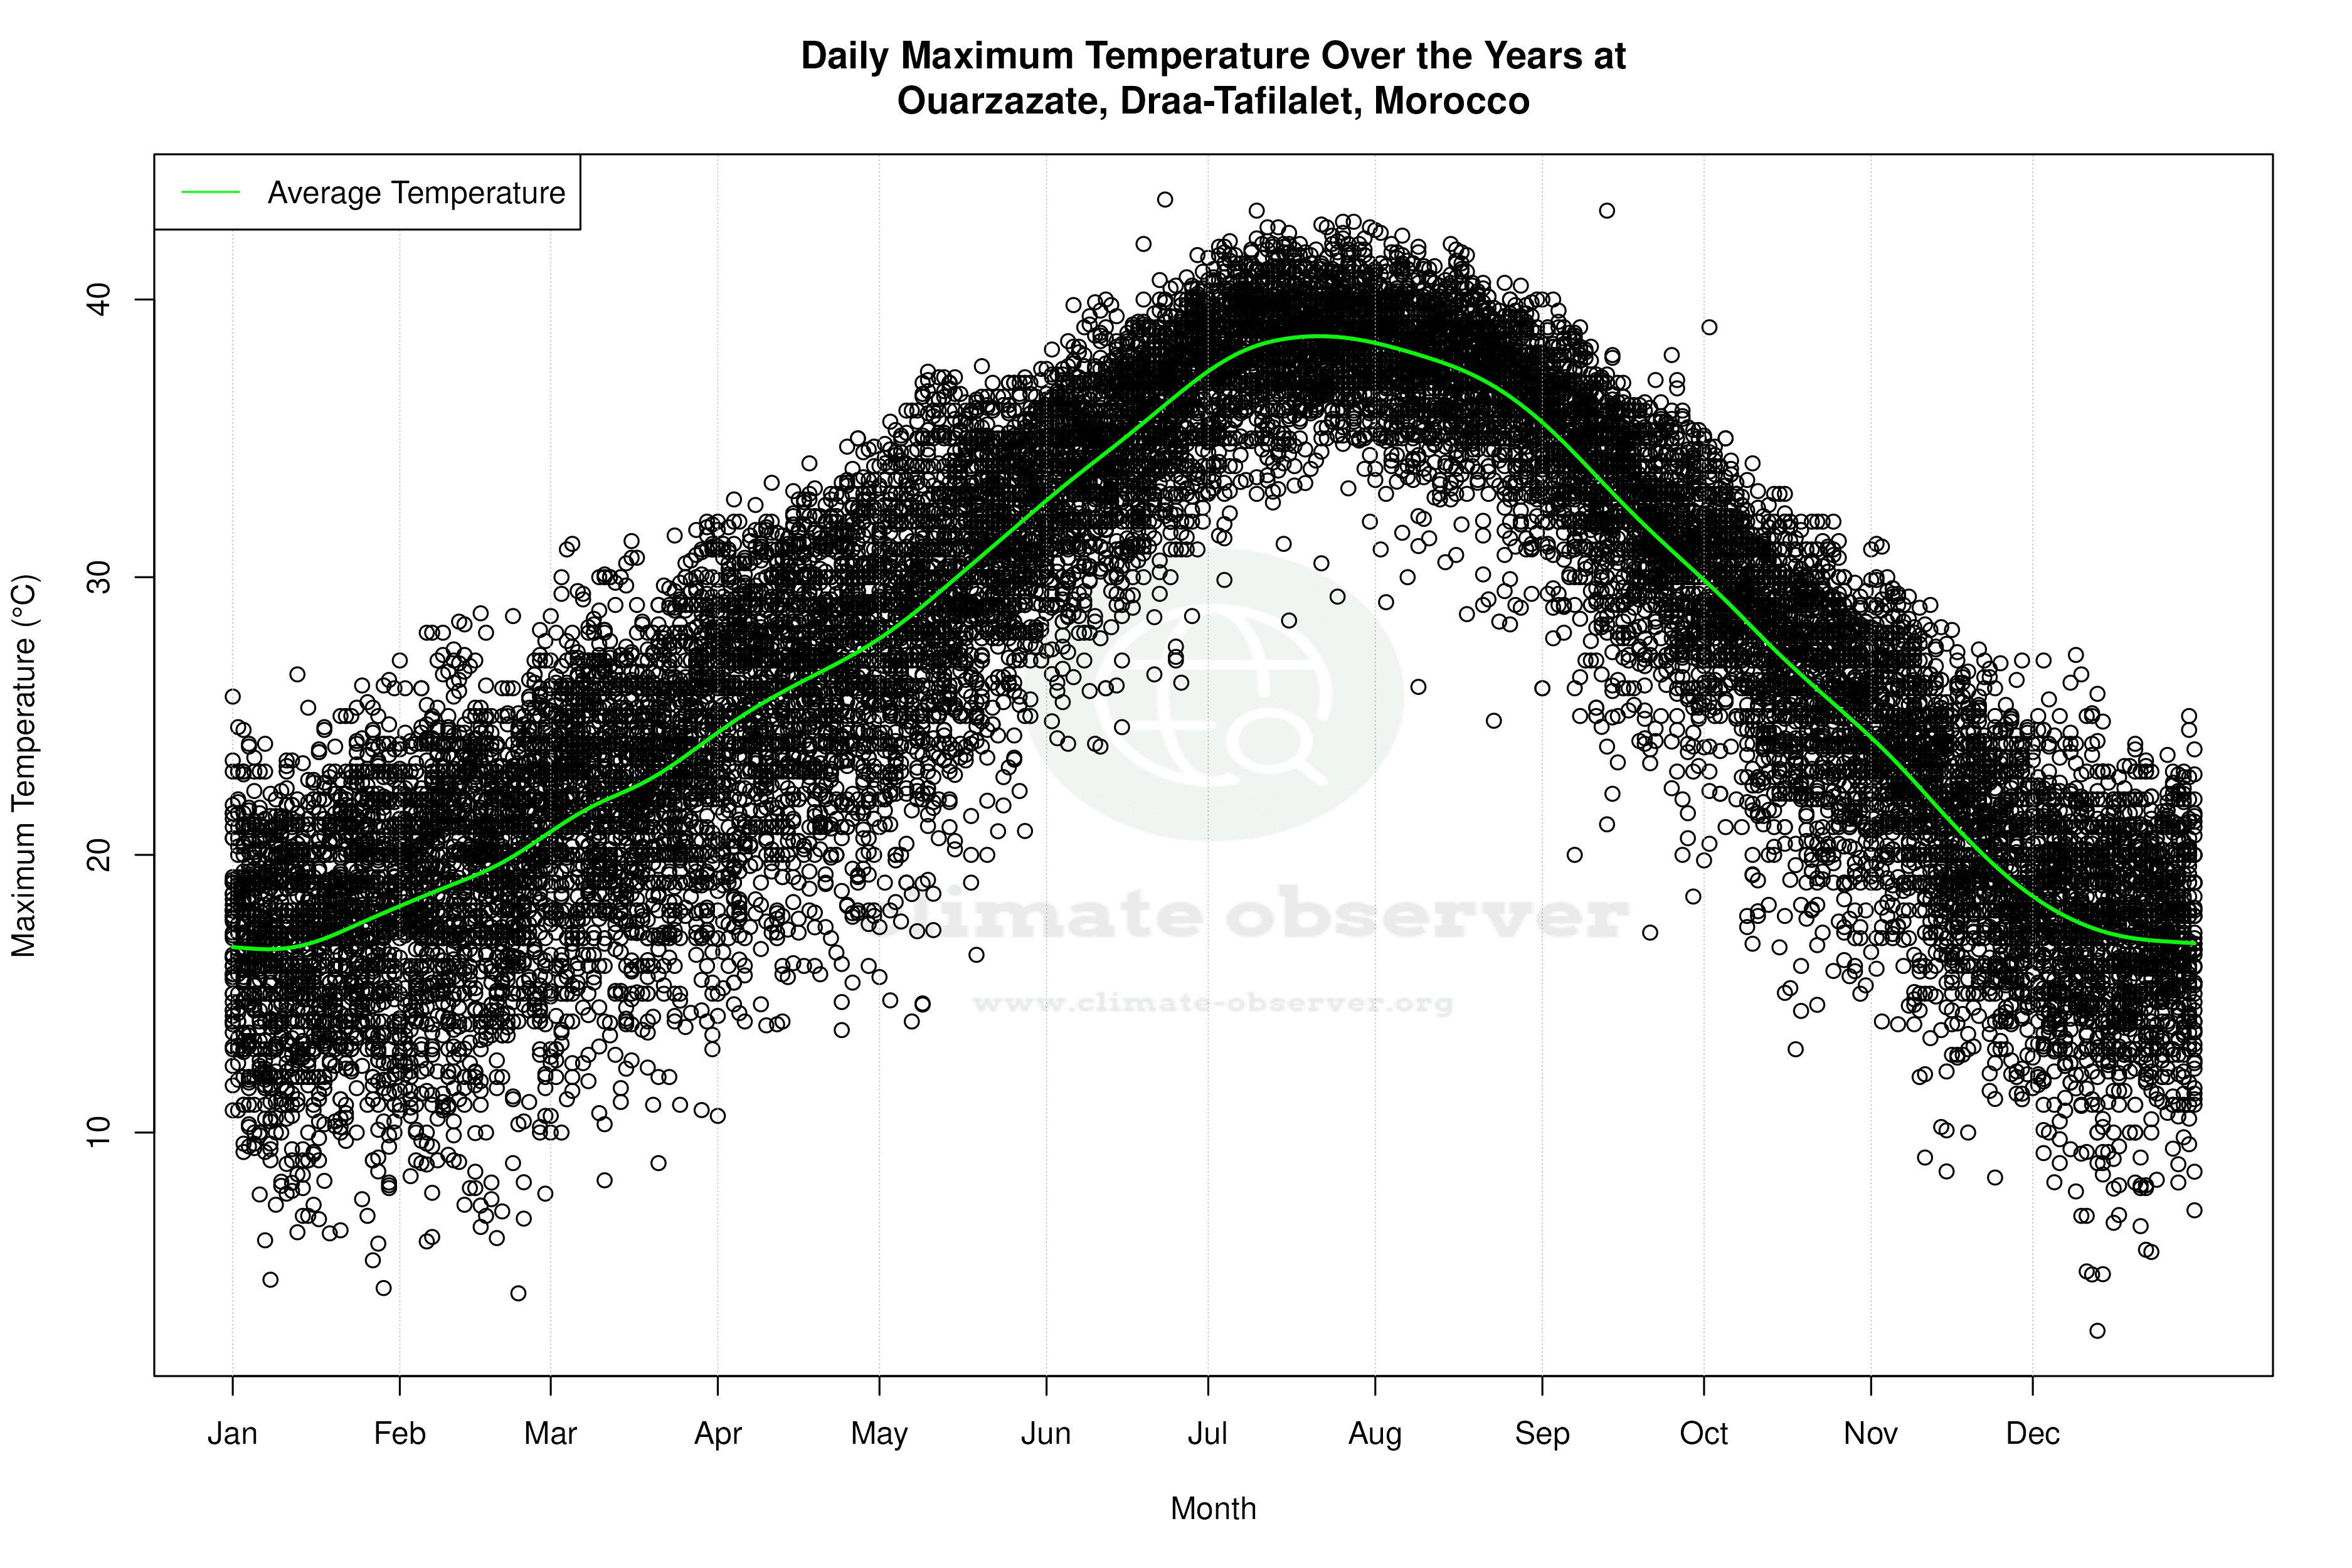
Ouarzazate's climate is marked by extreme temperatures, with historical records showing a maximum of 43.6°C (110.5°F) and a minimum of -7.0°C (19.4°F). These extremes highlight the city's vulnerability to both scorching heat and unexpected cold snaps, necessitating adaptive measures for both residents and the local economy.
Regional Implications and Climate Goals
As Morocco strives to meet its climate goals, including reducing greenhouse gas emissions and enhancing resilience to climate impacts, the data from Ouarzazate serves as a crucial indicator of broader regional trends. The warming and intensified precipitation patterns underscore the need for adaptive strategies in water management and urban planning to mitigate the impacts of climate change on this desert city.
Station Statistics
10-Year Trend
High: +1.47 °F/decade
Low: +1.76 °F/decade
Rain: -0.017 in/decade
25-Year Trend
High: +0.95 °F/decade
Low: +0.76 °F/decade
Rain: -0.002 in/decade
50-Year Trend
High: +0.90 °F/decade
Low: +0.58 °F/decade
Rain: +0.001 in/decade
All-Time Trend
High: +0.76 °F/decade
Low: +0.61 °F/decade
Rain: +0.001 in/decade
Percentage Above-Average Days
Last 12 Months: 47.8%
This Year: 24.8%
Precipitation Concentration Index (PCI) ℹ️
Last 12 Months: 17.6
Historical Average: 22.6
Percentile Rank of Last 12 Months ℹ️
High: 77th percentile
Low: 89th percentile
Rain: 25th percentile
Change in Variance ℹ️
High: +4.8%
Low: +12.7%
Intraday: -1.7%
Data Coverage
88.0%
First Year of Data
1965
Station Location
Historical Weather Records
| Max High | Avg High | Min High | Max Avg | Avg Avg | Min Avg | Max Low | Avg Low | Min Low | Max Precipitation | Avg Precipitation | Max Snow | Avg Snow | |
|---|---|---|---|---|---|---|---|---|---|---|---|---|---|
| Record | 110.48 °F | — | 39.58 °F | 98.24 °F | — | 33.44 °F | 89.60 °F | — | 19.40 °F | 1.34 in | — | — | — |
| January | 79.70 °F | 62.70 °F | 39.92 °F | 65.66 °F | 48.72 °F | 33.98 °F | 55.40 °F | 36.01 °F | 19.40 °F | 1.34 in | 0.02 in | — | — |
| February | 83.66 °F | 66.64 °F | 39.58 °F | 69.26 °F | 53.65 °F | 36.86 °F | 56.12 °F | 40.70 °F | 21.20 °F | 1.08 in | 0.02 in | — | — |
| March | 89.60 °F | 72.38 °F | 46.90 °F | 74.12 °F | 59.88 °F | 39.92 °F | 62.60 °F | 46.41 °F | 28.47 °F | 1.23 in | 0.02 in | — | — |
| April | 95.00 °F | 78.92 °F | 51.08 °F | 81.32 °F | 66.16 °F | 45.39 °F | 71.60 °F | 52.25 °F | 31.39 °F | 1.34 in | 0.01 in | — | — |
| May | 99.68 °F | 86.10 °F | 57.20 °F | 91.58 °F | 73.26 °F | 48.78 °F | 77.72 °F | 58.77 °F | 33.80 °F | 0.79 in | 0.01 in | — | — |
| June | 110.48 °F | 95.01 °F | 75.02 °F | 95.54 °F | 81.46 °F | 61.07 °F | 84.02 °F | 66.12 °F | 45.63 °F | 0.44 in | 0.00 in | — | — |
| July | 109.76 °F | 101.17 °F | 83.19 °F | 98.24 °F | 87.78 °F | 72.86 °F | 89.60 °F | 72.23 °F | 53.51 °F | 1.06 in | 0.00 in | — | — |
| August | 108.50 °F | 99.30 °F | 76.69 °F | 97.88 °F | 85.83 °F | 67.33 °F | 86.90 °F | 71.30 °F | 54.32 °F | 0.63 in | 0.01 in | — | — |
| September | 109.76 °F | 90.87 °F | 62.96 °F | 93.20 °F | 77.80 °F | 60.44 °F | 77.90 °F | 64.20 °F | 46.11 °F | 1.28 in | 0.01 in | — | — |
| October | 102.20 °F | 80.79 °F | 55.40 °F | 82.76 °F | 68.35 °F | 48.38 °F | 71.60 °F | 55.56 °F | 37.71 °F | 1.14 in | 0.02 in | — | — |
| November | 88.16 °F | 70.48 °F | 47.08 °F | 74.84 °F | 57.65 °F | 38.84 °F | 62.60 °F | 45.32 °F | 28.40 °F | 0.89 in | 0.02 in | — | — |
| December | 80.96 °F | 63.26 °F | 41.00 °F | 63.14 °F | 49.79 °F | 33.44 °F | 55.40 °F | 37.83 °F | 22.42 °F | 0.93 in | 0.02 in | — | — |
Data Visualisations
Remove WatermarksCurrent Year Climate Trends vs Historical


Max Temperature this Year | 1 of 6
Climate 12-Month Moving Averages


Max Temperature 12-Month MA | 1 of 6
Daily Data Points and Averages Throughout the Year
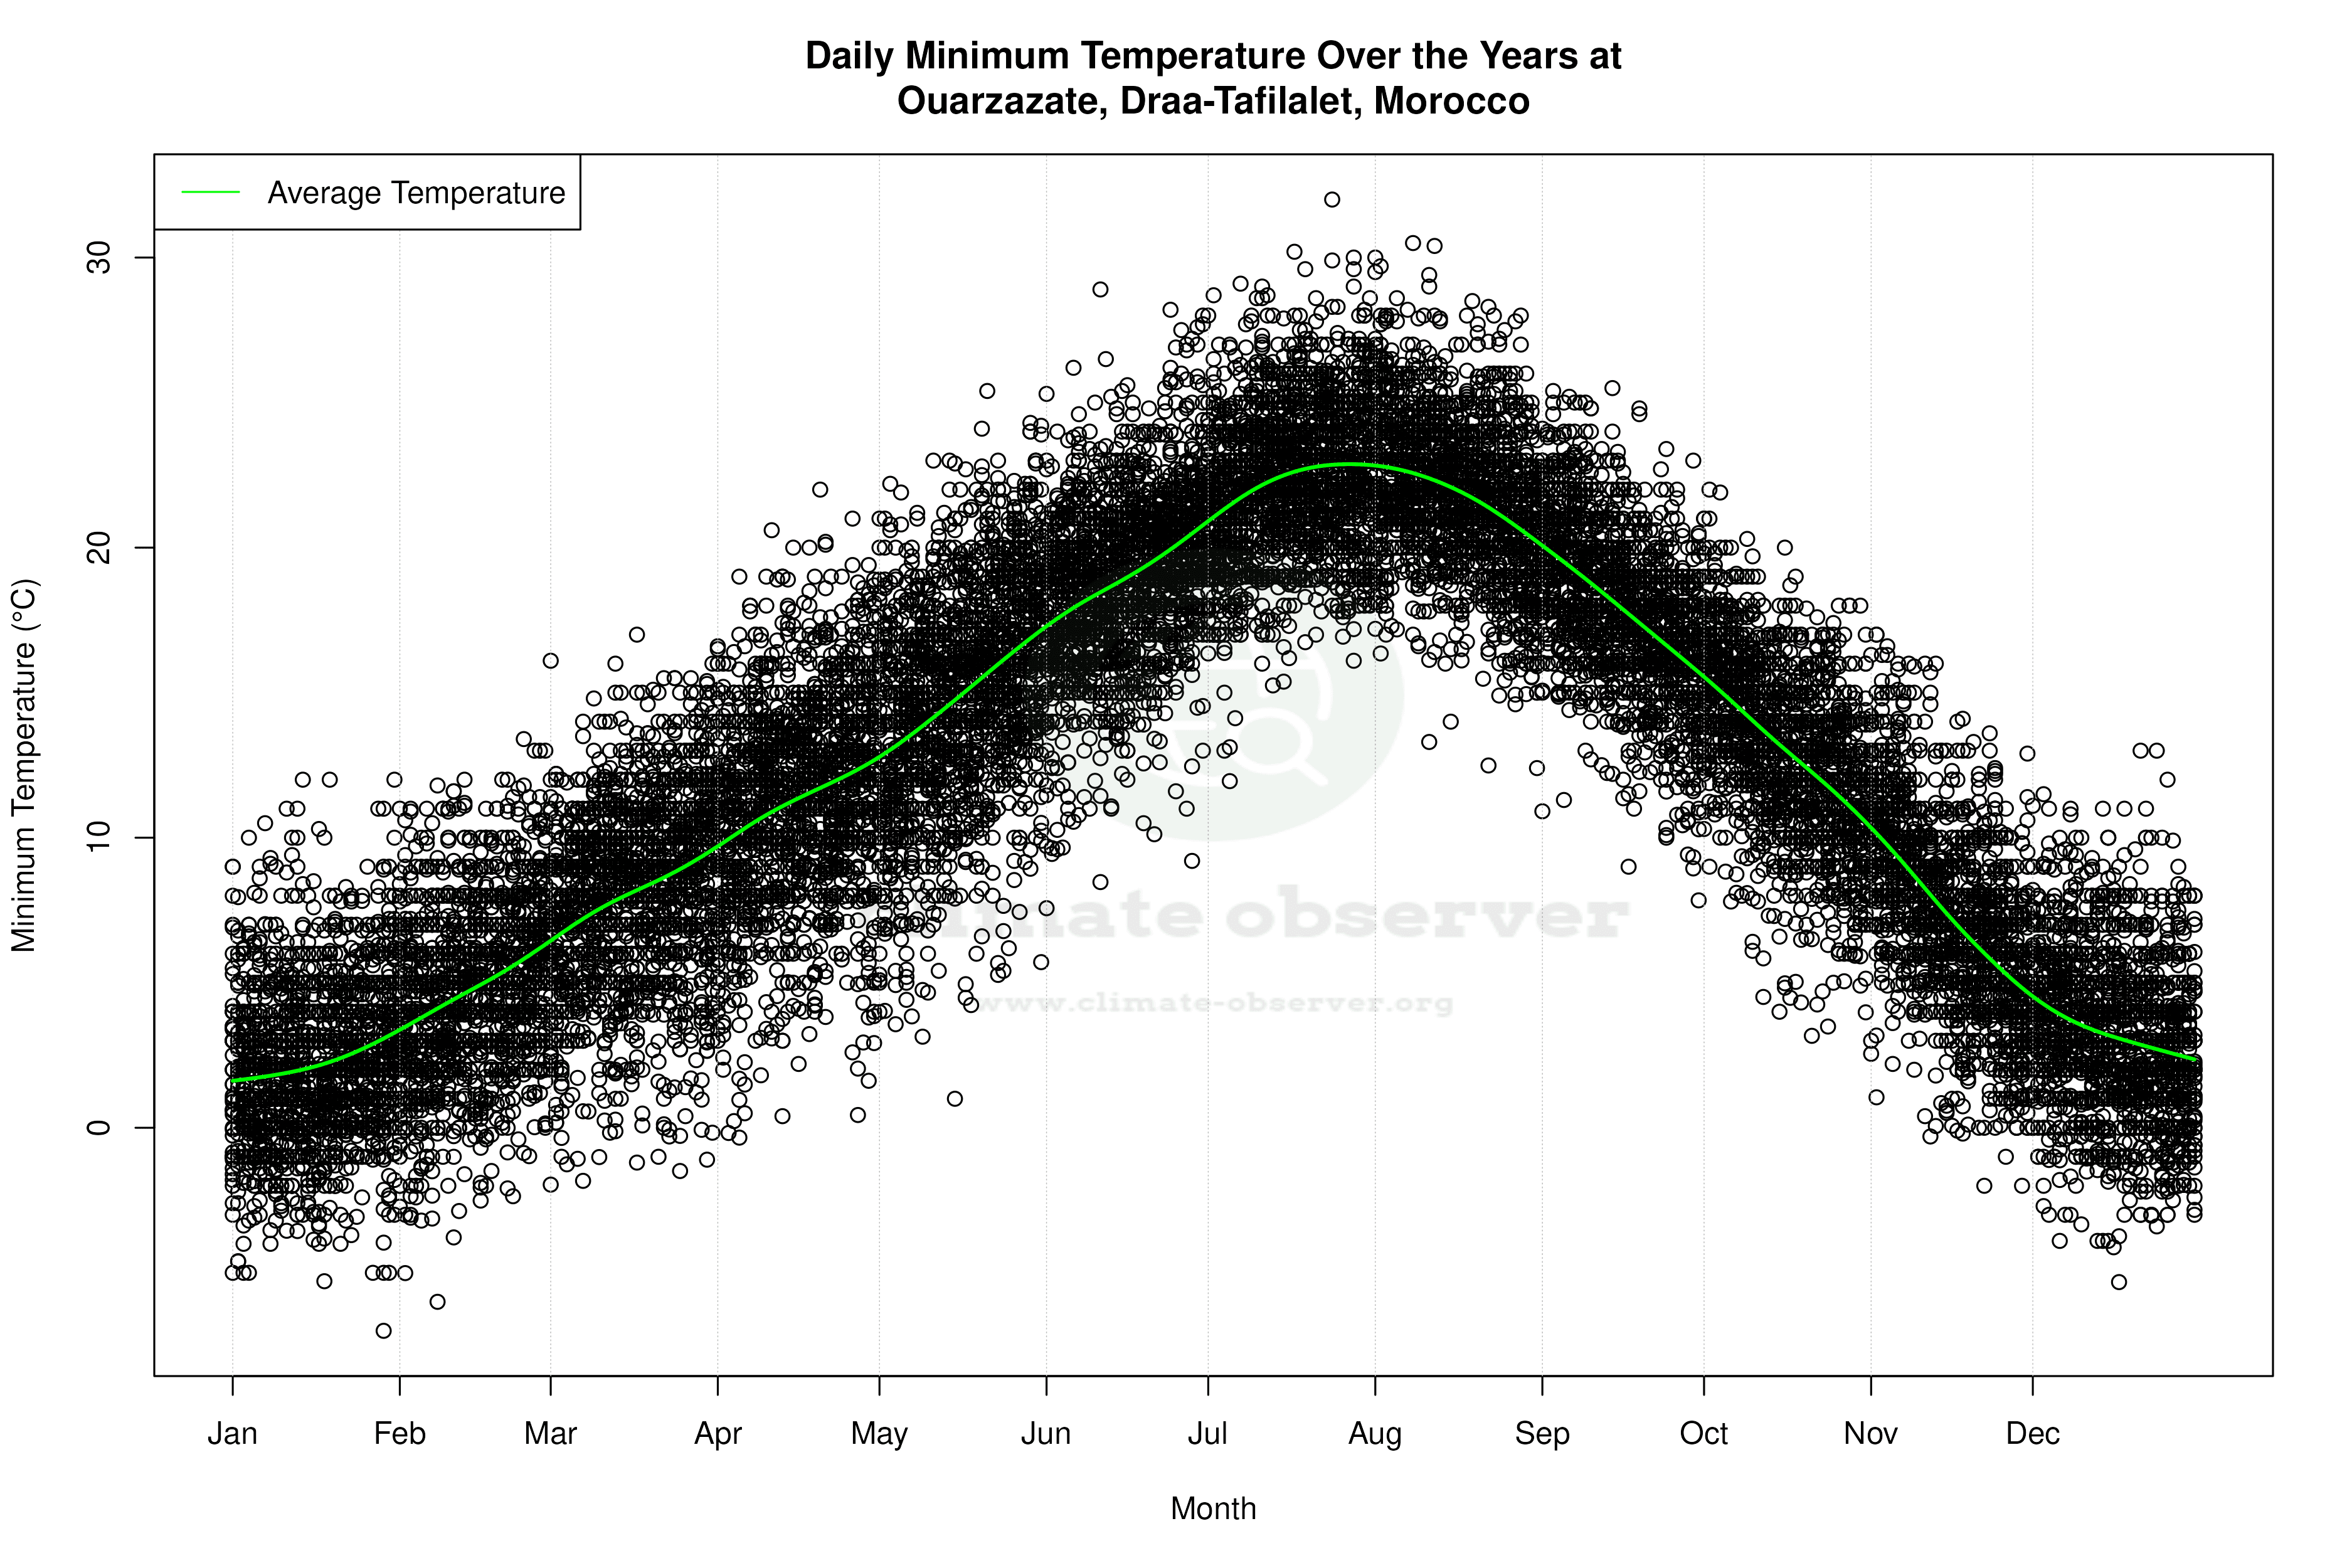
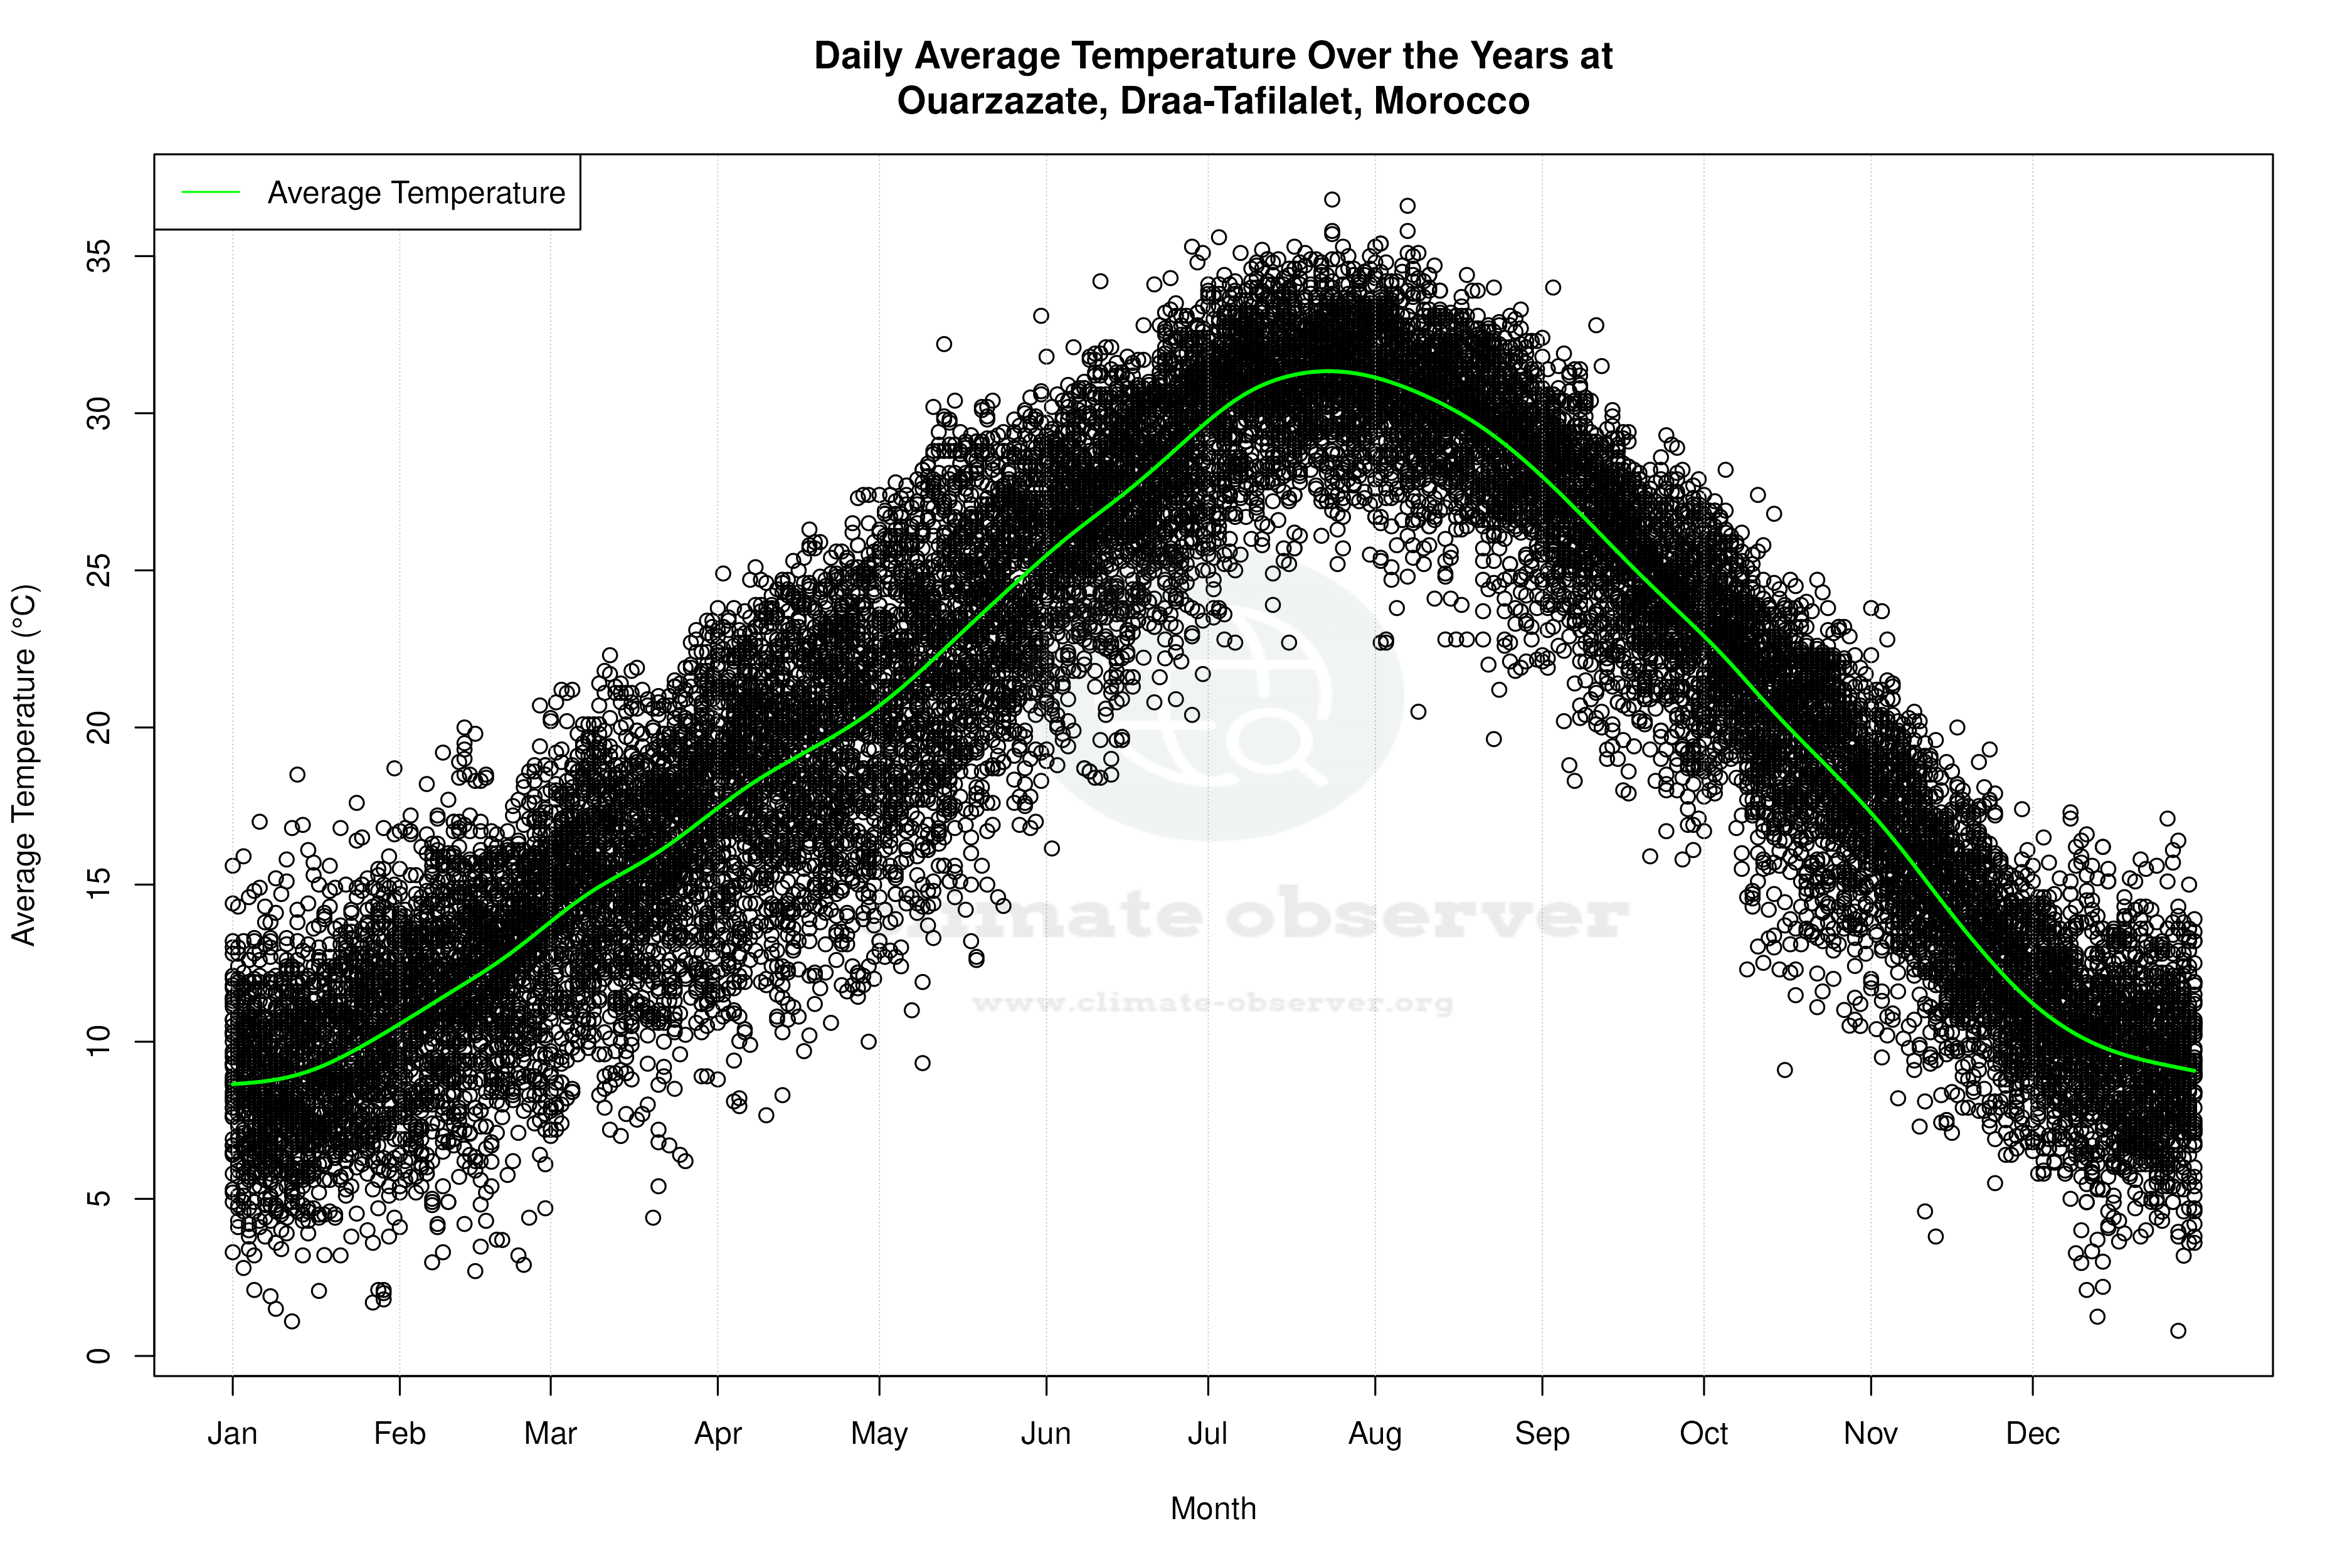

Average Max Temperature Throughout Year | 1 of 5
