Climate for Station: Tangier City, Tanger-Tetouan-Al Hoceima, Morocco
Loading live weather...
Climate Analysis & Overview
Tangier City is experiencing a nuanced climate evolution, with a notable warming trend in low temperatures over the past decade and a more even distribution of precipitation. These shifts reflect both local and broader regional climate dynamics, underscoring the importance of adaptive strategies in Morocco's climate policy.
Mediterranean Climate Under Change
Tangier, located at the northern tip of Morocco, is characterised by a Mediterranean climate, marked by mild, wet winters and hot, dry summers. The city's geographical position, flanked by the Atlantic Ocean and the Mediterranean Sea, plays a crucial role in moderating its climate. Over the past decade, Tangier has experienced a significant warming trend in low temperatures, with an increase of 2.22°C (4.00°F). This is more pronounced than the all-time trend, which shows a smaller rise of 0.20°C (0.36°F). The warming of low temperatures suggests milder nights, potentially affecting local agriculture and ecosystems.
Highs and Lows: Temperature Trends
The city's high temperatures have also risen, albeit more modestly. Over the last ten years, highs have increased by 0.95°C (1.71°F), compared to an all-time rise of 0.24°C (0.43°F). This gradual warming aligns with global climate patterns, where urban areas often experience heat retention due to infrastructure and human activity. The record high of 43.5°C (110.3°F) and a record low of -4.2°C (24.4°F) encapsulate the extremes that Tangier can experience, though such extremes are relatively rare.
Precipitation Patterns: A Shift Towards Evenness
Tangier's Precipitation Concentration Index (PCI) has decreased from a baseline of 18.65 to a current value of 16.30. This change indicates a more even distribution of rainfall events throughout the year, reducing the likelihood of intense, isolated downpours. Such a trend can mitigate flood risks and improve water management strategies, crucial for a city with a growing population and increasing water demands.
Regional Implications and Climate Goals
The observed climate trends in Tangier are consistent with Morocco's broader climate objectives, which focus on resilience and adaptation. The country's commitment to reducing greenhouse gas emissions and enhancing sustainable water management is critical, particularly as local weather patterns become increasingly unpredictable. Recent weather events, such as unexpected heatwaves or prolonged dry spells, highlight the need for robust climate action plans.
Future Considerations for Tangier
As Tangier continues to evolve under the pressures of climate change, understanding these localised trends is vital. The city's unique geographical setting offers both challenges and opportunities in adapting to these shifts. By integrating climate science with policy and community engagement, Tangier can navigate its climatic future effectively, ensuring sustainability and resilience for its inhabitants.
Station Statistics
10-Year Trend
High: +1.46 °F/decade
Low: +4.16 °F/decade
Rain: +0.033 in/decade
25-Year Trend
High: +0.60 °F/decade
Low: +1.46 °F/decade
Rain: +0.001 in/decade
50-Year Trend
High: +0.73 °F/decade
Low: +0.56 °F/decade
Rain: +0.002 in/decade
All-Time Trend
High: +0.44 °F/decade
Low: +0.36 °F/decade
Rain: -0.000 in/decade
Percentage Above-Average Days
Last 12 Months: 44.5%
This Year: 28.9%
Precipitation Concentration Index (PCI) ℹ️
Last 12 Months: 19.2
Historical Average: 19.1
Percentile Rank of Last 12 Months ℹ️
High: 94th percentile
Low: 99th percentile
Rain: 92nd percentile
Change in Variance ℹ️
High: +8.0%
Low: +8.1%
Intraday: -11.9%
Data Coverage
55.5%
First Year of Data
1912
Station Location
Historical Weather Records
| Max High | Avg High | Min High | Max Avg | Avg Avg | Min Avg | Max Low | Avg Low | Min Low | Max Precipitation | Avg Precipitation | Max Snow | Avg Snow | |
|---|---|---|---|---|---|---|---|---|---|---|---|---|---|
| Record | 110.30 °F | — | 44.60 °F | 93.74 °F | — | 37.04 °F | 84.20 °F | — | 24.44 °F | 5.51 in | — | — | — |
| January | 79.52 °F | 61.53 °F | 44.60 °F | 66.74 °F | 54.36 °F | 37.04 °F | 62.60 °F | 47.88 °F | 24.44 °F | 3.11 in | 0.12 in | — | — |
| February | 81.50 °F | 62.70 °F | 46.40 °F | 66.38 °F | 55.61 °F | 40.64 °F | 64.40 °F | 48.95 °F | 30.02 °F | 3.35 in | 0.11 in | — | — |
| March | 84.20 °F | 64.98 °F | 50.00 °F | 69.26 °F | 57.85 °F | 44.60 °F | 62.60 °F | 50.87 °F | 31.82 °F | 2.92 in | 0.11 in | — | — |
| April | 91.04 °F | 67.72 °F | 53.60 °F | 75.38 °F | 60.53 °F | 49.82 °F | 65.48 °F | 53.01 °F | 33.80 °F | 1.81 in | 0.07 in | — | — |
| May | 97.70 °F | 72.95 °F | 59.00 °F | 82.22 °F | 65.17 °F | 53.24 °F | 73.22 °F | 57.12 °F | 32.00 °F | 1.54 in | 0.04 in | — | — |
| June | 103.28 °F | 78.61 °F | 63.93 °F | 91.22 °F | 70.79 °F | 59.54 °F | 79.70 °F | 62.57 °F | 45.86 °F | 0.91 in | 0.01 in | — | — |
| July | 109.58 °F | 83.41 °F | 66.20 °F | 93.74 °F | 74.91 °F | 65.66 °F | 81.86 °F | 66.24 °F | 51.80 °F | 1.38 in | 0.00 in | — | — |
| August | 110.30 °F | 84.44 °F | 70.36 °F | 93.38 °F | 75.80 °F | 65.66 °F | 84.20 °F | 67.43 °F | 50.00 °F | 1.51 in | 0.00 in | — | — |
| September | 102.20 °F | 80.77 °F | 62.60 °F | 87.62 °F | 72.80 °F | 60.62 °F | 78.98 °F | 65.30 °F | 50.00 °F | 1.89 in | 0.03 in | — | — |
| October | 97.16 °F | 75.11 °F | 57.20 °F | 79.34 °F | 67.59 °F | 50.72 °F | 74.12 °F | 60.86 °F | 32.00 °F | 5.51 in | 0.10 in | — | — |
| November | 86.36 °F | 67.76 °F | 50.00 °F | 72.50 °F | 60.56 °F | 46.04 °F | 69.80 °F | 54.44 °F | 33.80 °F | 3.78 in | 0.14 in | — | — |
| December | 84.20 °F | 63.30 °F | 46.04 °F | 68.90 °F | 56.39 °F | 41.18 °F | 65.30 °F | 50.45 °F | 32.00 °F | 2.52 in | 0.16 in | — | — |
Data Visualisations
Remove WatermarksCurrent Year Climate Trends vs Historical


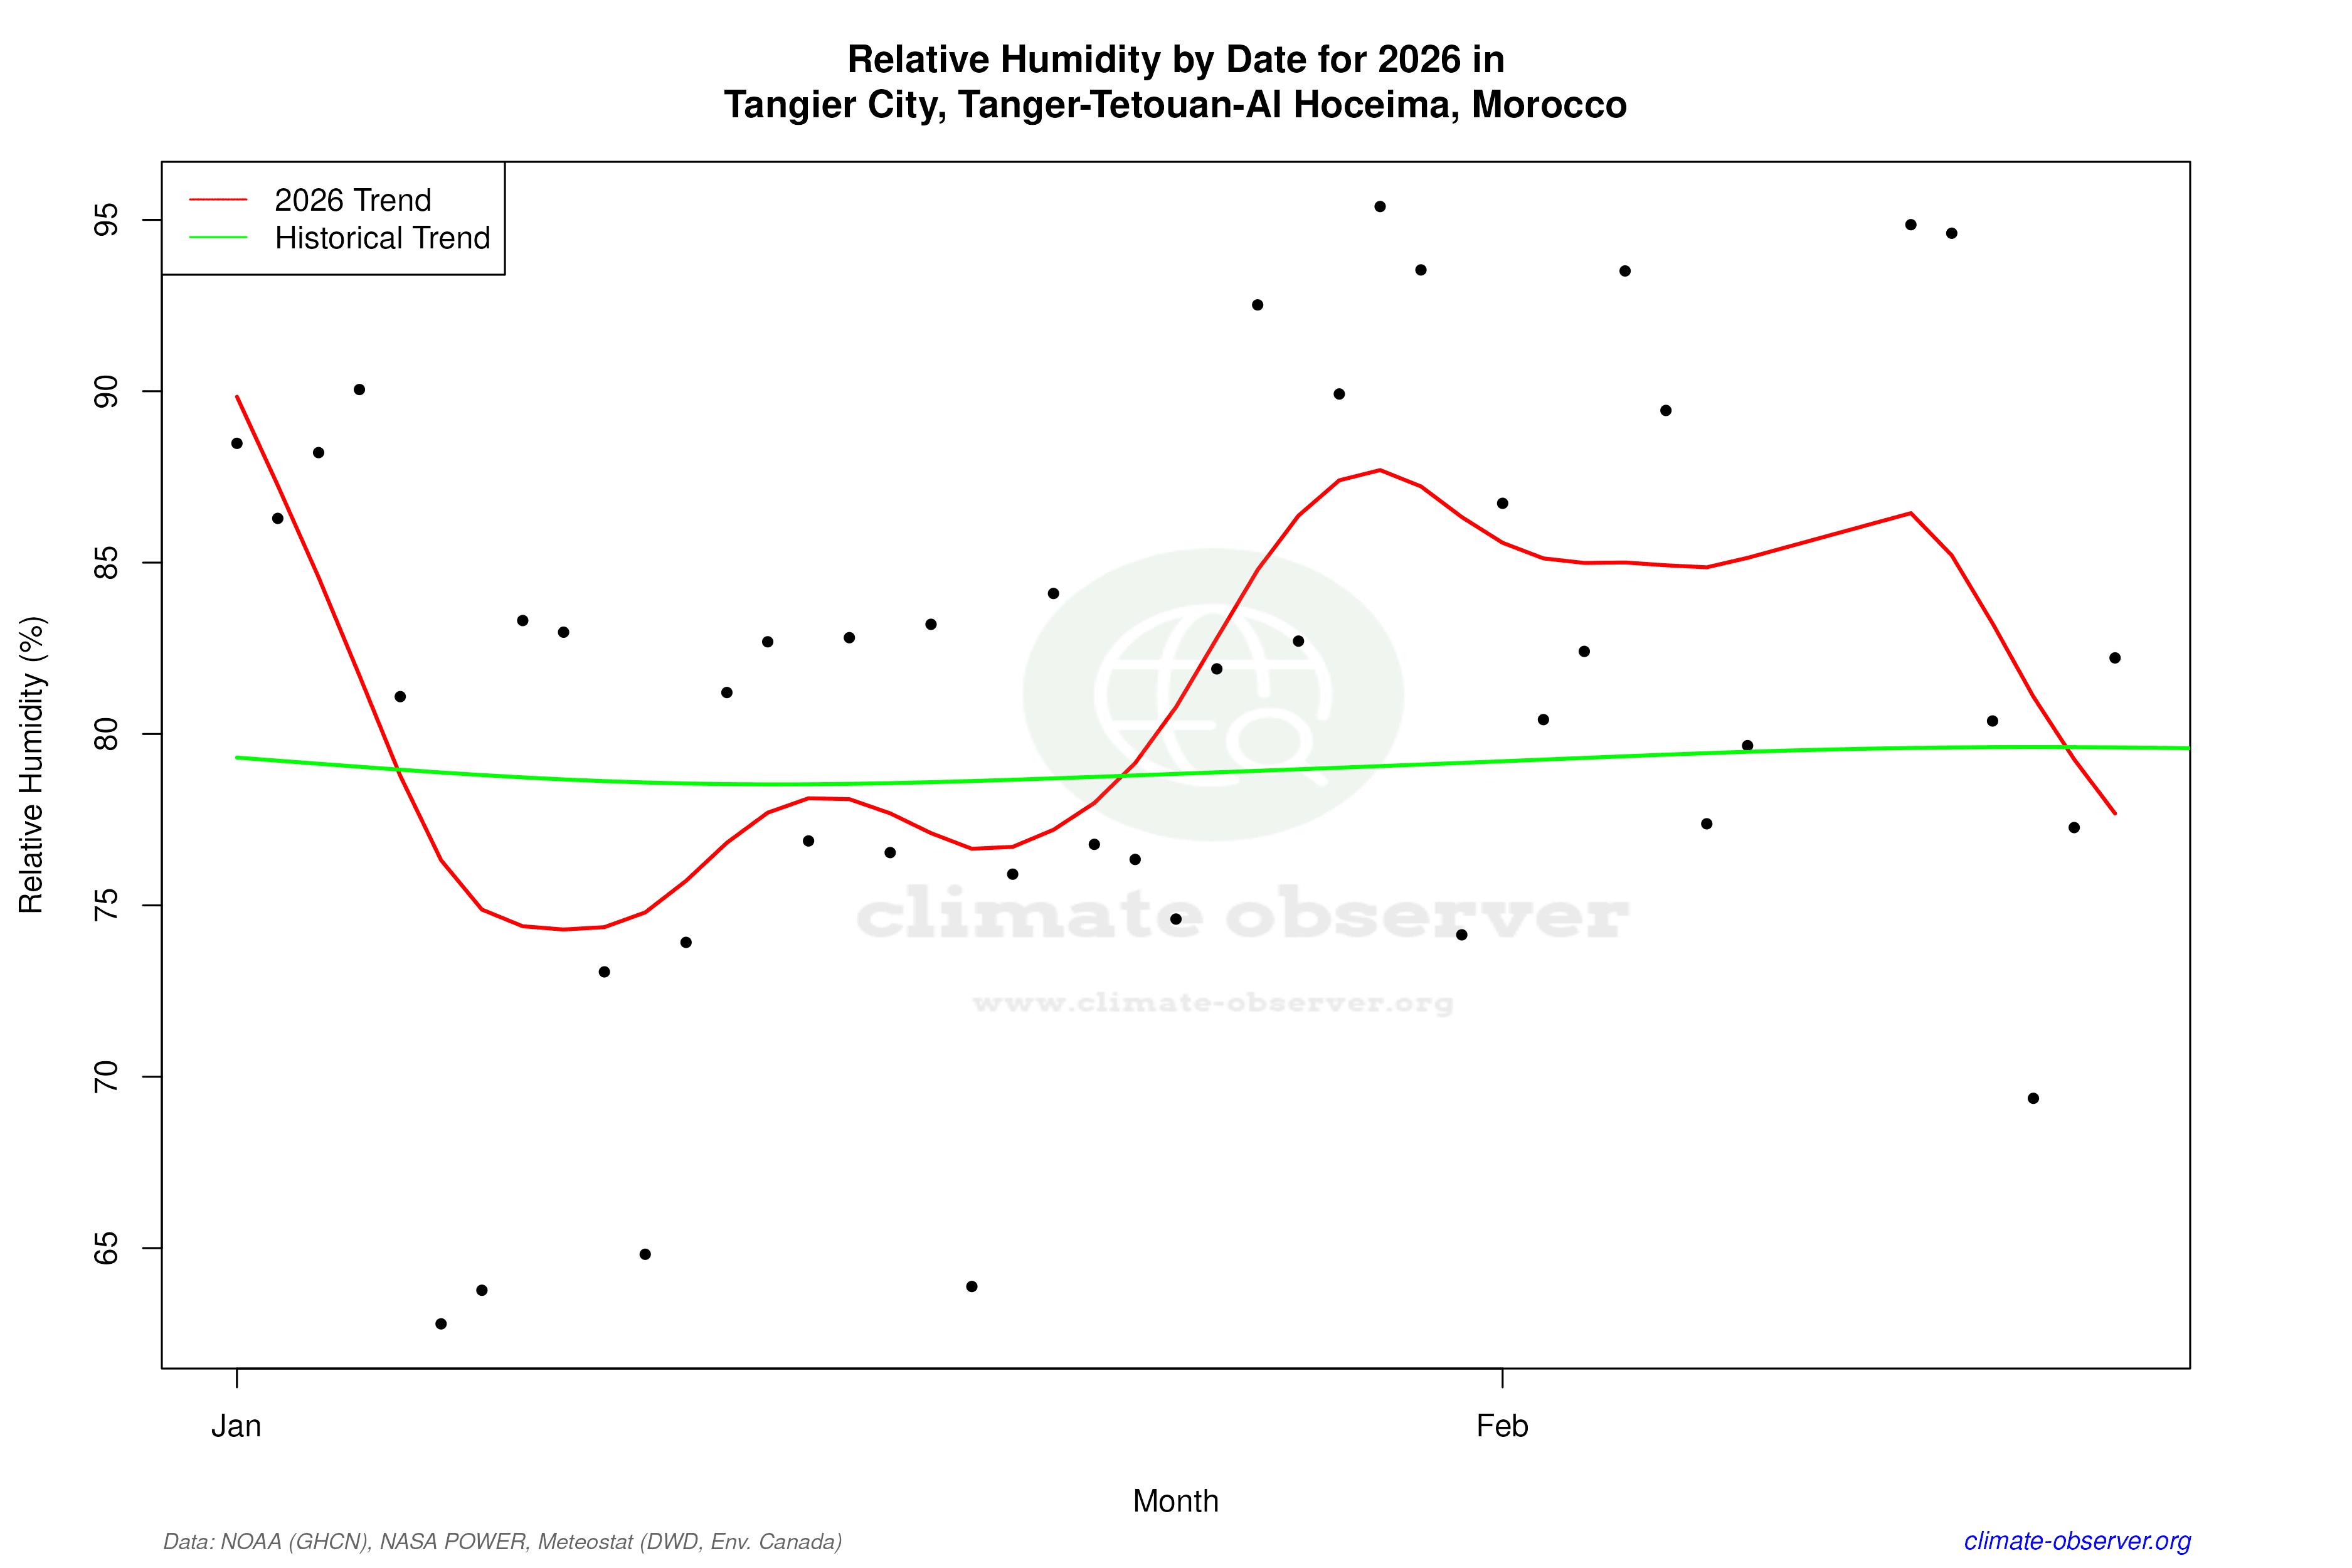

Max Temperature this Year | 1 of 6
Climate 12-Month Moving Averages


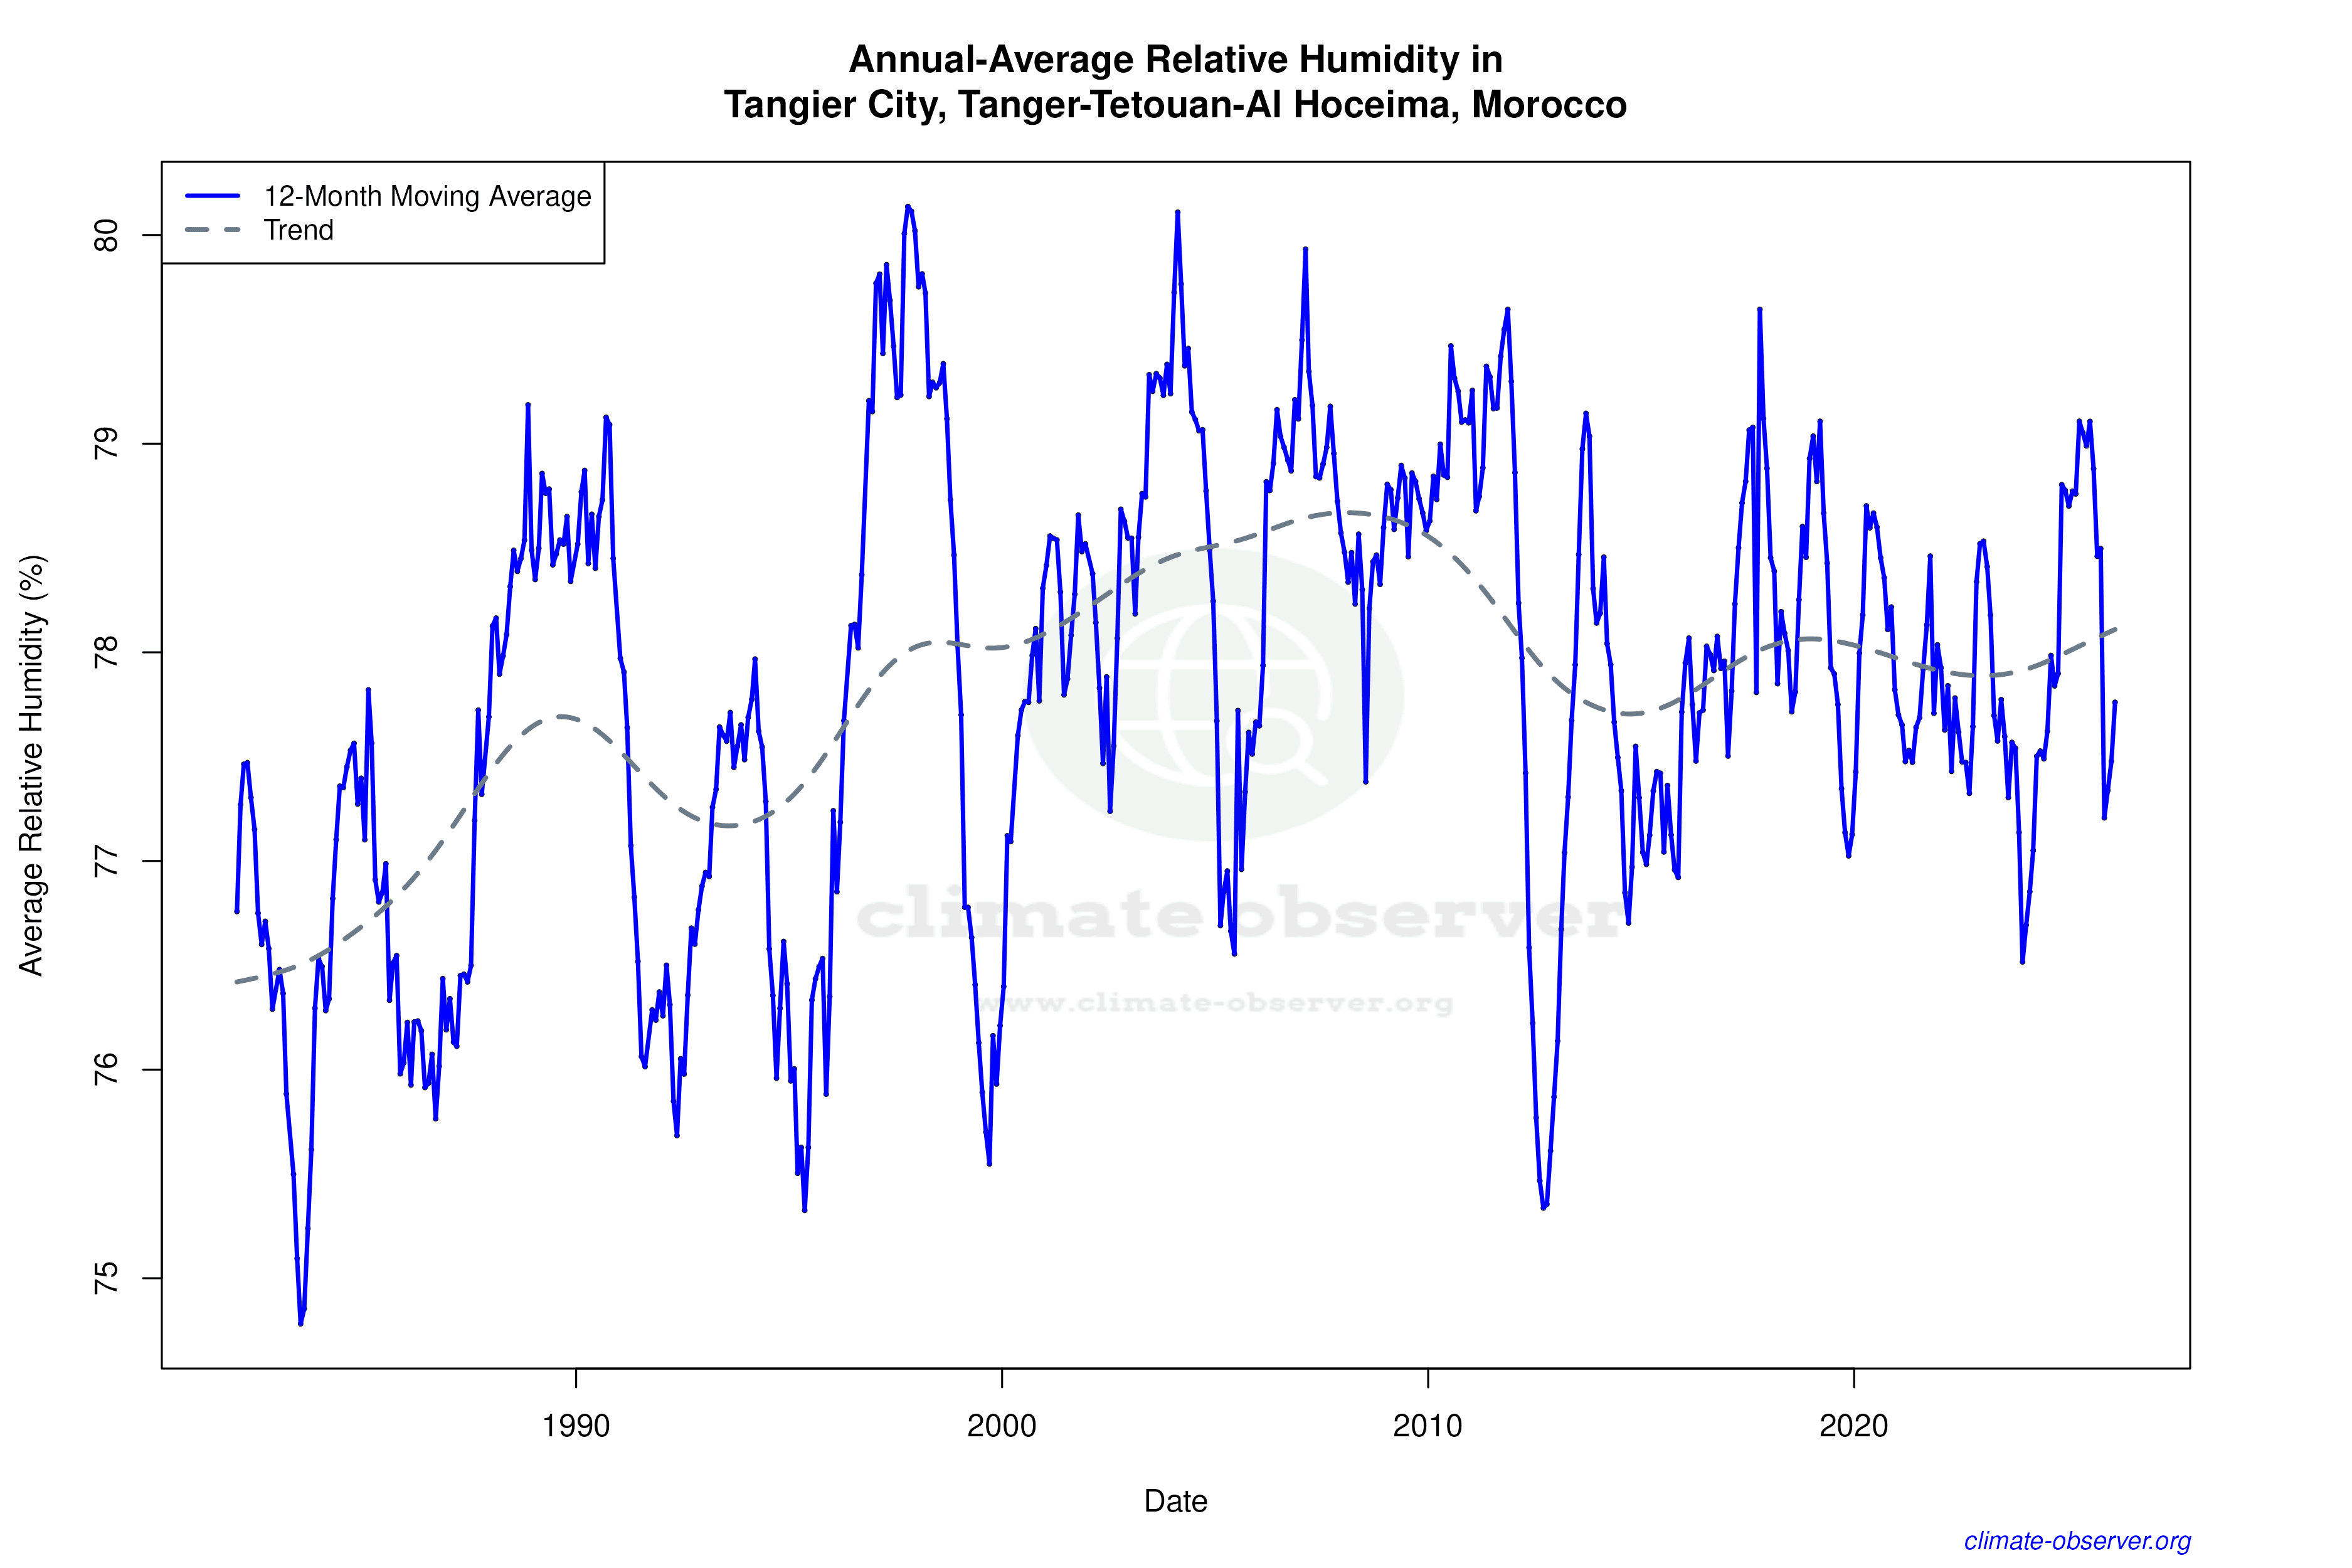

Max Temperature 12-Month MA | 1 of 6
Daily Data Points and Averages Throughout the Year


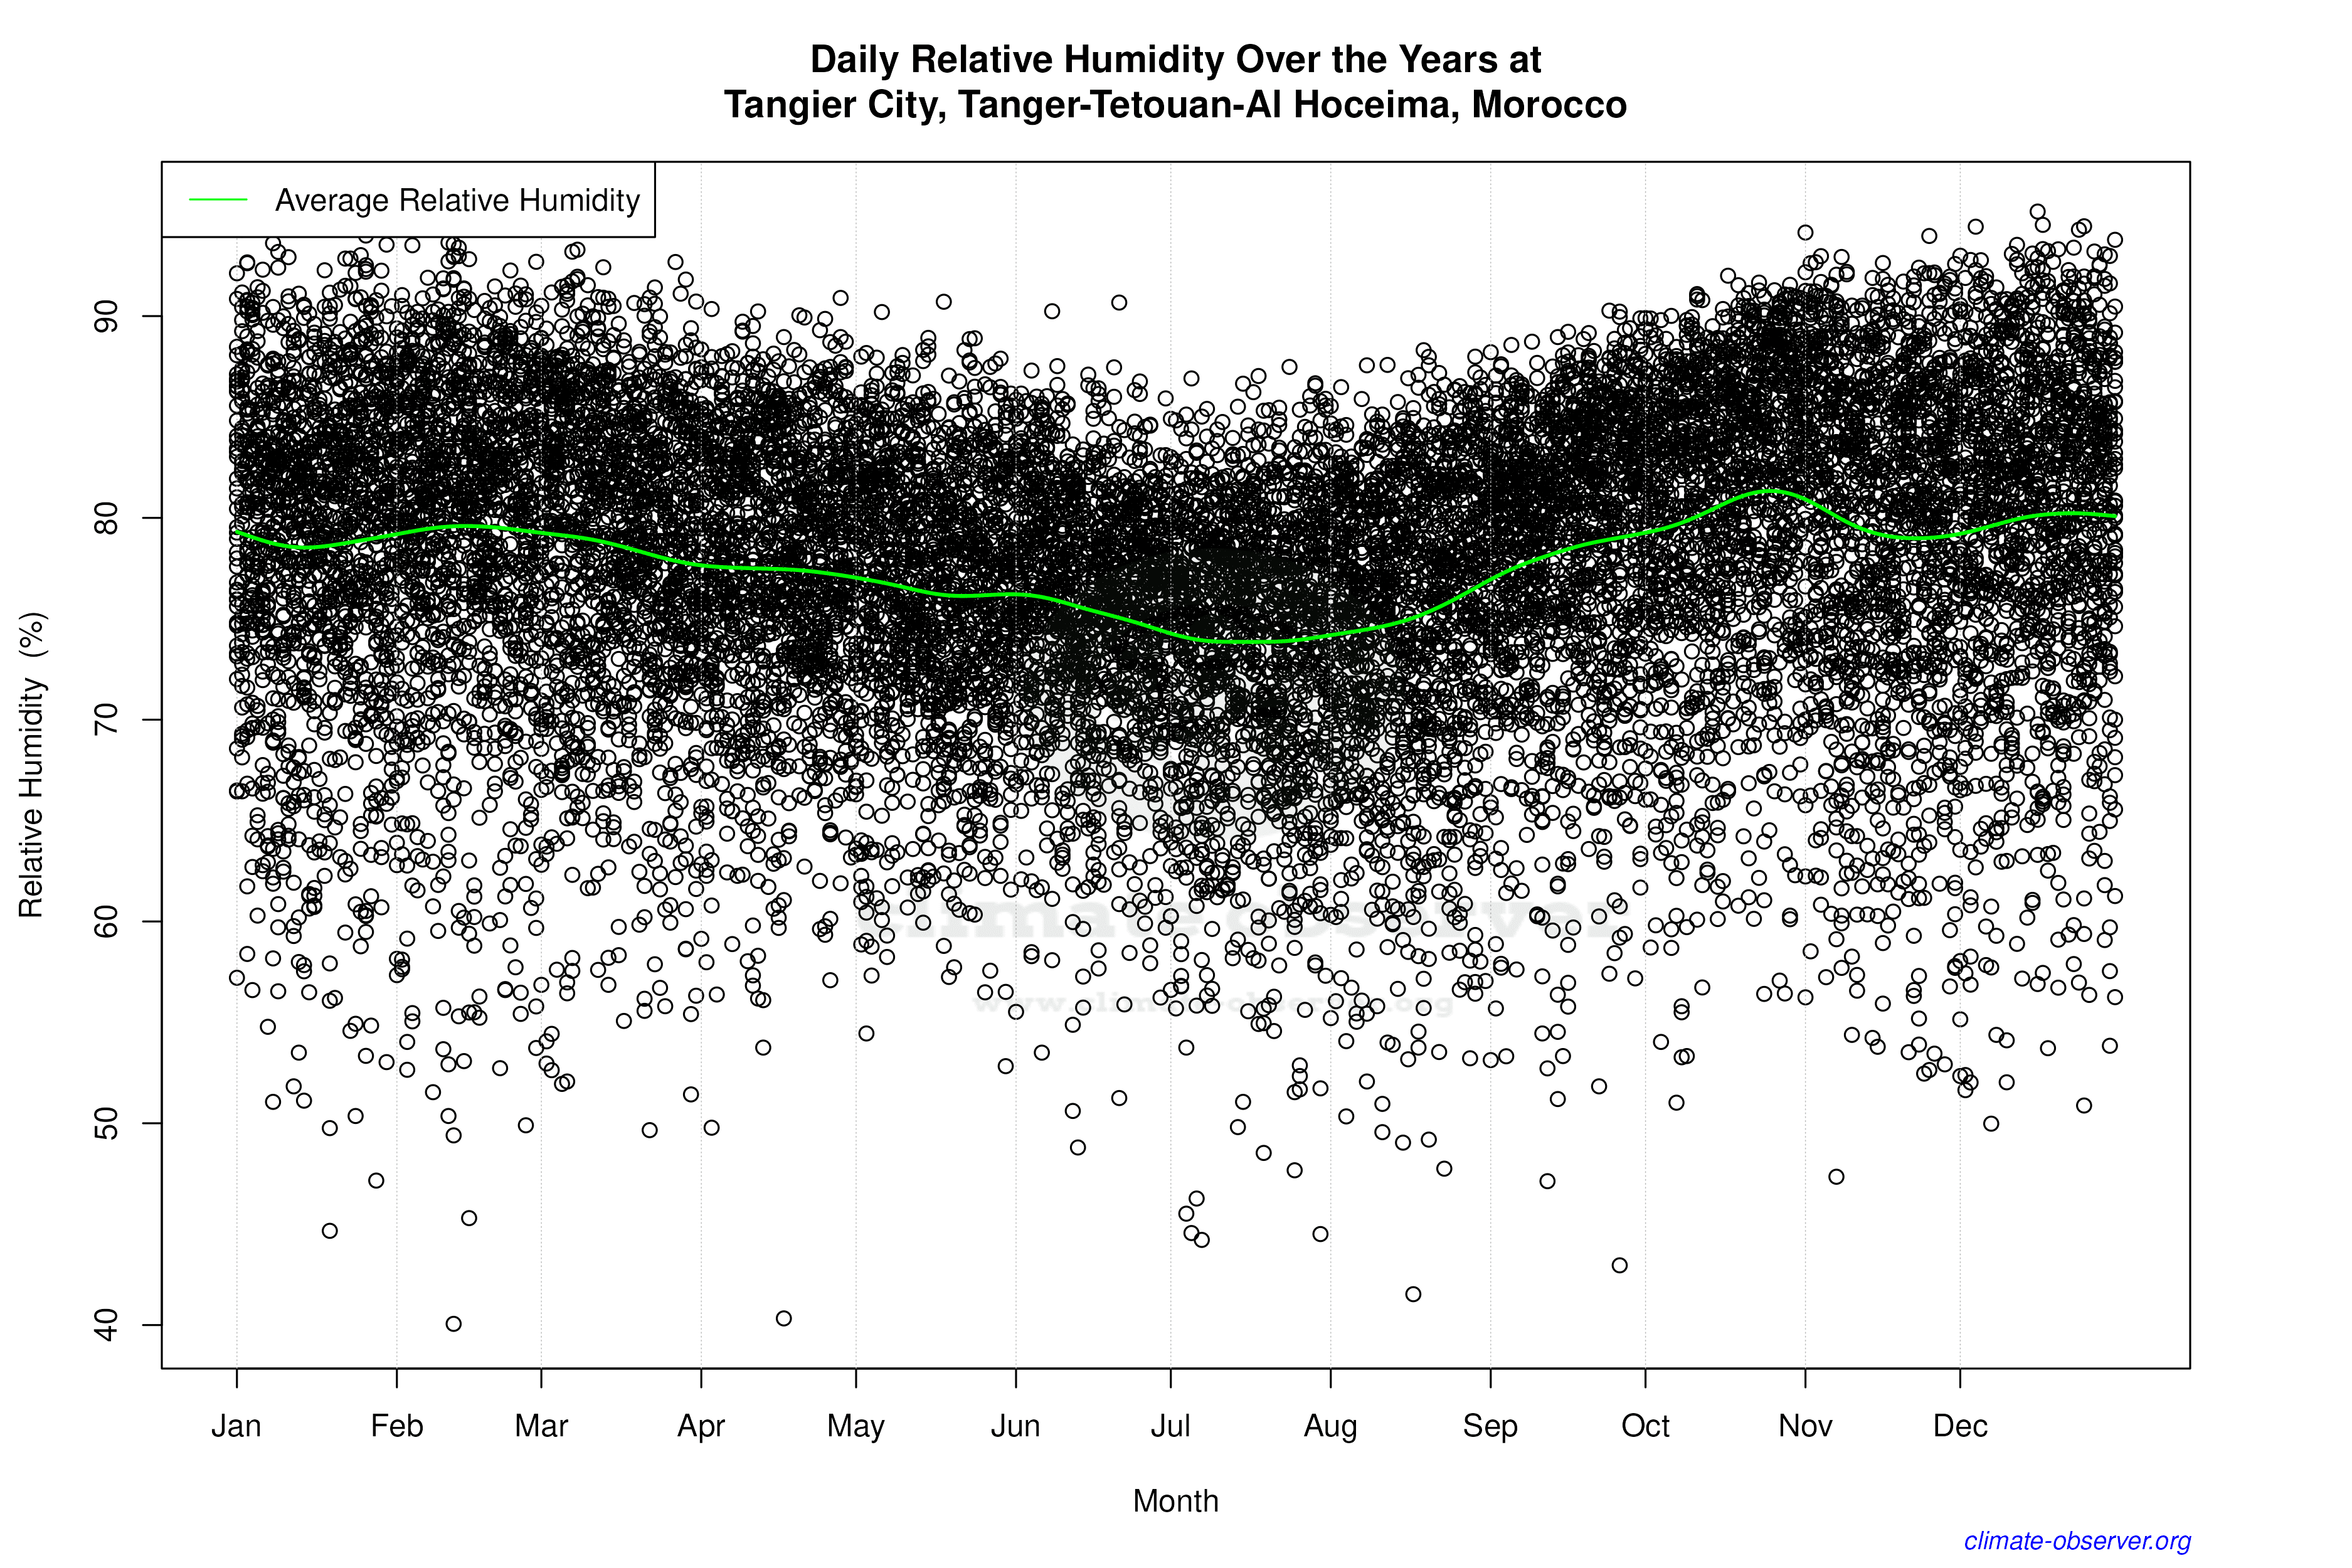

Average Max Temperature Throughout Year | 1 of 5
