Climate for Station: Bassatine, Fes-Meknes, Morocco
Loading live weather...
Climate Analysis & Overview
Bassatine, situated in Morocco's Fès-Meknès region, is experiencing a nuanced climate evolution. While the all-time temperature trends signal a modest warming, recent 10-year data reveals a more complex picture with warming highs but cooling lows. Precipitation patterns have become slightly more even, reflecting a subtle shift in rainfall distribution.
Köppen Climate and Geographic Influences
Bassatine is classified under the Köppen climate system as a Mediterranean climate (Csa), characterised by hot, dry summers and mild, wet winters. Its location near the Atlas Mountains influences local weather patterns, creating a rain shadow effect that can lead to varied precipitation levels. This geography plays a vital role in shaping the area's climate data, especially in terms of temperature and precipitation distribution.
Temperature Trends: A Tale of Two Scales
The long-term temperature trends for Bassatine indicate a warming pattern, with all-time highs rising by 0.39°C (0.70°F). This suggests a gradual increase in maximum temperatures over the years. However, the all-time lows have only increased by 0.10°C (0.18°F), indicating a relatively stable minimum temperature range. In contrast, the 10-year trends show a more dynamic shift: highs have risen by 0.71°C (1.28°F), while lows have decreased by 0.63°C (1.13°F). This divergence suggests a recent pattern of warmer days but cooler nights, adding complexity to the overall warming narrative.
Precipitation Patterns: Subtle Shifts
The Precipitation Concentration Index (PCI) for Bassatine has decreased slightly from a baseline of 17.56 to a current value of 16.69. This marginal change indicates that precipitation is becoming more evenly distributed throughout the year, rather than being concentrated in fewer, intense events. Such a shift may have implications for agriculture and water management in the region, aligning with Morocco's broader climate resilience goals.
Temperature Extremes: Record Highs and Lows
Bassatine's historical temperature records reveal significant extremes, with a maximum temperature reaching 47.0°C (116.6°F) and a minimum plunging to -6.0°C (21.2°F). These records underscore the region's potential for significant temperature variability, which can impact both natural ecosystems and human activities.
Regional Climate Context and Implications
In the context of Morocco's regional climate objectives, which focus on adaptation and sustainability, the observed trends in Bassatine offer valuable insights. The warming highs and cooling lows over the past decade may necessitate adaptive measures in agriculture and urban planning to mitigate potential impacts. Additionally, the slight shift towards more evenly distributed precipitation could influence water resource strategies, supporting efforts to enhance climate resilience across the region.
Station Statistics
10-Year Trend
High: +0.67 °F/decade
Low: -1.24 °F/decade
Rain: -0.013 in/decade
25-Year Trend
High: +0.99 °F/decade
Low: +0.04 °F/decade
Rain: -0.004 in/decade
50-Year Trend
High: +0.65 °F/decade
Low: +0.05 °F/decade
Rain: +0.001 in/decade
All-Time Trend
High: +0.72 °F/decade
Low: +0.17 °F/decade
Rain: +0.000 in/decade
Percentage Above-Average Days
Last 12 Months: 53.3%
This Year: 52.3%
Precipitation Concentration Index (PCI) ℹ️
Last 12 Months: 19.9
Historical Average: 17.4
Percentile Rank of Last 12 Months ℹ️
High: 75th percentile
Low: 49th percentile
Rain: 72nd percentile
Change in Variance ℹ️
High: +7.0%
Low: +7.7%
Intraday: +4.4%
Data Coverage
82.1%
First Year of Data
1957
Station Location
Historical Weather Records
| Max High | Avg High | Min High | Max Avg | Avg Avg | Min Avg | Max Low | Avg Low | Min Low | Max Precipitation | Avg Precipitation | Max Snow | Avg Snow | |
|---|---|---|---|---|---|---|---|---|---|---|---|---|---|
| Record | 116.60 °F | — | 40.64 °F | 105.98 °F | — | 32.18 °F | 86.72 °F | — | 21.20 °F | 2.36 in | — | — | — |
| January | 80.96 °F | 60.80 °F | 41.00 °F | 65.14 °F | 50.05 °F | 32.18 °F | 59.07 °F | 41.42 °F | 21.20 °F | 2.08 in | 0.09 in | — | — |
| February | 89.96 °F | 63.16 °F | 42.44 °F | 73.76 °F | 52.39 °F | 37.04 °F | 60.98 °F | 43.25 °F | 26.60 °F | 1.57 in | 0.09 in | — | — |
| March | 92.84 °F | 67.28 °F | 40.64 °F | 74.30 °F | 55.93 °F | 38.66 °F | 62.96 °F | 46.05 °F | 31.28 °F | 1.85 in | 0.08 in | — | — |
| April | 100.40 °F | 70.64 °F | 48.02 °F | 84.38 °F | 59.05 °F | 44.06 °F | 70.52 °F | 48.78 °F | 30.02 °F | 2.36 in | 0.07 in | — | — |
| May | 107.06 °F | 78.30 °F | 53.42 °F | 90.50 °F | 65.34 °F | 49.64 °F | 73.22 °F | 53.91 °F | 33.98 °F | 2.09 in | 0.05 in | — | — |
| June | 112.28 °F | 85.80 °F | 60.26 °F | 97.52 °F | 71.69 °F | 50.00 °F | 82.40 °F | 59.44 °F | 42.80 °F | 0.75 in | 0.01 in | — | — |
| July | 116.60 °F | 93.21 °F | 71.60 °F | 98.60 °F | 78.08 °F | 60.62 °F | 86.00 °F | 64.63 °F | 46.40 °F | 0.25 in | 0.00 in | — | — |
| August | 115.90 °F | 93.42 °F | 69.80 °F | 105.98 °F | 78.48 °F | 58.64 °F | 86.72 °F | 65.61 °F | 44.60 °F | 0.53 in | 0.00 in | — | — |
| September | 109.02 °F | 86.33 °F | 62.60 °F | 91.04 °F | 72.94 °F | 57.74 °F | 81.95 °F | 61.80 °F | 41.00 °F | 1.19 in | 0.02 in | — | — |
| October | 98.24 °F | 78.12 °F | 51.80 °F | 88.16 °F | 66.06 °F | 48.56 °F | 73.40 °F | 56.42 °F | 40.10 °F | 1.93 in | 0.06 in | — | — |
| November | 94.59 °F | 68.15 °F | 48.20 °F | 75.02 °F | 57.30 °F | 42.44 °F | 69.08 °F | 48.66 °F | 30.02 °F | 2.21 in | 0.09 in | — | — |
| December | 84.20 °F | 62.37 °F | 42.98 °F | 70.52 °F | 51.88 °F | 35.24 °F | 60.62 °F | 43.78 °F | 30.02 °F | 1.89 in | 0.09 in | — | — |
Data Visualisations
Remove WatermarksCurrent Year Climate Trends vs Historical


Max Temperature this Year | 1 of 6
Climate 12-Month Moving Averages
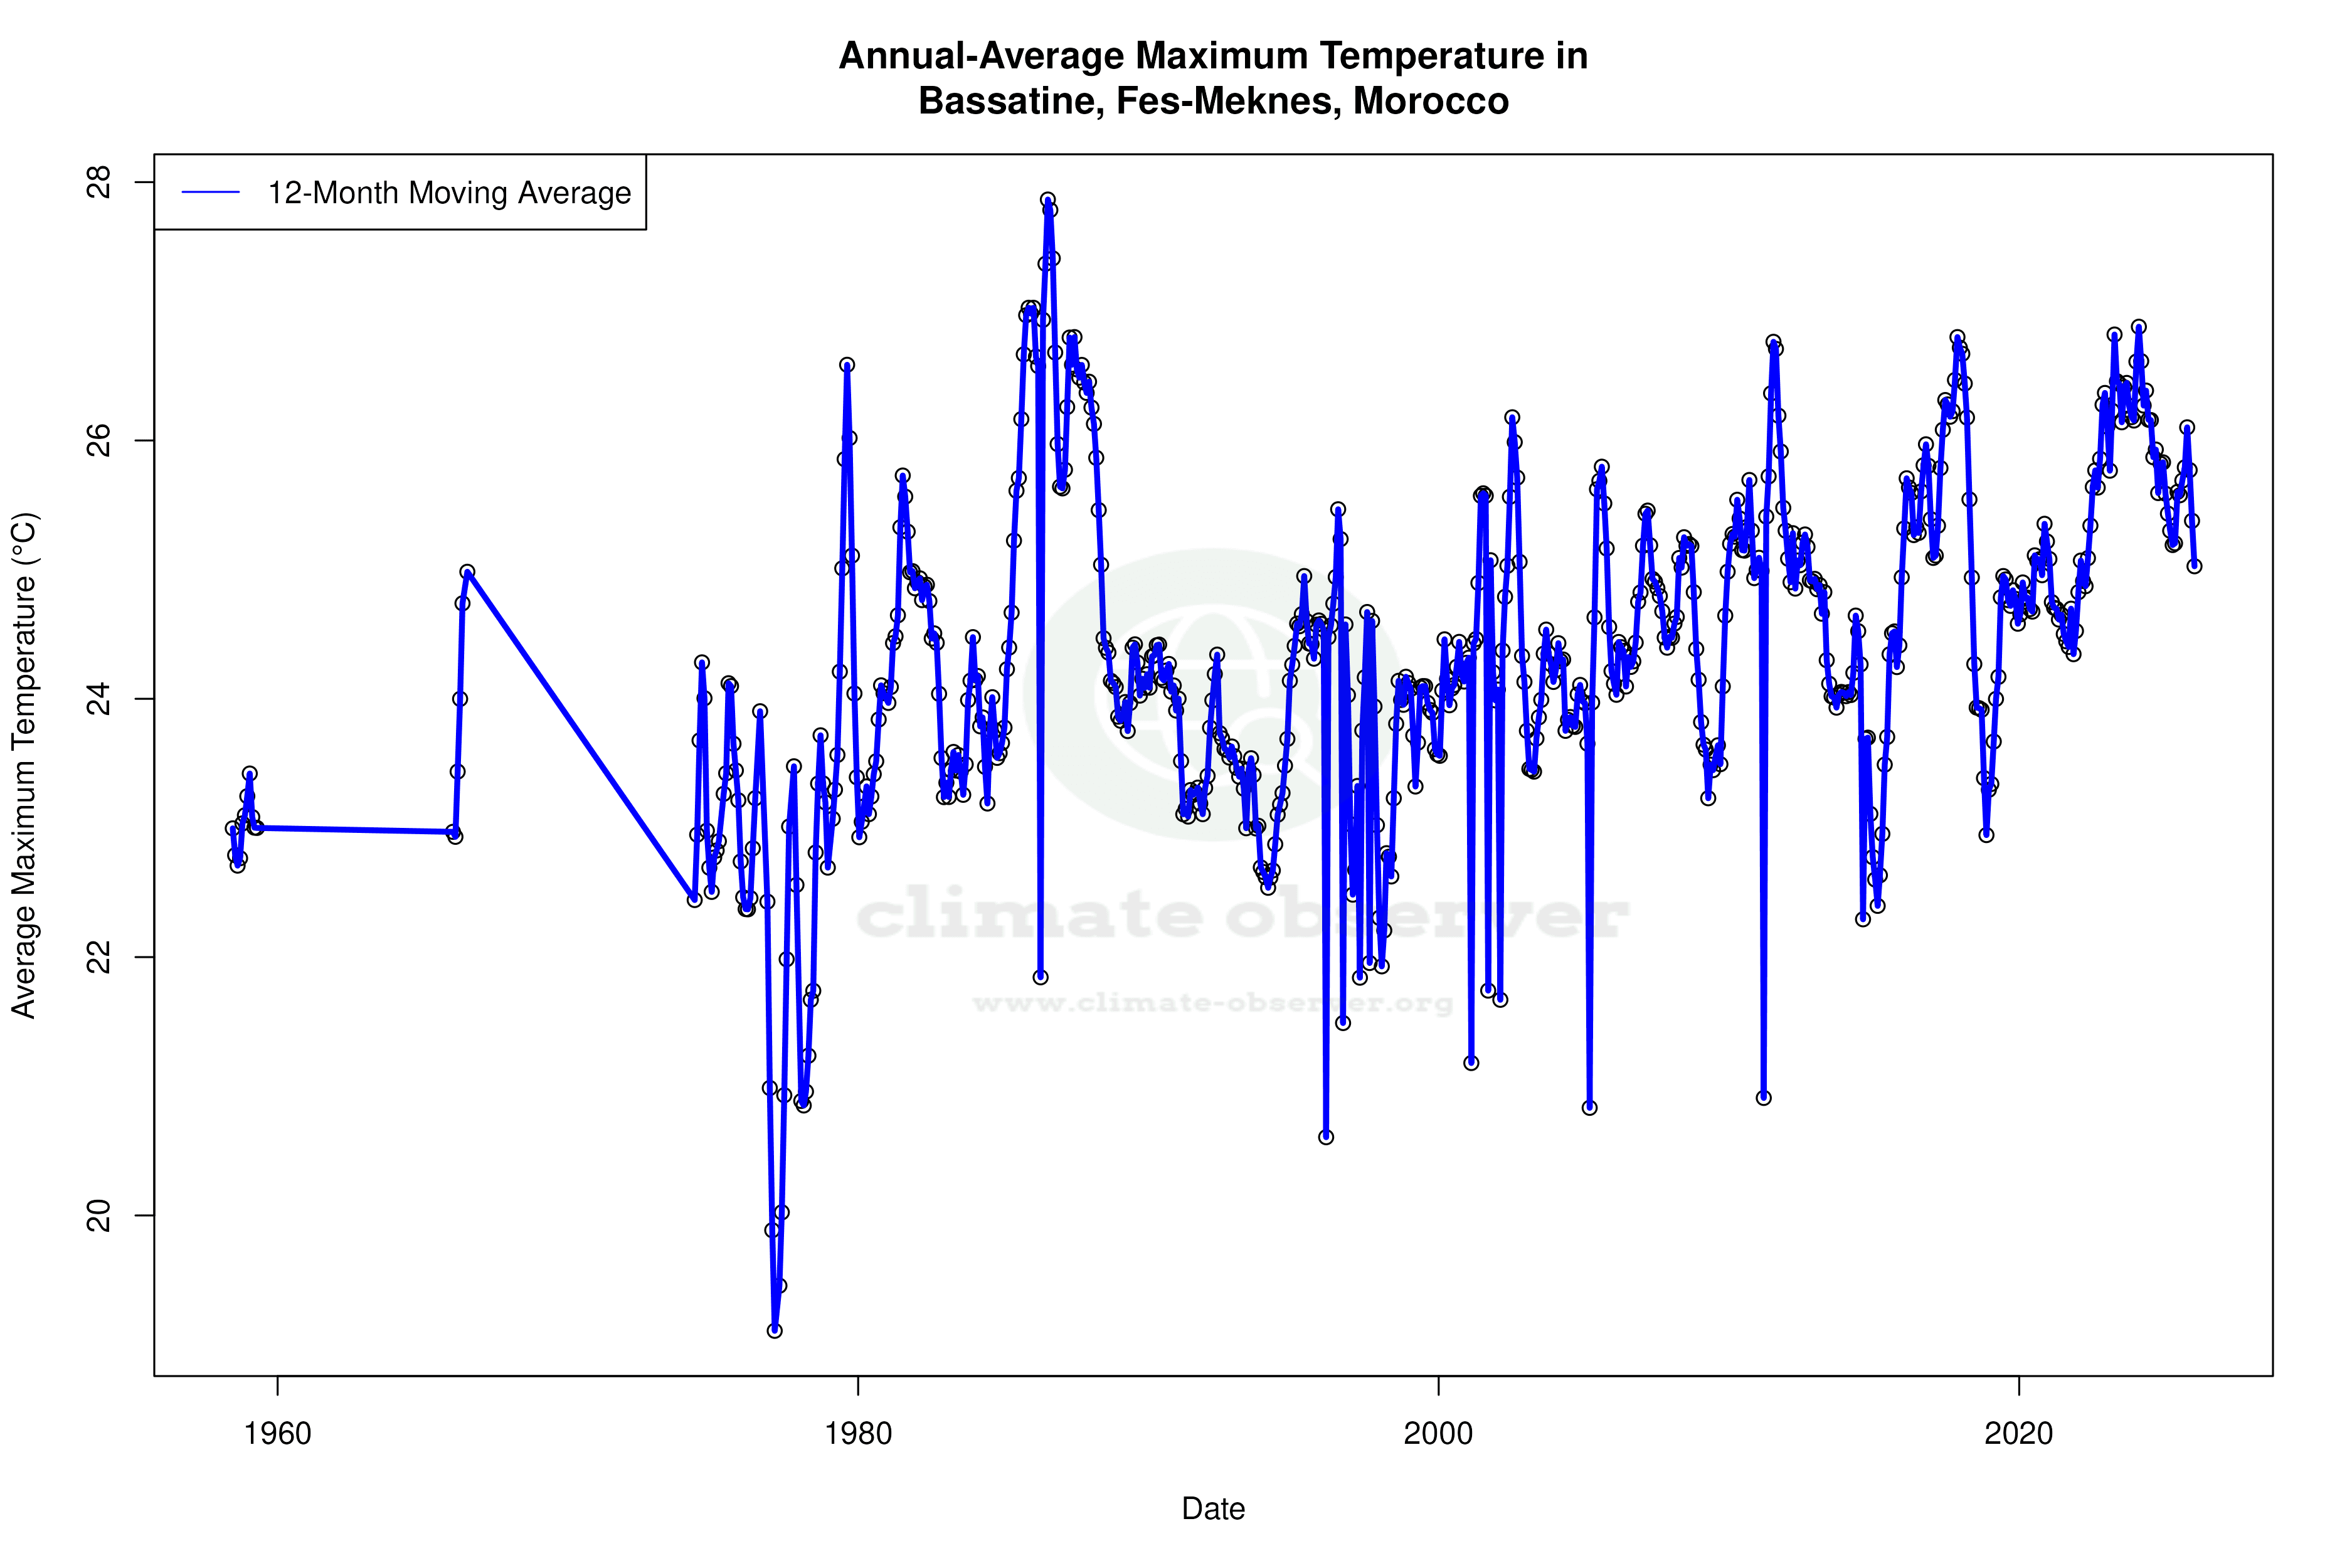


Max Temperature 12-Month MA | 1 of 6
Daily Data Points and Averages Throughout the Year


Average Max Temperature Throughout Year | 1 of 5
