Climate for Station: Essaouira, Marrakesh-Safi, Morocco
Loading live weather...
Climate Analysis & Overview
Essaouira's climate is experiencing a complex interplay of warming and cooling trends. While the all-time data shows a slight warming in highs, recent years have seen a cooling trend. Meanwhile, low temperatures are rising significantly, indicating a shift in the region's thermal dynamics. Precipitation patterns remain highly concentrated, with a marginal decrease in concentration.
Coastal Climate Dynamics
Essaouira, located along Morocco's Atlantic coast, falls under the Köppen climate classification of Csa, indicating a Mediterranean climate with hot, dry summers and mild, wet winters. The coastal geography, influenced by the Atlantic Ocean, plays a crucial role in moderating temperatures and affecting precipitation patterns. The all-time temperature data reveals a warming trend in high temperatures with an increase of 1.17°C (2.11°F). However, over the past decade, there has been a cooling trend in highs, decreasing by 0.62°C (1.12°F). This cooling in recent years contrasts with the long-term warming, suggesting possible shifts in atmospheric patterns or oceanic influences.
Rising Lows: A Significant Shift
The low temperatures in Essaouira present a different narrative. Over the past ten years, there has been a notable rise in low temperatures by 1.99°C (3.58°F), indicating warmer nights and potentially impacting local agriculture and energy usage. The all-time trend for lows shows a slight cooling of 0.08°C (0.14°F), which is negligible compared to the recent warming. This disparity between short-term and long-term trends could reflect changes in regional weather patterns or broader climatic shifts.
Precipitation Patterns: Marginal Changes
The Precipitation Concentration Index (PCI) for Essaouira is high, with a baseline value of 22.64 and a current value of 22.59. This marginal decrease suggests that precipitation remains highly concentrated in fewer events, typical of a Mediterranean climate. Such concentration can lead to challenges in water management and agriculture, especially in a region where water resources are crucial for sustaining local communities and ecosystems.
Temperature Extremes and Regional Context
Essaouira has experienced temperature extremes with a record high of 43.09°C (109.56°F) and a record low of 0.37°C (32.67°F). These extremes highlight the variability within the region's climate. Morocco's national climate goals focus on adapting to such changes, aiming to enhance resilience against temperature fluctuations and precipitation variability. Recent weather events, such as heatwaves or unusual rainfall patterns, underscore the importance of these goals in safeguarding the region's economic and ecological stability.
Station Statistics
10-Year Trend
High: -2.23 °F/decade
Low: +4.11 °F/decade
Rain: -0.011 in/decade
25-Year Trend
High: +3.23 °F/decade
Low: +0.33 °F/decade
Rain: -0.005 in/decade
50-Year Trend
High: +2.17 °F/decade
Low: -0.17 °F/decade
Rain: +0.000 in/decade
All-Time Trend
High: +2.07 °F/decade
Low: -0.14 °F/decade
Rain: +0.000 in/decade
Percentage Above-Average Days
Last 12 Months: 24.4%
This Year: 53.3%
Precipitation Concentration Index (PCI) ℹ️
Last 12 Months: 25.2
Historical Average: 24.3
Percentile Rank of Last 12 Months ℹ️
High: 35th percentile
Low: 97th percentile
Rain: 67th percentile
Change in Variance ℹ️
High: +50.0%
Low: +14.9%
Intraday: +23.5%
Data Coverage
83.8%
First Year of Data
1965
Station Location
Historical Weather Records
| Max High | Avg High | Min High | Max Avg | Avg Avg | Min Avg | Max Low | Avg Low | Min Low | Max Precipitation | Avg Precipitation | Max Snow | Avg Snow | |
|---|---|---|---|---|---|---|---|---|---|---|---|---|---|
| Record | 109.56 °F | — | 48.47 °F | 94.69 °F | — | 44.20 °F | 84.51 °F | — | 32.67 °F | 4.55 in | — | — | — |
| January | 86.00 °F | 65.65 °F | 48.47 °F | 73.04 °F | 58.25 °F | 44.20 °F | 68.00 °F | 50.02 °F | 32.67 °F | 2.02 in | 0.06 in | — | — |
| February | 87.55 °F | 66.50 °F | 50.63 °F | 77.72 °F | 59.39 °F | 44.58 °F | 66.20 °F | 51.55 °F | 36.43 °F | 1.50 in | 0.05 in | — | — |
| March | 89.98 °F | 68.54 °F | 51.35 °F | 77.54 °F | 61.47 °F | 47.88 °F | 71.60 °F | 54.06 °F | 40.44 °F | 1.30 in | 0.05 in | — | — |
| April | 93.90 °F | 69.55 °F | 56.79 °F | 78.35 °F | 62.86 °F | 52.23 °F | 69.80 °F | 55.72 °F | 42.19 °F | 1.10 in | 0.03 in | — | — |
| May | 102.60 °F | 72.37 °F | 58.77 °F | 88.16 °F | 65.30 °F | 54.97 °F | 75.97 °F | 58.64 °F | 42.80 °F | 1.50 in | 0.01 in | — | — |
| June | 107.67 °F | 75.73 °F | 64.04 °F | 91.81 °F | 68.00 °F | 61.34 °F | 80.65 °F | 62.12 °F | 52.59 °F | 0.18 in | 0.00 in | — | — |
| July | 109.56 °F | 79.44 °F | 65.12 °F | 94.23 °F | 70.10 °F | 61.88 °F | 83.55 °F | 64.64 °F | 55.42 °F | 0.06 in | 0.00 in | — | — |
| August | 108.91 °F | 80.25 °F | 66.20 °F | 94.69 °F | 71.18 °F | 62.24 °F | 84.51 °F | 65.42 °F | 55.40 °F | 1.02 in | 0.00 in | — | — |
| September | 105.80 °F | 77.77 °F | 64.76 °F | 89.60 °F | 69.78 °F | 59.36 °F | 80.17 °F | 64.21 °F | 51.94 °F | 1.32 in | 0.01 in | — | — |
| October | 97.07 °F | 75.10 °F | 61.09 °F | 82.94 °F | 67.76 °F | 55.60 °F | 75.74 °F | 61.64 °F | 48.81 °F | 1.40 in | 0.02 in | — | — |
| November | 95.00 °F | 70.86 °F | 50.22 °F | 83.12 °F | 63.71 °F | 50.25 °F | 73.76 °F | 56.49 °F | 37.40 °F | 4.55 in | 0.06 in | — | — |
| December | 87.80 °F | 67.23 °F | 51.22 °F | 75.02 °F | 60.13 °F | 47.17 °F | 69.44 °F | 52.35 °F | 38.12 °F | 2.17 in | 0.06 in | — | — |
Data Visualisations
Remove WatermarksCurrent Year Climate Trends vs Historical


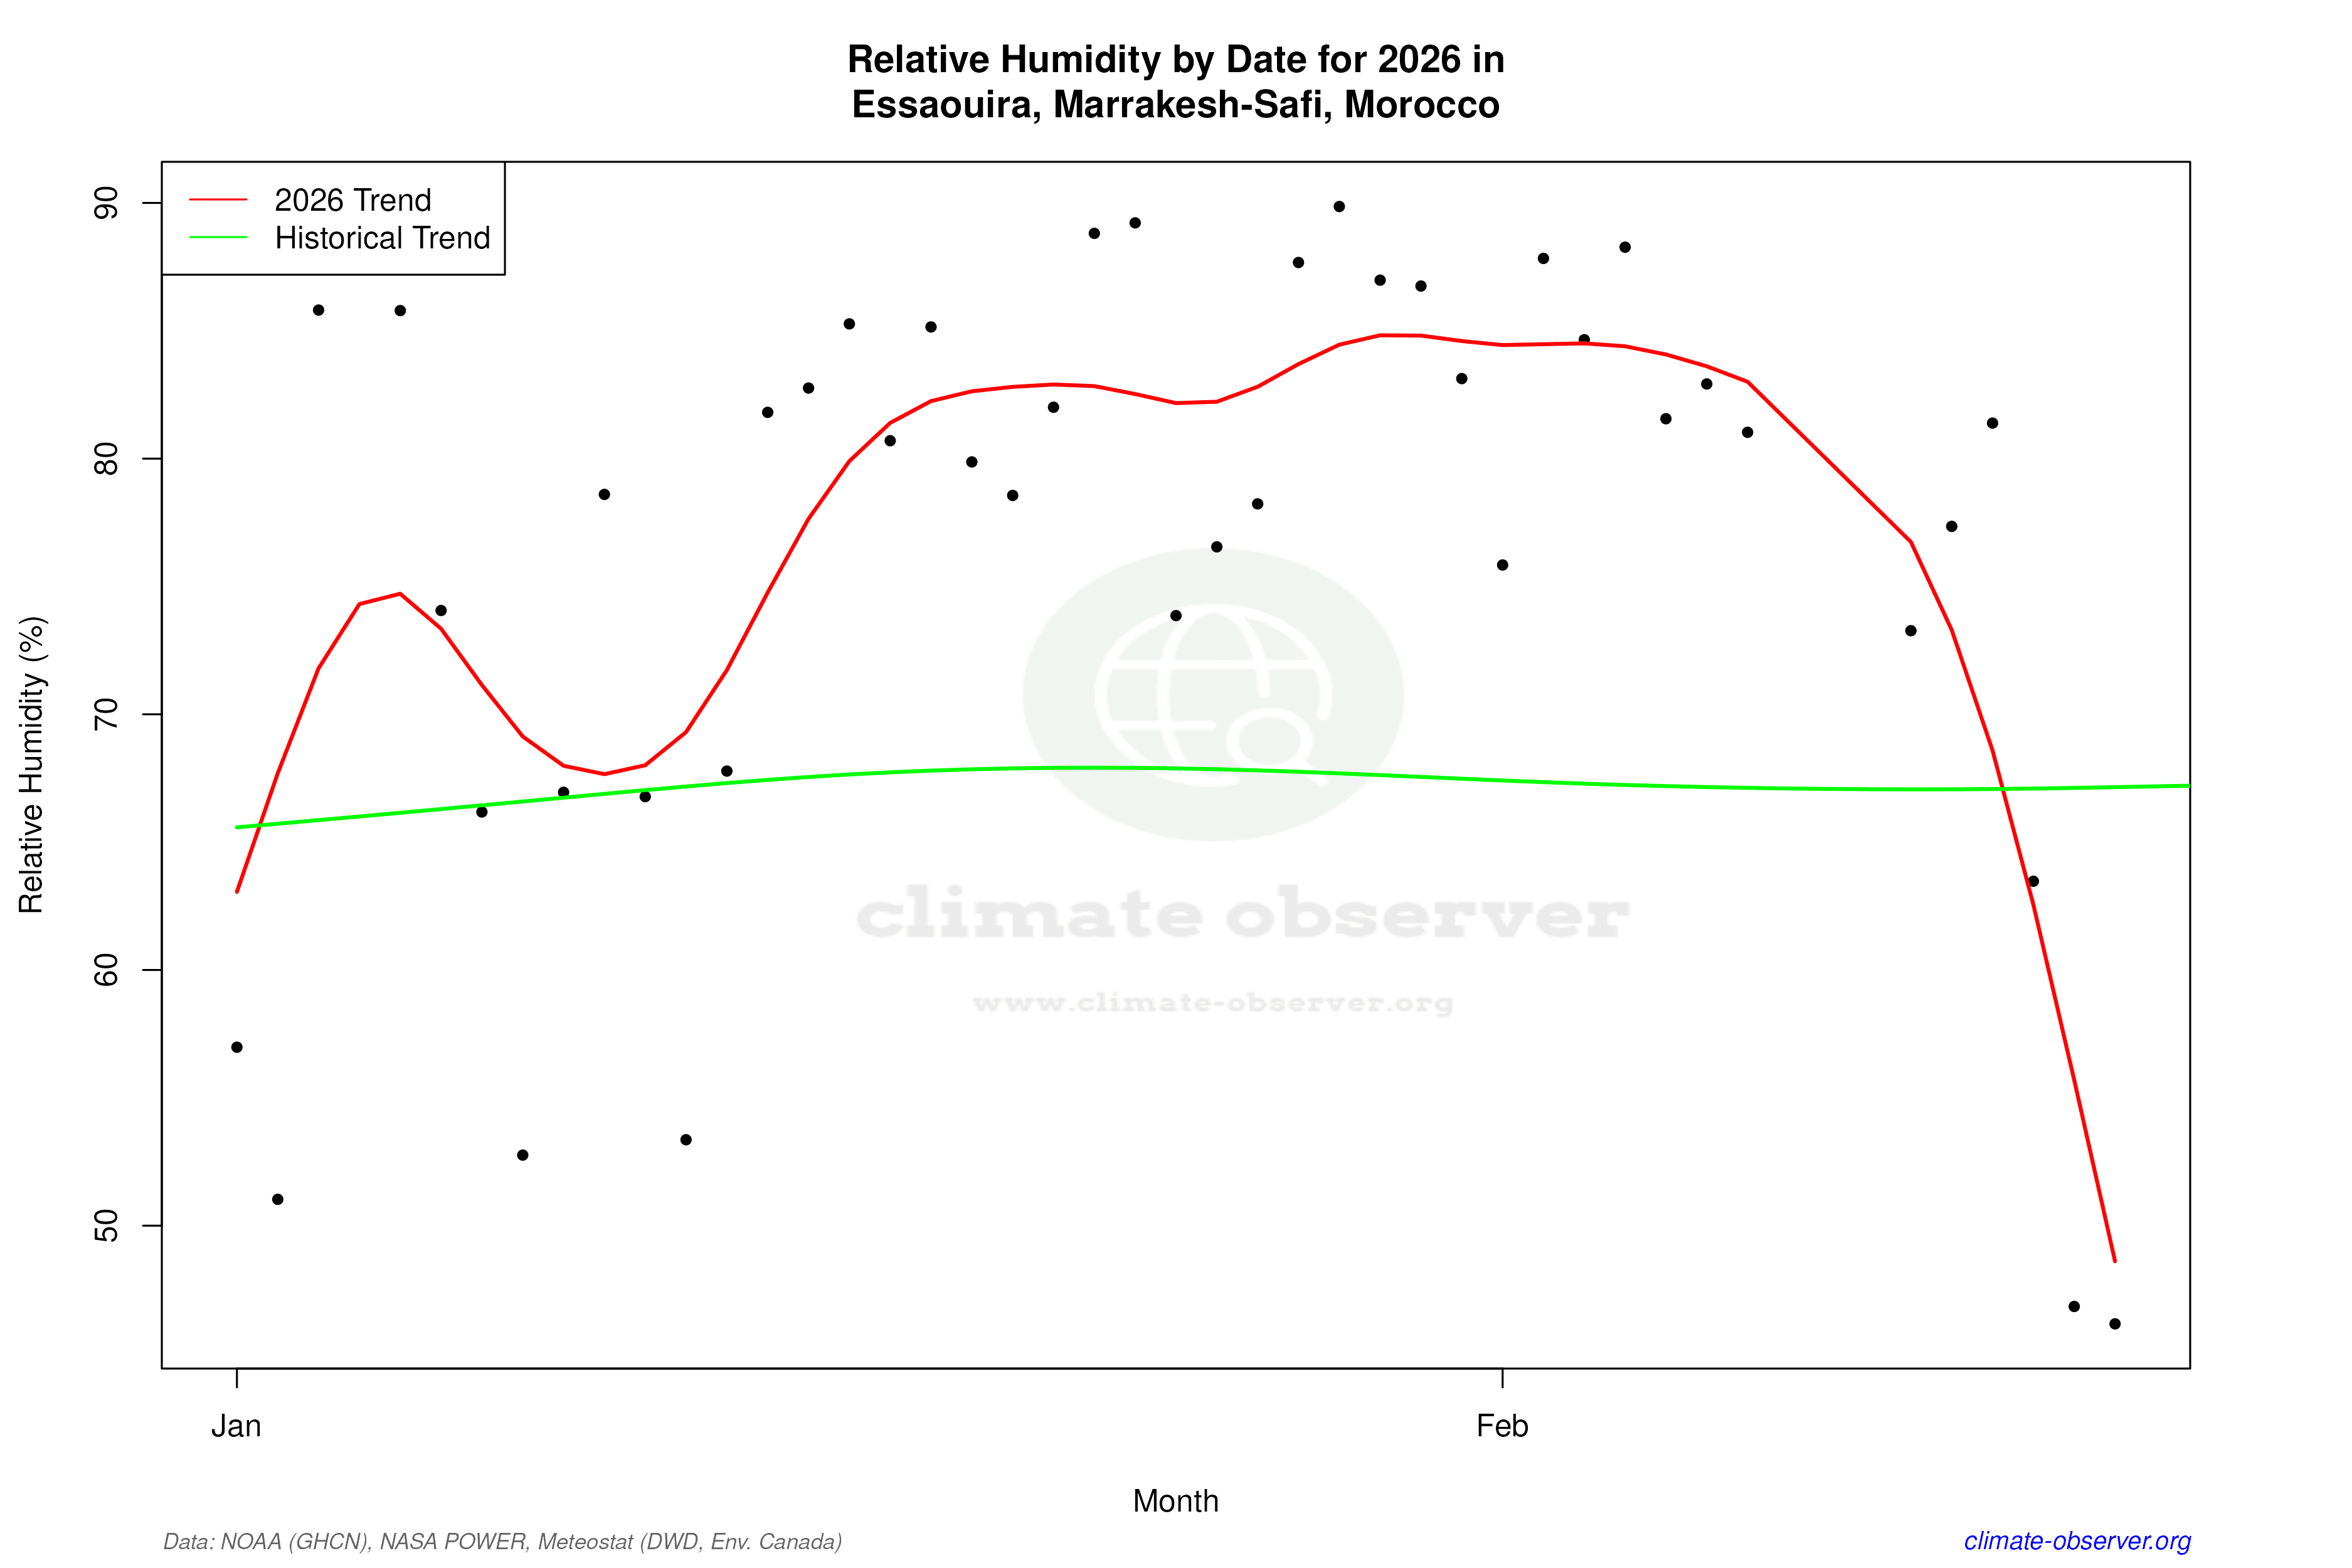

Max Temperature this Year | 1 of 6
Climate 12-Month Moving Averages


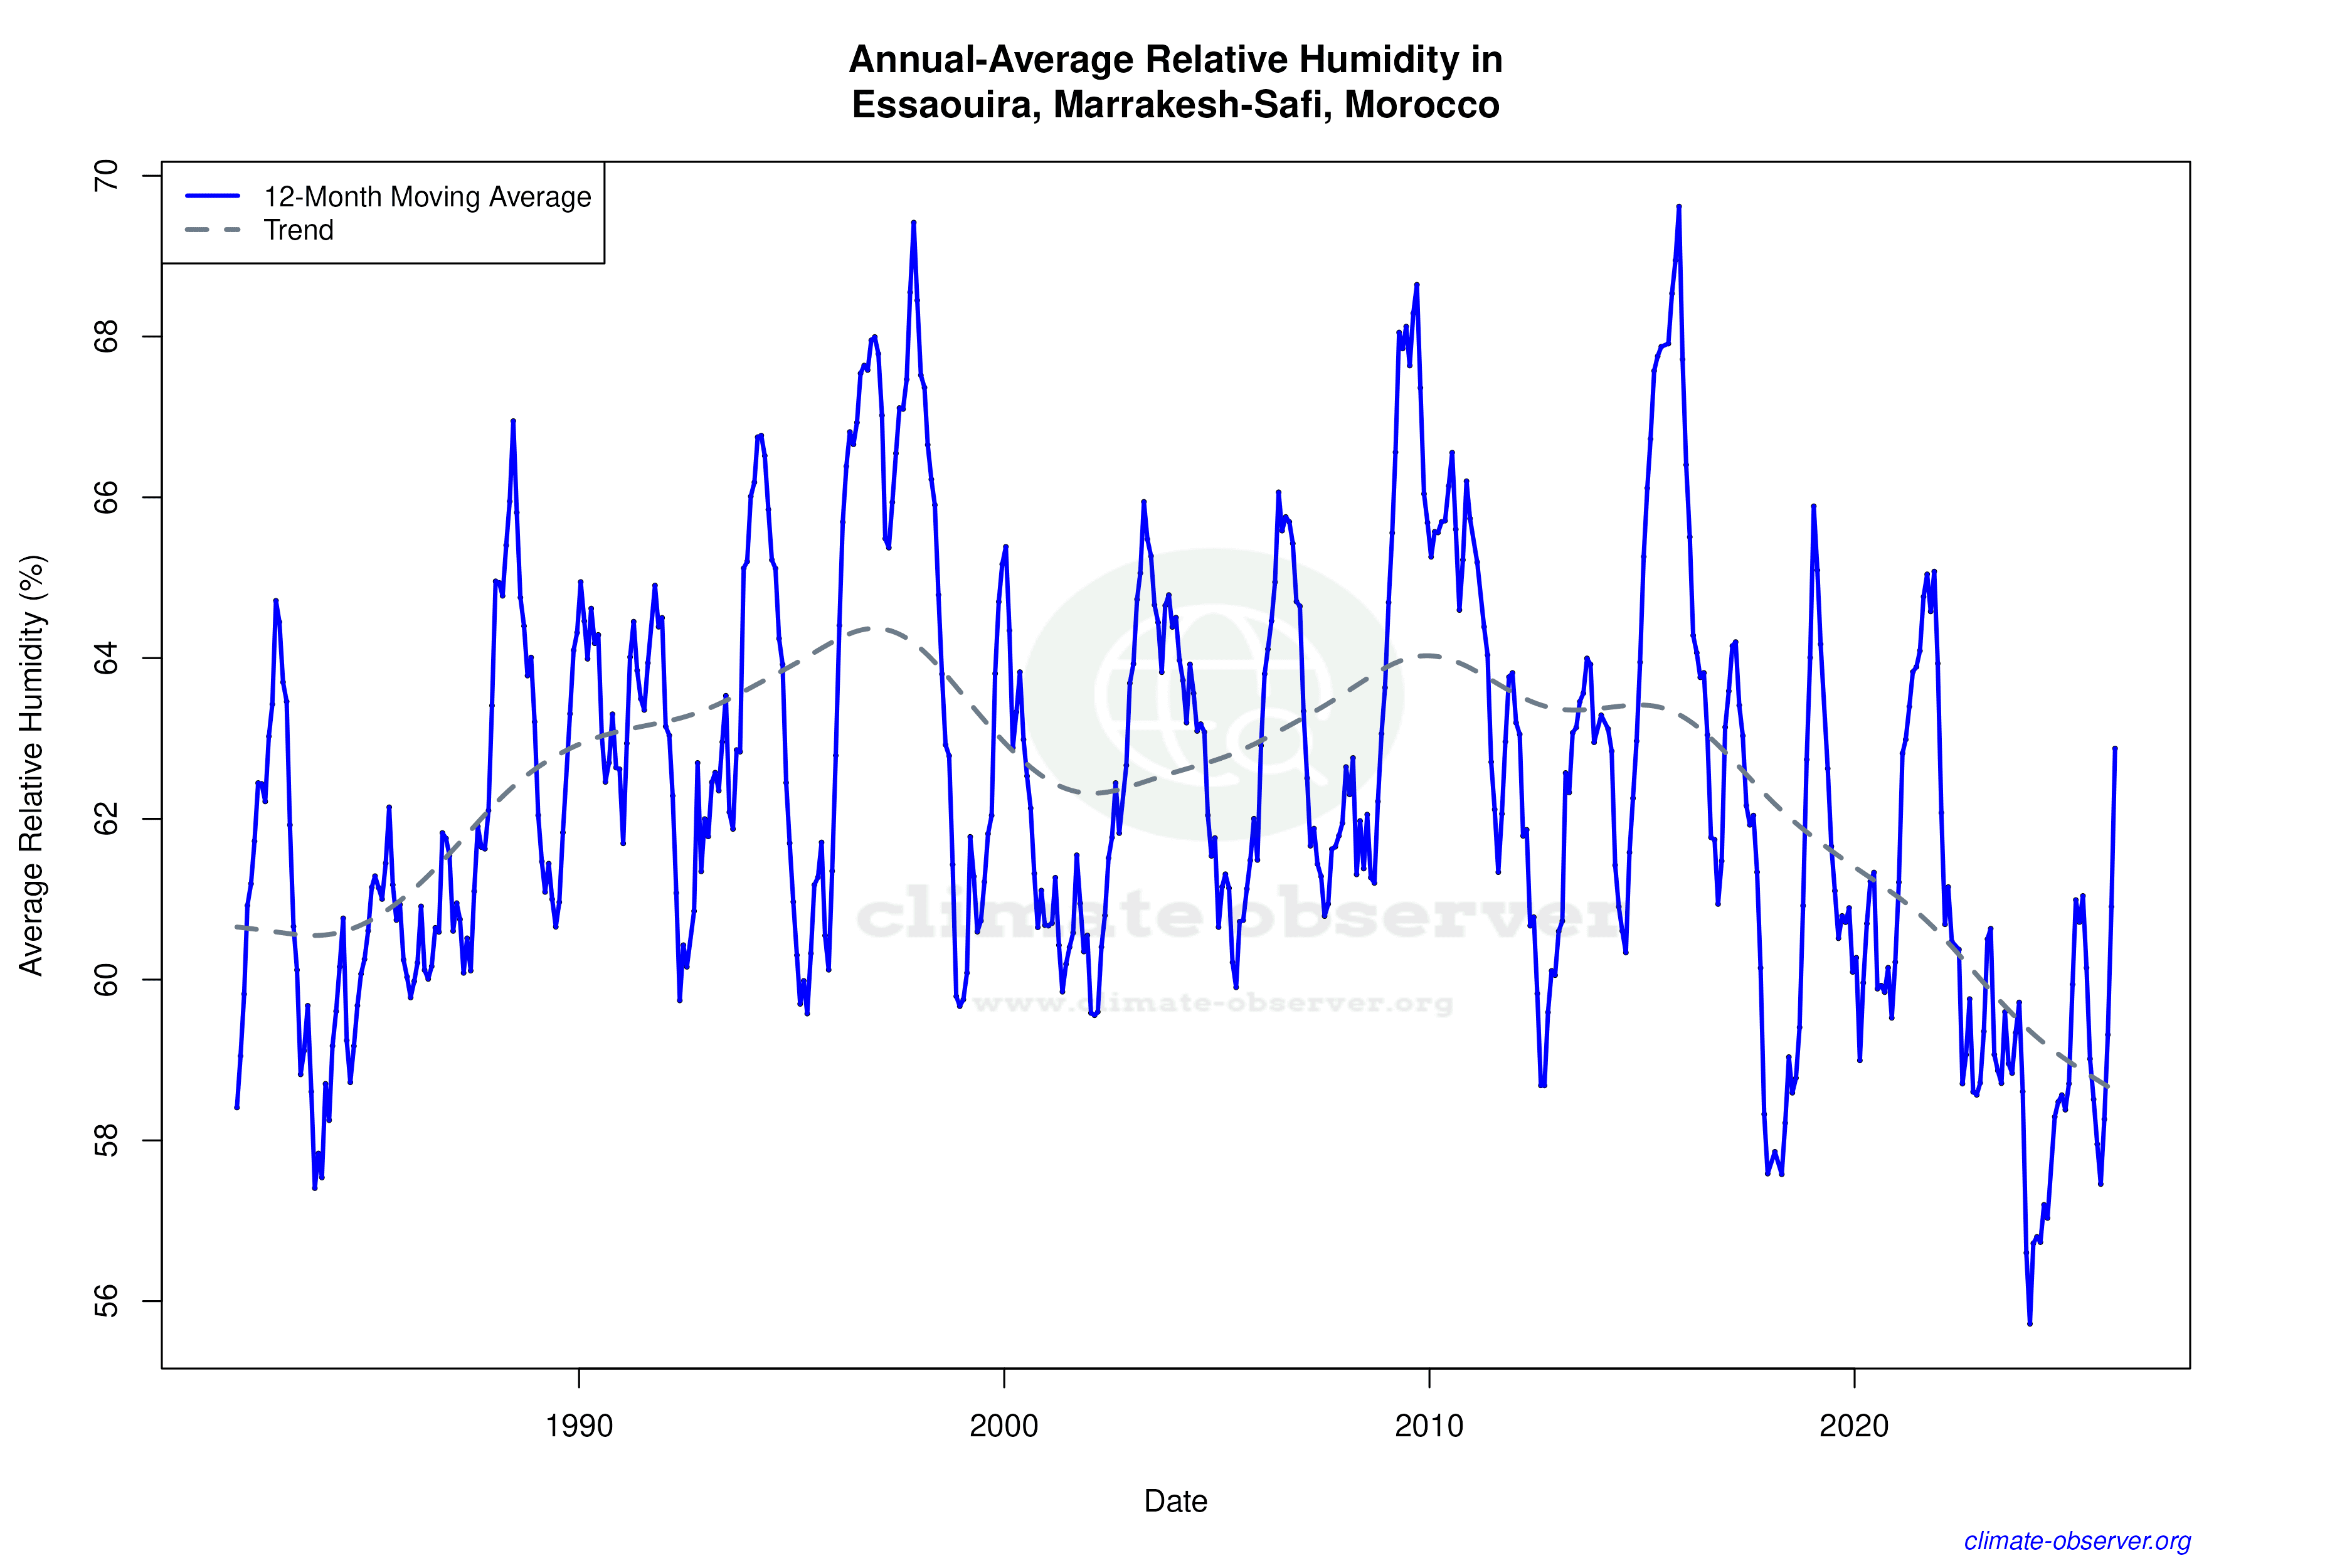

Max Temperature 12-Month MA | 1 of 6
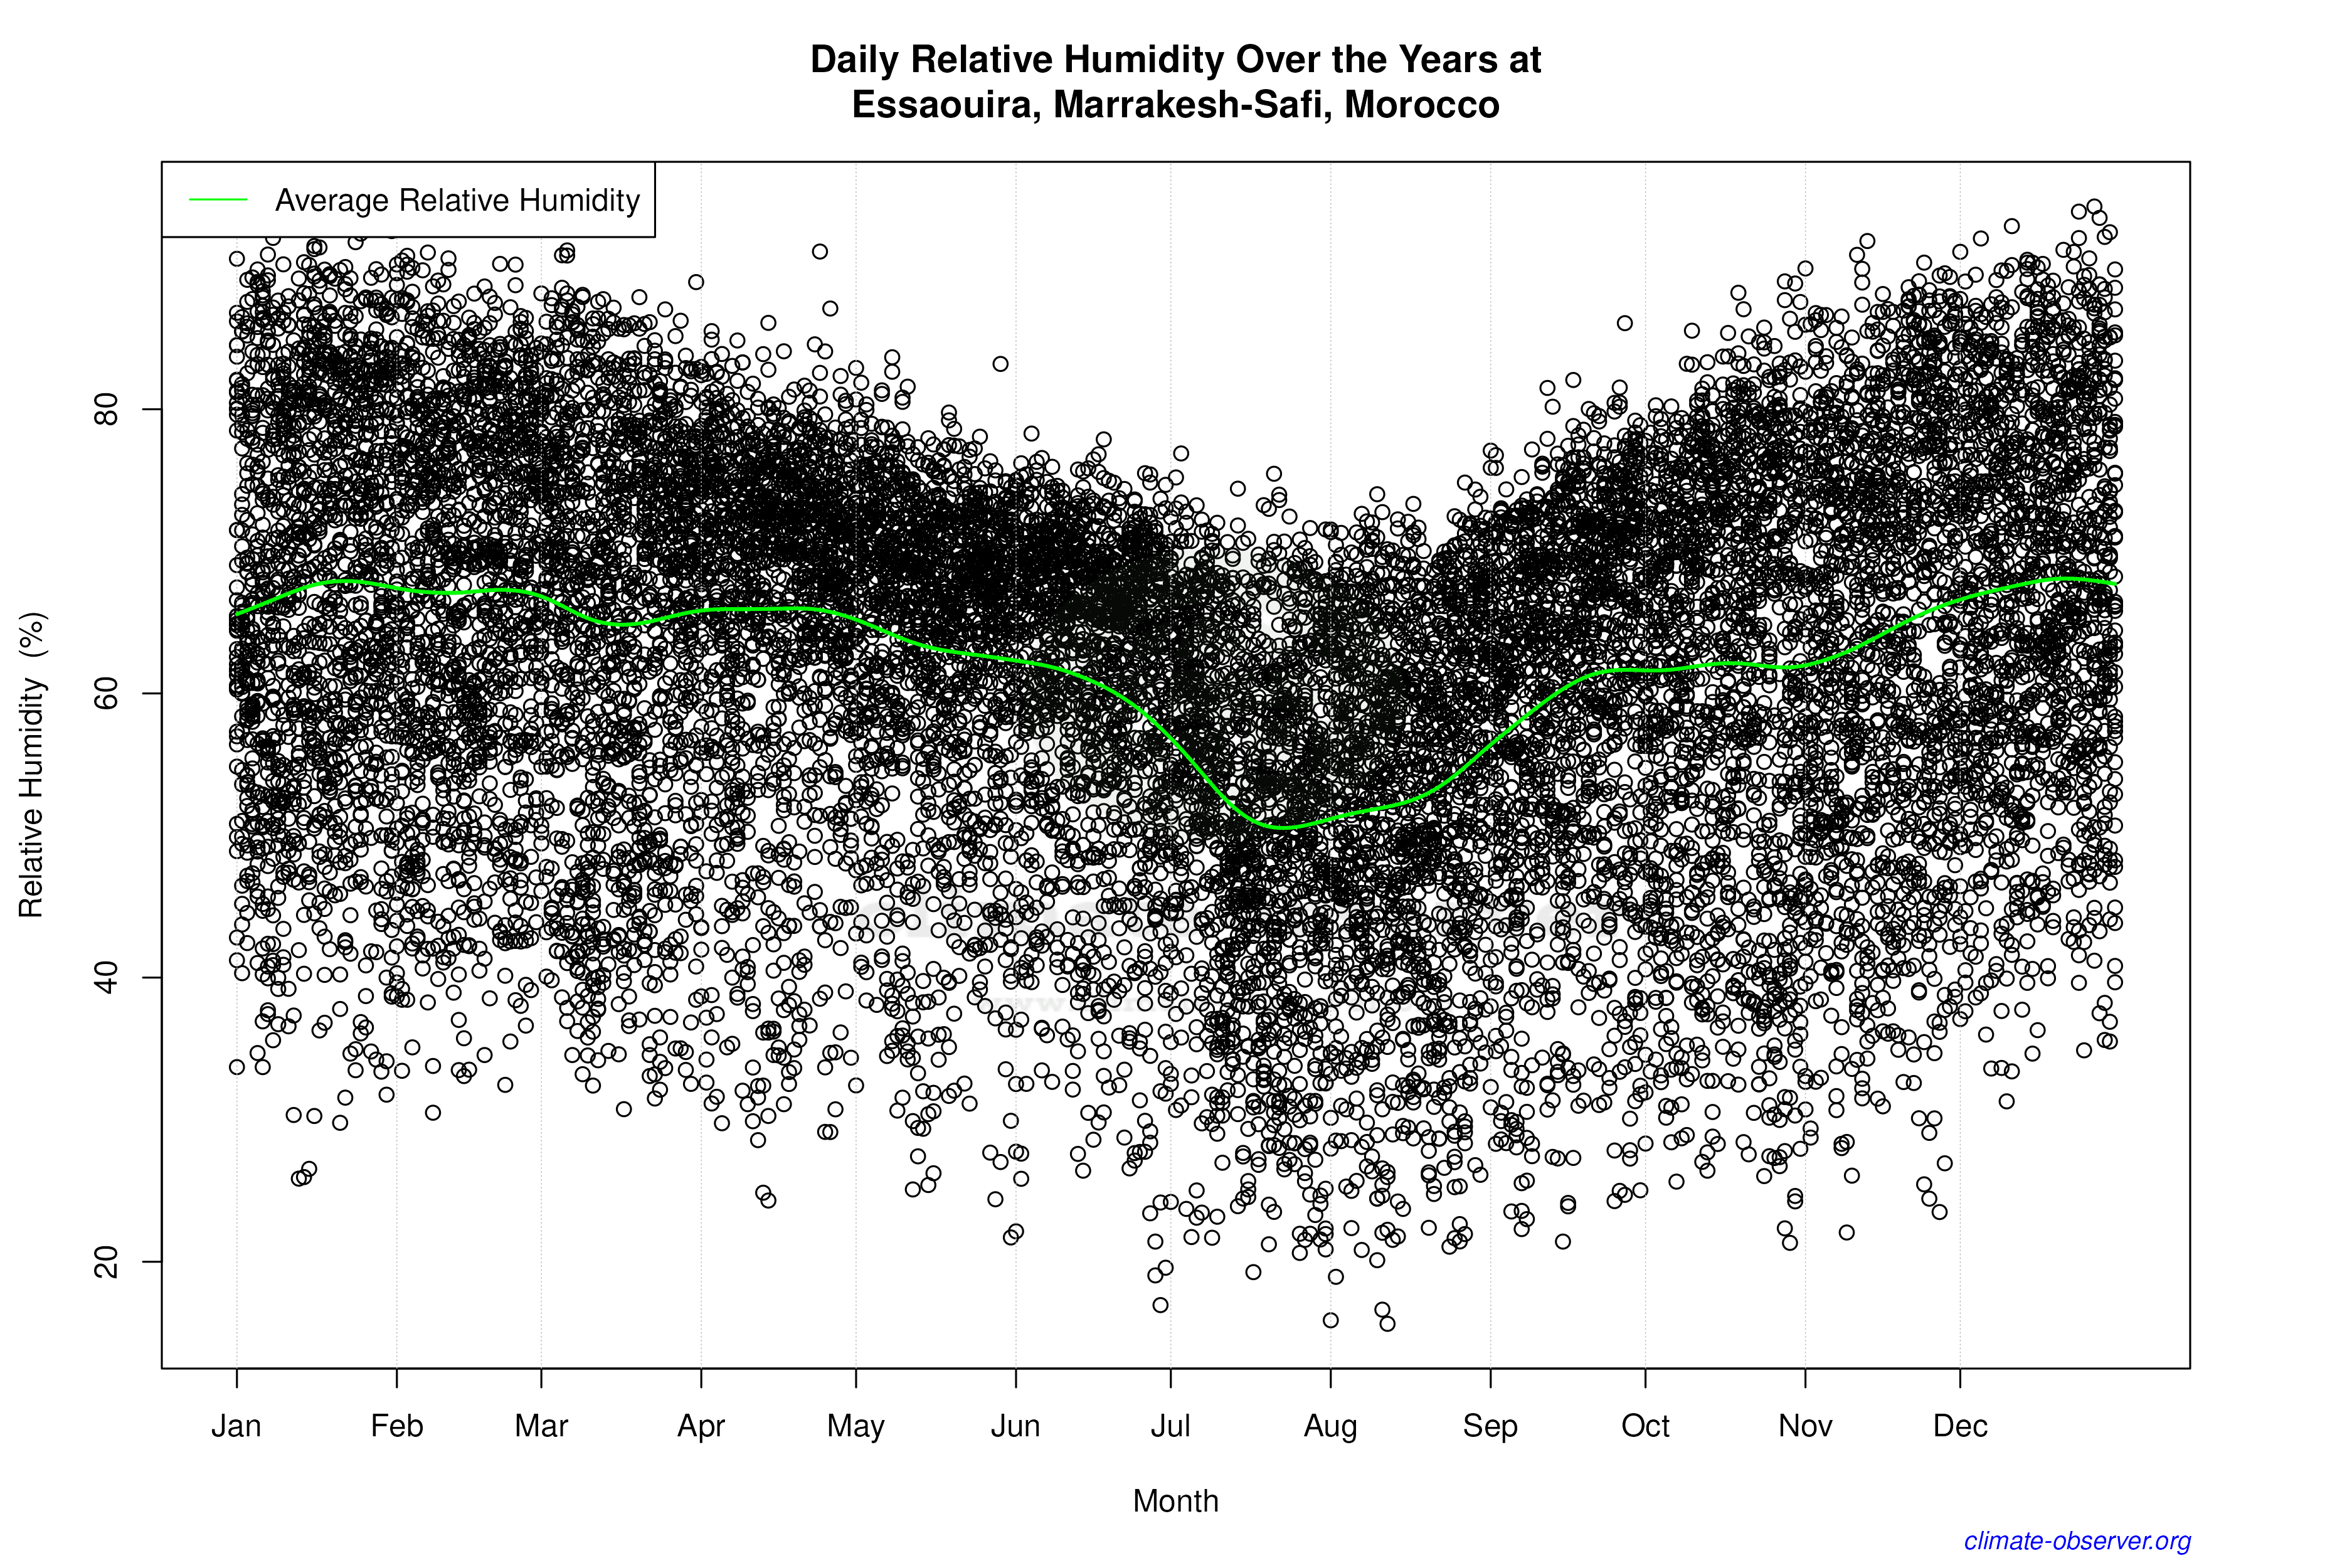
Daily Data Points and Averages Throughout the Year
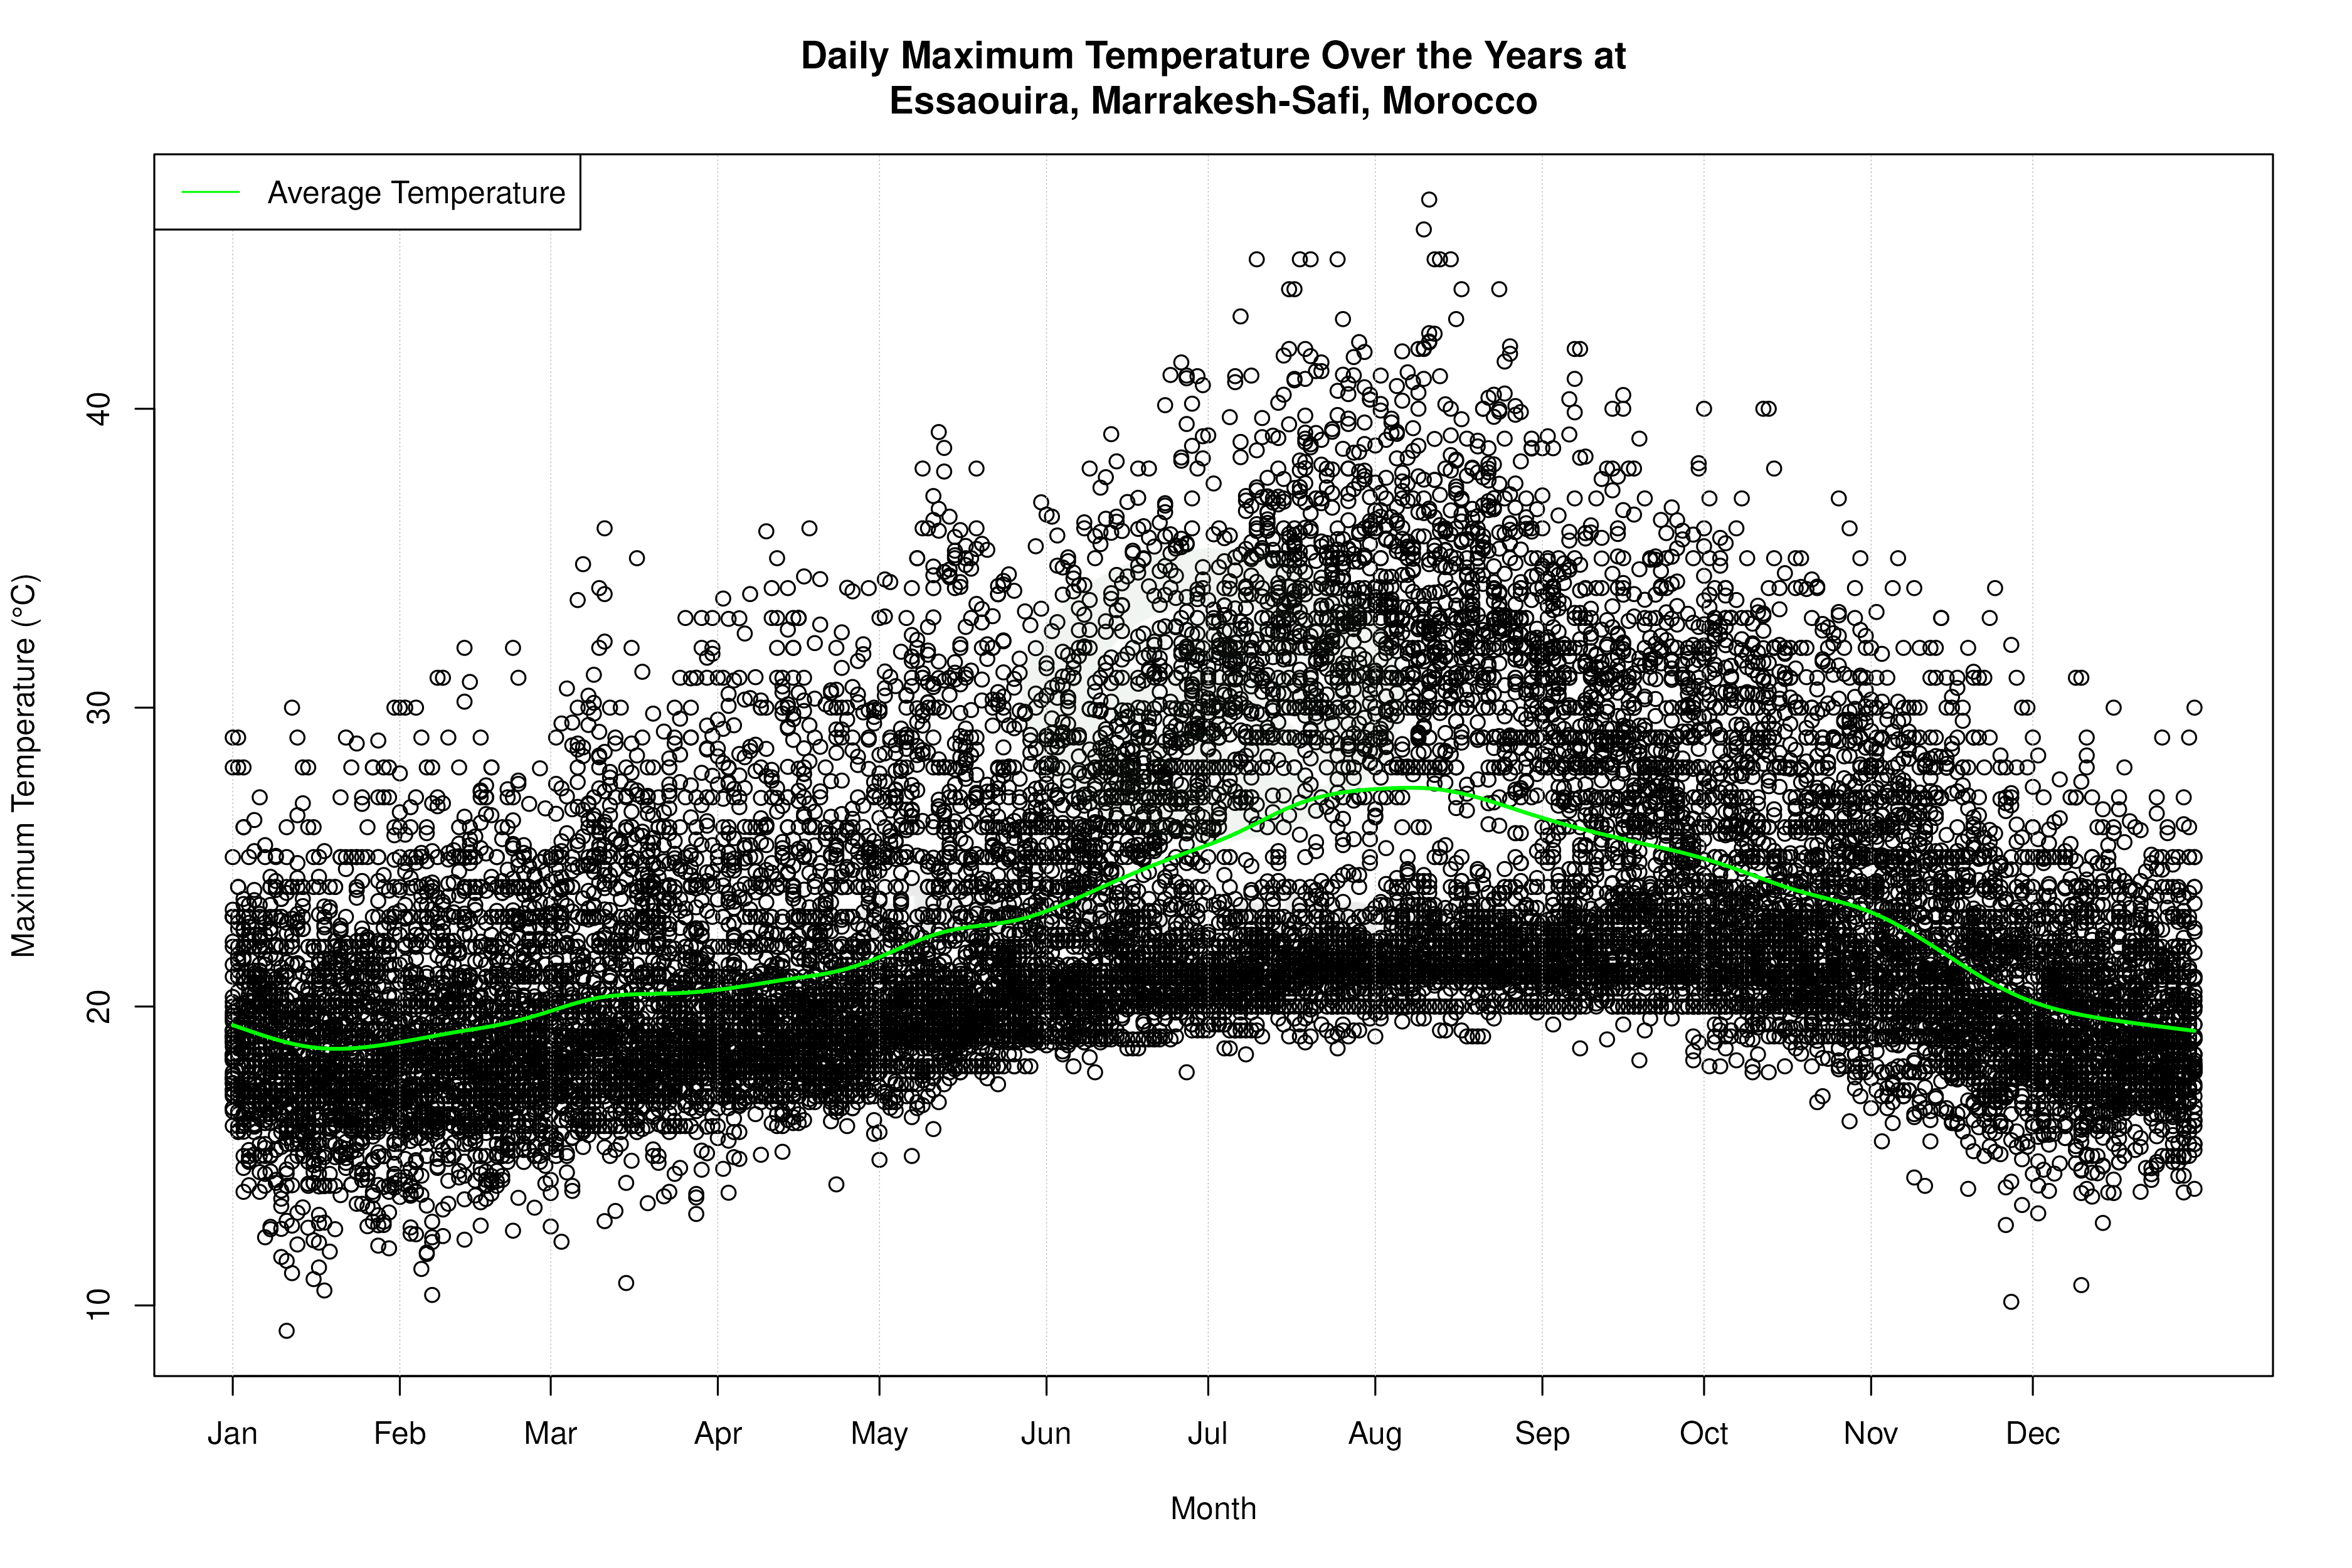


Average Max Temperature Throughout Year | 1 of 5
