Climate for Station: St. Brandon St. Ra, St. Brandon, Mauritius
Loading live weather...
Climate Analysis & Overview
Saint Brandon, Mauritius, is experiencing a complex climate narrative. While the all-time trends suggest a slight warming, recent 10-year data indicates a cooling trend for highs. The Precipitation Concentration Index shows a notable decrease, suggesting more evenly distributed rainfall.
Tropical Maritime Climate Dynamics
Saint Brandon, located in the Indian Ocean, falls under the tropical maritime climate classification. This small island archipelago is influenced by its proximity to the ocean, which moderates temperatures and contributes to its unique climatic patterns. The all-time temperature trends reveal a warming of 0.06°C (0.11°F) for highs and 0.25°C (0.45°F) for lows. This gradual increase aligns with broader regional warming trends observed across Mauritius. However, the last decade tells a different story, with highs showing a cooling of 3.91°C (7.04°F) and lows a slight cooling of 0.14°C (0.25°F). This divergence between long-term and recent trends highlights the complexity of local climatic influences, possibly affected by oceanic currents and atmospheric conditions.
Thermal Extremes and Records
Temperature extremes on Saint Brandon have been recorded at 36.4°C (97.5°F) for the maximum and 16.4°C (61.5°F) for the minimum. These records reflect the island's capacity for both intense heat and cooler temperatures, despite its tropical setting. The moderation of temperatures is largely due to the maritime influence, which prevents extreme fluctuations typically seen in continental climates.
Precipitation Patterns and Distribution
The Precipitation Concentration Index (PCI) is a measure of how rainfall is distributed over time. A decrease in PCI from a baseline of 19.90 to a current 13.00 indicates a significant shift towards more evenly distributed precipitation events. This change suggests that rainfall is becoming less concentrated in isolated events and more spread out across the year. Such a pattern can have profound implications for local ecosystems and water management strategies, as more consistent rainfall can support agriculture and reduce the risk of flooding.
Regional Climate Goals and Implications
Mauritius has been proactive in addressing climate change, with initiatives aimed at reducing carbon emissions and promoting sustainable development. The observed climatic changes on Saint Brandon provide important insights into the effectiveness of these strategies. The cooling trend in recent years, particularly for high temperatures, may reflect localised climatic shifts or the impact of broader environmental policies. Understanding these dynamics is crucial for future planning and adaptation efforts, as Mauritius continues to navigate the challenges posed by global climate change.
Station Statistics
10-Year Trend
High: -6.73 °F/decade
Low: -0.02 °F/decade
Rain: -0.007 in/decade
25-Year Trend
High: -1.76 °F/decade
Low: +0.64 °F/decade
Rain: -0.009 in/decade
50-Year Trend
High: +0.19 °F/decade
Low: +0.63 °F/decade
Rain: -0.003 in/decade
All-Time Trend
High: +0.08 °F/decade
Low: +0.46 °F/decade
Rain: -0.001 in/decade
Percentage Above-Average Days
Last 12 Months: 18.9%
This Year: 0.0%
Precipitation Concentration Index (PCI) ℹ️
Last 12 Months: 13.2
Historical Average: 15.4
Percentile Rank of Last 12 Months ℹ️
High: 2nd percentile
Low: 93rd percentile
Rain: 17th percentile
Change in Variance ℹ️
High: +3.0%
Low: -19.6%
Intraday: +104.2%
Data Coverage
88.4%
First Year of Data
1951
Station Location
Historical Weather Records
| Max High | Avg High | Min High | Max Avg | Avg Avg | Min Avg | Max Low | Avg Low | Min Low | Max Precipitation | Avg Precipitation | Max Snow | Avg Snow | |
|---|---|---|---|---|---|---|---|---|---|---|---|---|---|
| Record | 97.52 °F | — | 71.60 °F | 89.96 °F | — | 69.80 °F | 84.56 °F | — | 61.52 °F | 9.67 in | — | — | — |
| January | 96.08 °F | 86.75 °F | 78.80 °F | 89.96 °F | 82.72 °F | 76.46 °F | 83.77 °F | 78.13 °F | 70.34 °F | 8.35 in | 0.19 in | — | — |
| February | 95.18 °F | 87.05 °F | 79.52 °F | 89.96 °F | 83.01 °F | 76.82 °F | 83.61 °F | 78.43 °F | 69.08 °F | 9.67 in | 0.23 in | — | — |
| March | 95.18 °F | 87.07 °F | 78.80 °F | 88.34 °F | 83.03 °F | 76.64 °F | 84.56 °F | 78.56 °F | 68.90 °F | 3.98 in | 0.17 in | — | — |
| April | 93.92 °F | 85.70 °F | 77.90 °F | 87.62 °F | 82.00 °F | 76.28 °F | 83.98 °F | 77.82 °F | 69.44 °F | 3.59 in | 0.14 in | — | — |
| May | 92.12 °F | 82.79 °F | 75.74 °F | 85.46 °F | 79.67 °F | 73.22 °F | 81.79 °F | 75.79 °F | 64.58 °F | 3.37 in | 0.08 in | — | — |
| June | 89.24 °F | 79.61 °F | 74.12 °F | 83.30 °F | 76.92 °F | 71.78 °F | 79.81 °F | 73.18 °F | 62.24 °F | 2.21 in | 0.06 in | — | — |
| July | 86.54 °F | 77.94 °F | 72.14 °F | 80.78 °F | 75.22 °F | 70.34 °F | 77.86 °F | 71.41 °F | 61.52 °F | 3.96 in | 0.06 in | — | — |
| August | 85.64 °F | 77.79 °F | 71.60 °F | 80.96 °F | 74.78 °F | 69.80 °F | 77.11 °F | 70.79 °F | 61.70 °F | 4.59 in | 0.06 in | — | — |
| September | 87.44 °F | 78.75 °F | 72.32 °F | 80.96 °F | 75.49 °F | 70.16 °F | 76.64 °F | 71.46 °F | 61.70 °F | 1.06 in | 0.03 in | — | — |
| October | 89.06 °F | 80.59 °F | 73.94 °F | 82.58 °F | 77.01 °F | 71.06 °F | 77.90 °F | 72.91 °F | 65.30 °F | 2.59 in | 0.03 in | — | — |
| November | 92.30 °F | 83.16 °F | 75.11 °F | 86.90 °F | 79.33 °F | 73.76 °F | 80.78 °F | 75.05 °F | 67.82 °F | 3.25 in | 0.04 in | — | — |
| December | 97.52 °F | 85.69 °F | 77.72 °F | 89.24 °F | 81.63 °F | 76.46 °F | 83.12 °F | 77.11 °F | 69.08 °F | 3.37 in | 0.09 in | — | — |
Data Visualisations
Remove WatermarksCurrent Year Climate Trends vs Historical


Max Temperature this Year | 1 of 6
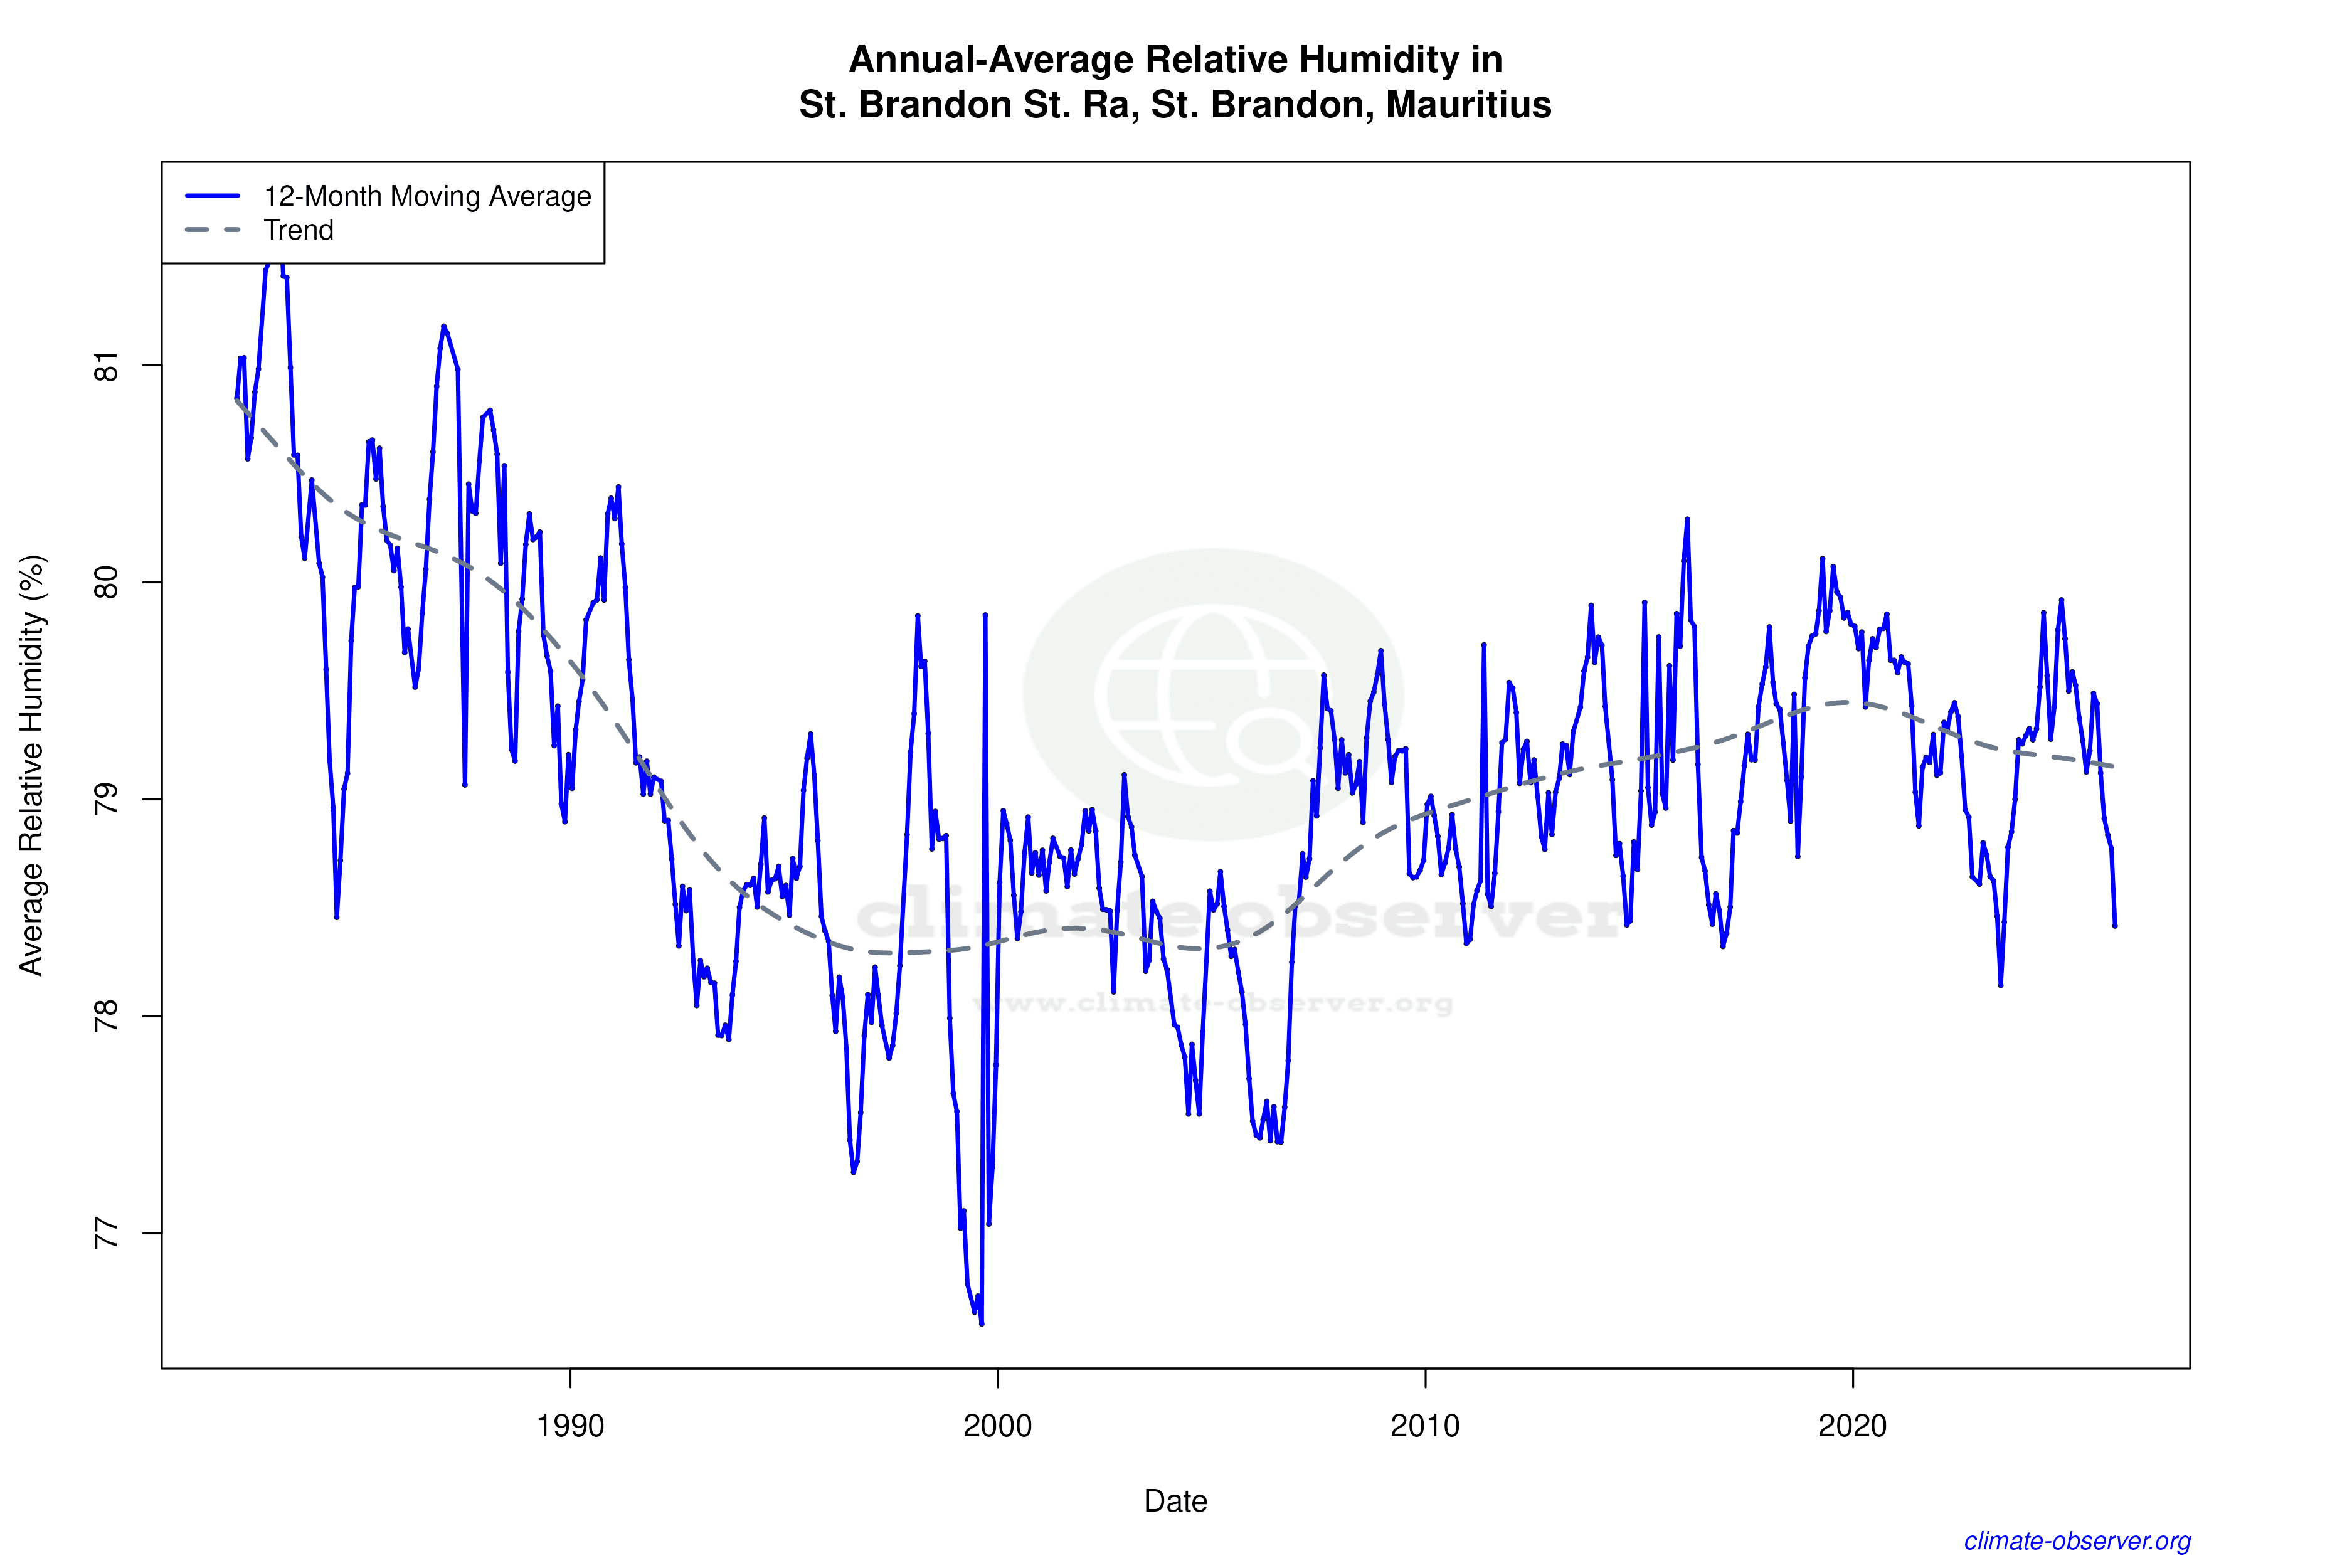
Climate 12-Month Moving Averages


Max Temperature 12-Month MA | 1 of 6
Daily Data Points and Averages Throughout the Year


Average Max Temperature Throughout Year | 1 of 5