Climate for Station: Altar (Obs), Sonora, Mexico
Loading live weather...
Climate Analysis & Overview
Altar, Sonora is experiencing contrasting temperature trends with a recent cooling in highs and a warming in lows over the past decade. The area's precipitation is becoming more evenly distributed, indicating a shift in rainfall patterns.
Desert Climate Dynamics
Located in the Sonoran Desert, Altar is characterised by an arid climate, classified under the Köppen system as BWh, indicative of a hot desert climate. The region's geography, with its flat plains and proximity to the Gulf of California, plays a significant role in its climatic conditions. The all-time temperature trends reveal a 0.14°C (0.25°F) rise in highs and a more pronounced 0.71°C (1.28°F) increase in lows, suggesting a warming trend overall. However, the past decade has seen a divergence, with highs cooling by 0.65°C (1.17°F), while lows have warmed by 1.18°C (2.13°F). These trends reflect the complex interplay of regional climate influences, including shifts in atmospheric patterns and potential impacts of climate change.
Temperature Extremes and Records
Altar's temperature records highlight the extremity of its climate. The highest recorded temperature is 48.8°C (119.8°F), while the lowest plummets to -10.0°C (14.0°F). These extremes underscore the significant thermal variability typical of desert environments. The cooling trend in maximum temperatures over the last decade could be indicative of increased cloud cover or changes in solar radiation patterns, while the warming of minimum temperatures aligns with global trends of rising night-time temperatures.
Shifts in Precipitation Patterns
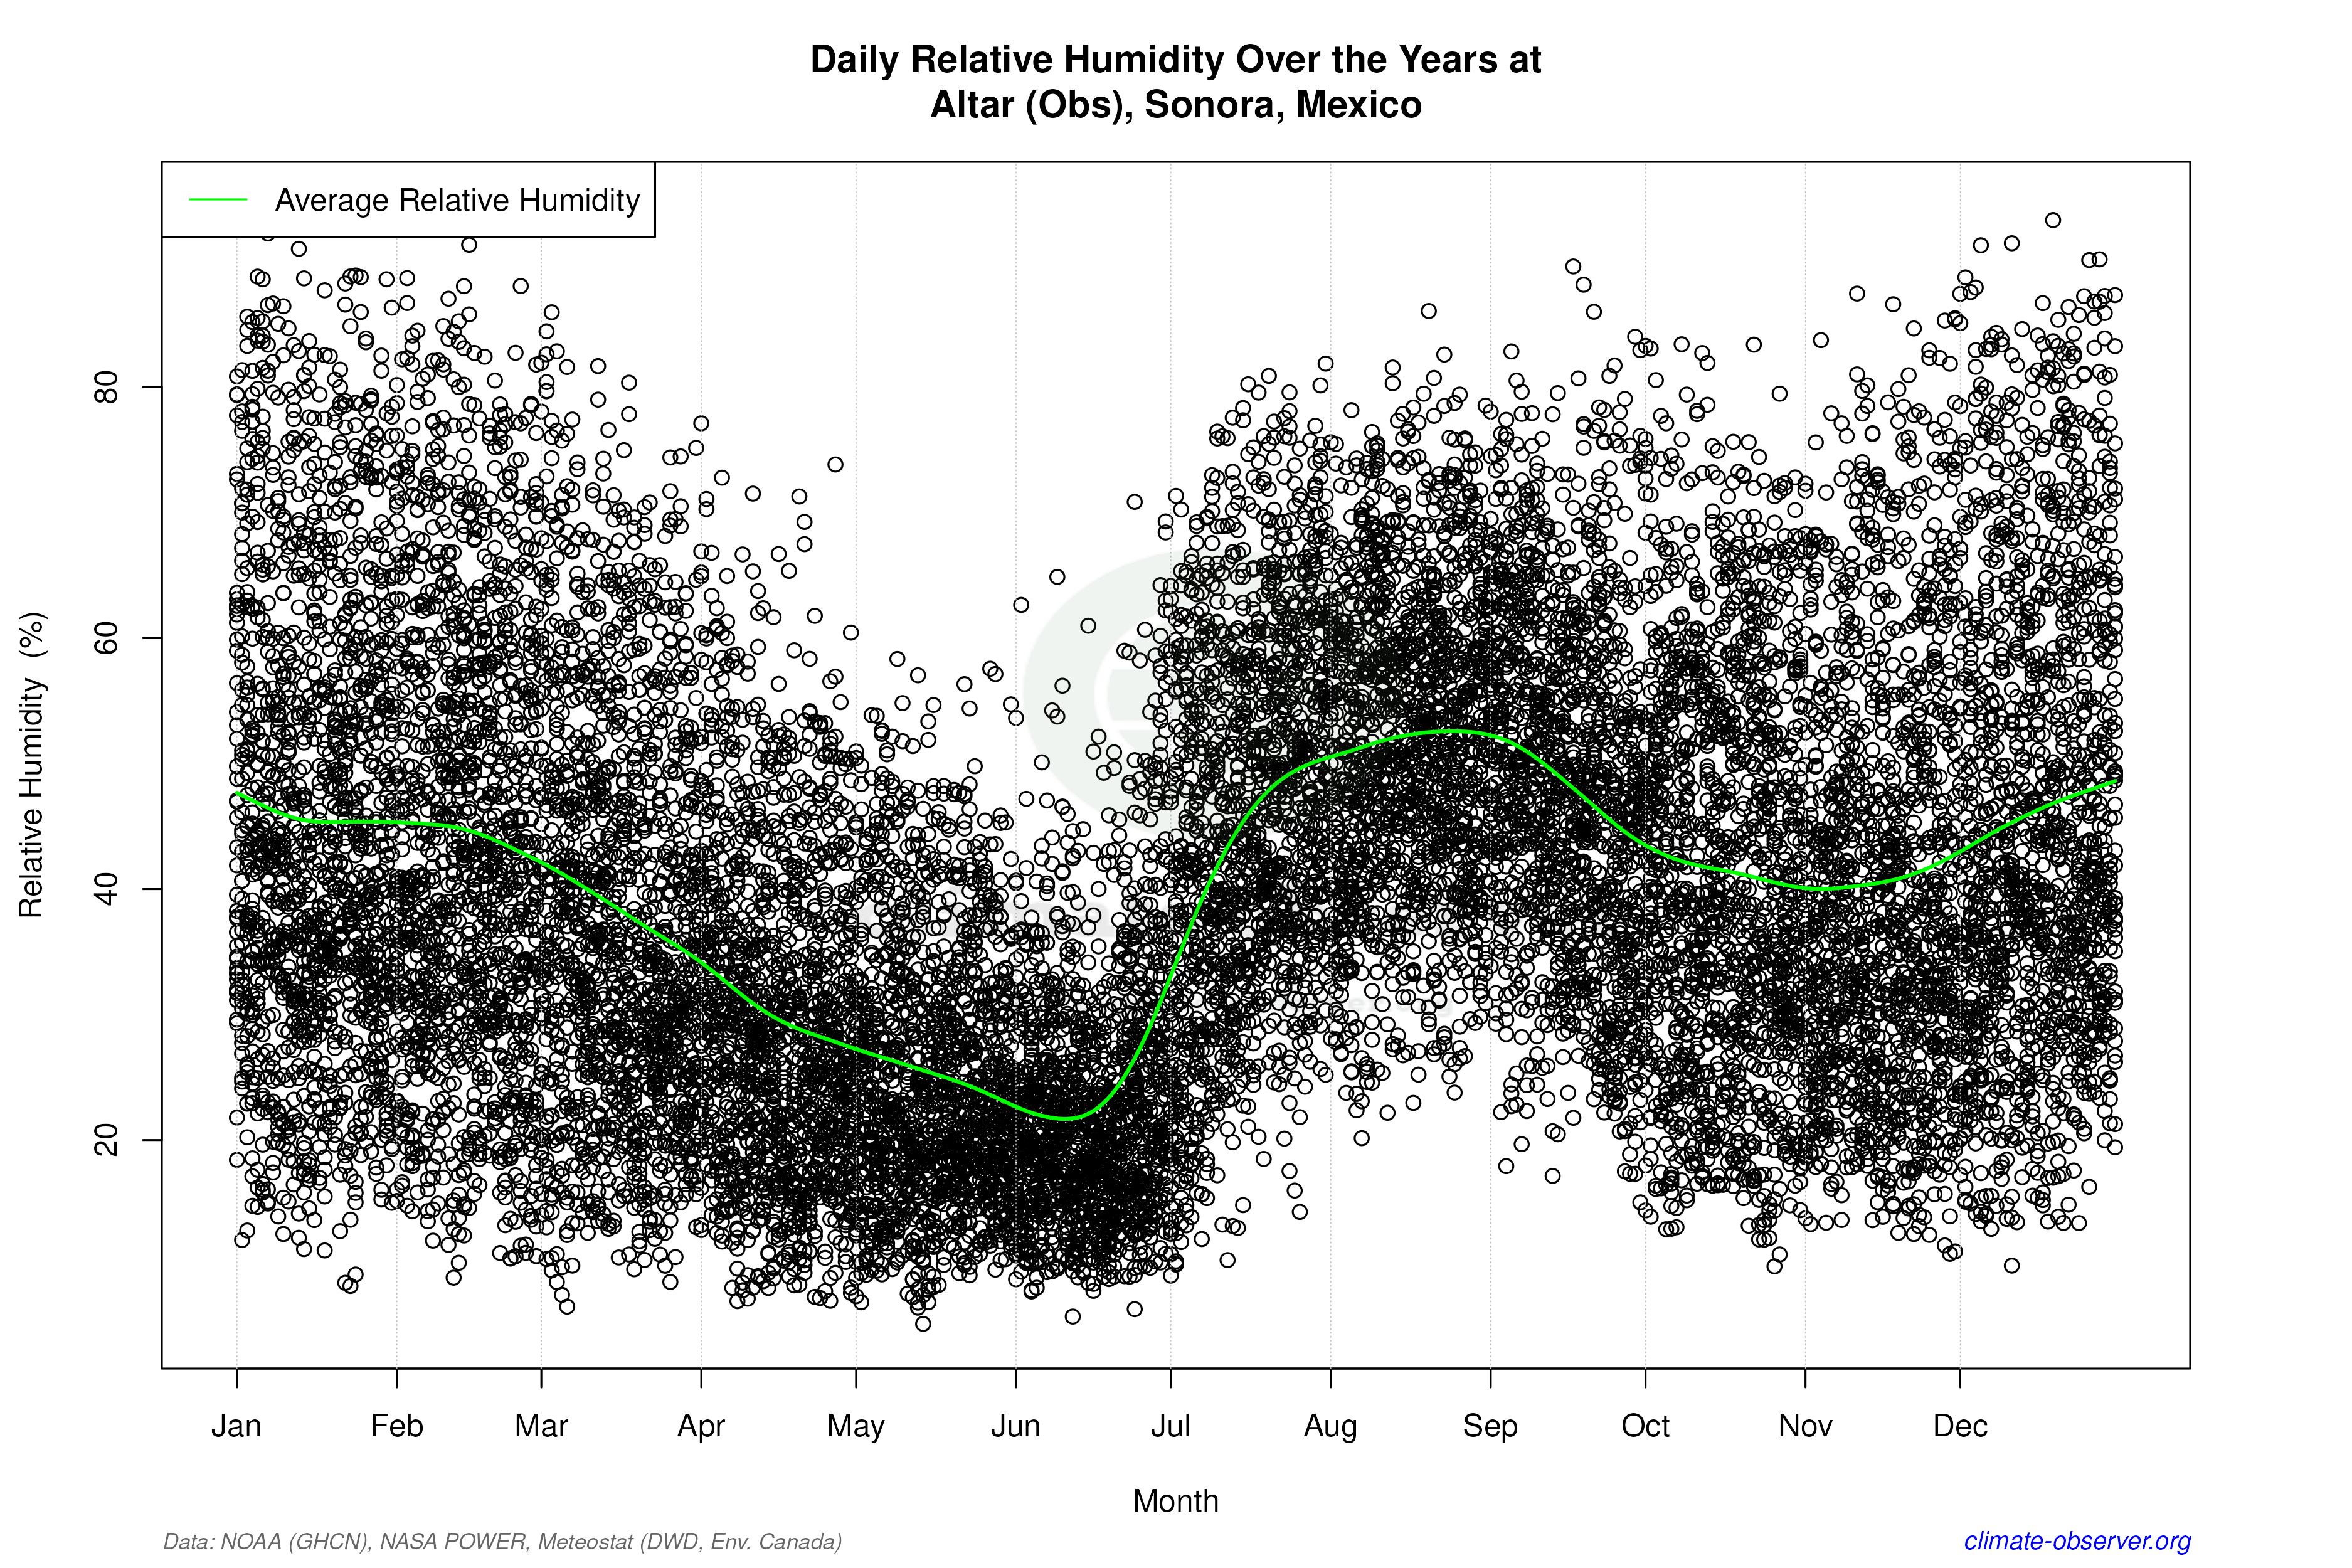
The Precipitation Concentration Index (PCI) for Altar shows a decrease from a baseline of 21.9 to a current value of 17.7, indicating a more even distribution of rainfall throughout the year. This shift suggests that precipitation events are becoming less concentrated, potentially reducing the risk of flash flooding and benefiting agricultural practices. Such changes might be influenced by broader climatic shifts or localised weather phenomena, such as the North American Monsoon, which affects the region's rainfall distribution.
Regional Climate Implications
These climatic trends occur against the backdrop of Mexico's climate goals, which focus on reducing greenhouse gas emissions and enhancing climate resilience. The observed changes in Altar's climate, particularly the warming of night-time temperatures and more evenly distributed precipitation, could have implications for local agriculture and water resource management. Understanding these trends is crucial for developing adaptive strategies to mitigate the impacts of climate variability and change in this desert region.
Station Statistics
10-Year Trend
High: -1.17 °F/decade
Low: +2.94 °F/decade
Rain: -0.005 in/decade
25-Year Trend
High: +0.44 °F/decade
Low: +1.26 °F/decade
Rain: -0.003 in/decade
50-Year Trend
High: +0.40 °F/decade
Low: +1.21 °F/decade
Rain: -0.003 in/decade
All-Time Trend
High: +0.26 °F/decade
Low: +1.31 °F/decade
Rain: -0.003 in/decade
Percentage Above-Average Days
Last 12 Months: 57.5%
This Year: 60.4%
Precipitation Concentration Index (PCI) ℹ️
Last 12 Months: 17.3
Historical Average: 26.1
Percentile Rank of Last 12 Months ℹ️
High: 78th percentile
Low: 99th percentile
Rain: 29th percentile
Change in Variance ℹ️
High: -11.7%
Low: -7.9%
Intraday: -27.5%
Data Coverage
78.7%
First Year of Data
1949
Station Location
Historical Weather Records
| Max High | Avg High | Min High | Max Avg | Avg Avg | Min Avg | Max Low | Avg Low | Min Low | Max Precipitation | Avg Precipitation | Max Snow | Avg Snow | |
|---|---|---|---|---|---|---|---|---|---|---|---|---|---|
| Record | 119.84 °F | — | 41.00 °F | 108.50 °F | — | 31.14 °F | 88.16 °F | — | 14.00 °F | 4.58 in | — | — | — |
| January | 91.40 °F | 71.30 °F | 41.90 °F | 73.76 °F | 55.94 °F | 34.93 °F | 62.06 °F | 40.17 °F | 14.00 °F | 1.53 in | 0.02 in | — | — |
| February | 98.06 °F | 75.09 °F | 41.00 °F | 82.22 °F | 58.86 °F | 31.14 °F | 66.87 °F | 42.48 °F | 19.04 °F | 1.92 in | 0.02 in | — | — |
| March | 107.24 °F | 80.58 °F | 50.00 °F | 87.98 °F | 64.35 °F | 44.24 °F | 74.03 °F | 46.50 °F | 21.02 °F | 2.73 in | 0.01 in | — | — |
| April | 109.04 °F | 87.86 °F | 53.06 °F | 88.70 °F | 70.77 °F | 49.28 °F | 73.94 °F | 51.48 °F | 28.94 °F | 0.69 in | 0.00 in | — | — |
| May | 114.98 °F | 95.58 °F | 66.92 °F | 99.68 °F | 78.30 °F | 55.94 °F | 78.98 °F | 58.71 °F | 35.06 °F | 1.69 in | 0.00 in | — | — |
| June | 119.84 °F | 104.33 °F | 79.88 °F | 103.64 °F | 87.24 °F | 66.67 °F | 87.08 °F | 68.00 °F | 39.02 °F | 0.78 in | 0.01 in | — | — |
| July | 118.04 °F | 104.10 °F | 81.61 °F | 106.70 °F | 88.88 °F | 74.66 °F | 88.16 °F | 75.39 °F | 53.06 °F | 4.58 in | 0.08 in | — | — |
| August | 119.30 °F | 102.35 °F | 78.98 °F | 108.50 °F | 87.73 °F | 72.32 °F | 86.90 °F | 74.41 °F | 53.06 °F | 3.40 in | 0.09 in | — | — |
| September | 114.08 °F | 99.42 °F | 76.51 °F | 106.34 °F | 84.34 °F | 67.46 °F | 85.28 °F | 69.33 °F | 42.80 °F | 2.76 in | 0.04 in | — | — |
| October | 113.00 °F | 91.07 °F | 60.08 °F | 92.84 °F | 74.93 °F | 53.62 °F | 84.92 °F | 58.37 °F | 32.00 °F | 2.93 in | 0.02 in | — | — |
| November | 114.98 °F | 80.12 °F | 51.08 °F | 89.60 °F | 64.12 °F | 43.39 °F | 73.04 °F | 47.66 °F | 24.08 °F | 1.05 in | 0.01 in | — | — |
| December | 104.00 °F | 71.14 °F | 46.04 °F | 81.86 °F | 56.16 °F | 35.13 °F | 66.92 °F | 41.01 °F | 17.06 °F | 2.36 in | 0.03 in | — | — |
Data Visualisations
Remove WatermarksCurrent Year Climate Trends vs Historical


Max Temperature this Year | 1 of 6
Climate 12-Month Moving Averages


Max Temperature 12-Month MA | 1 of 6
Daily Data Points and Averages Throughout the Year
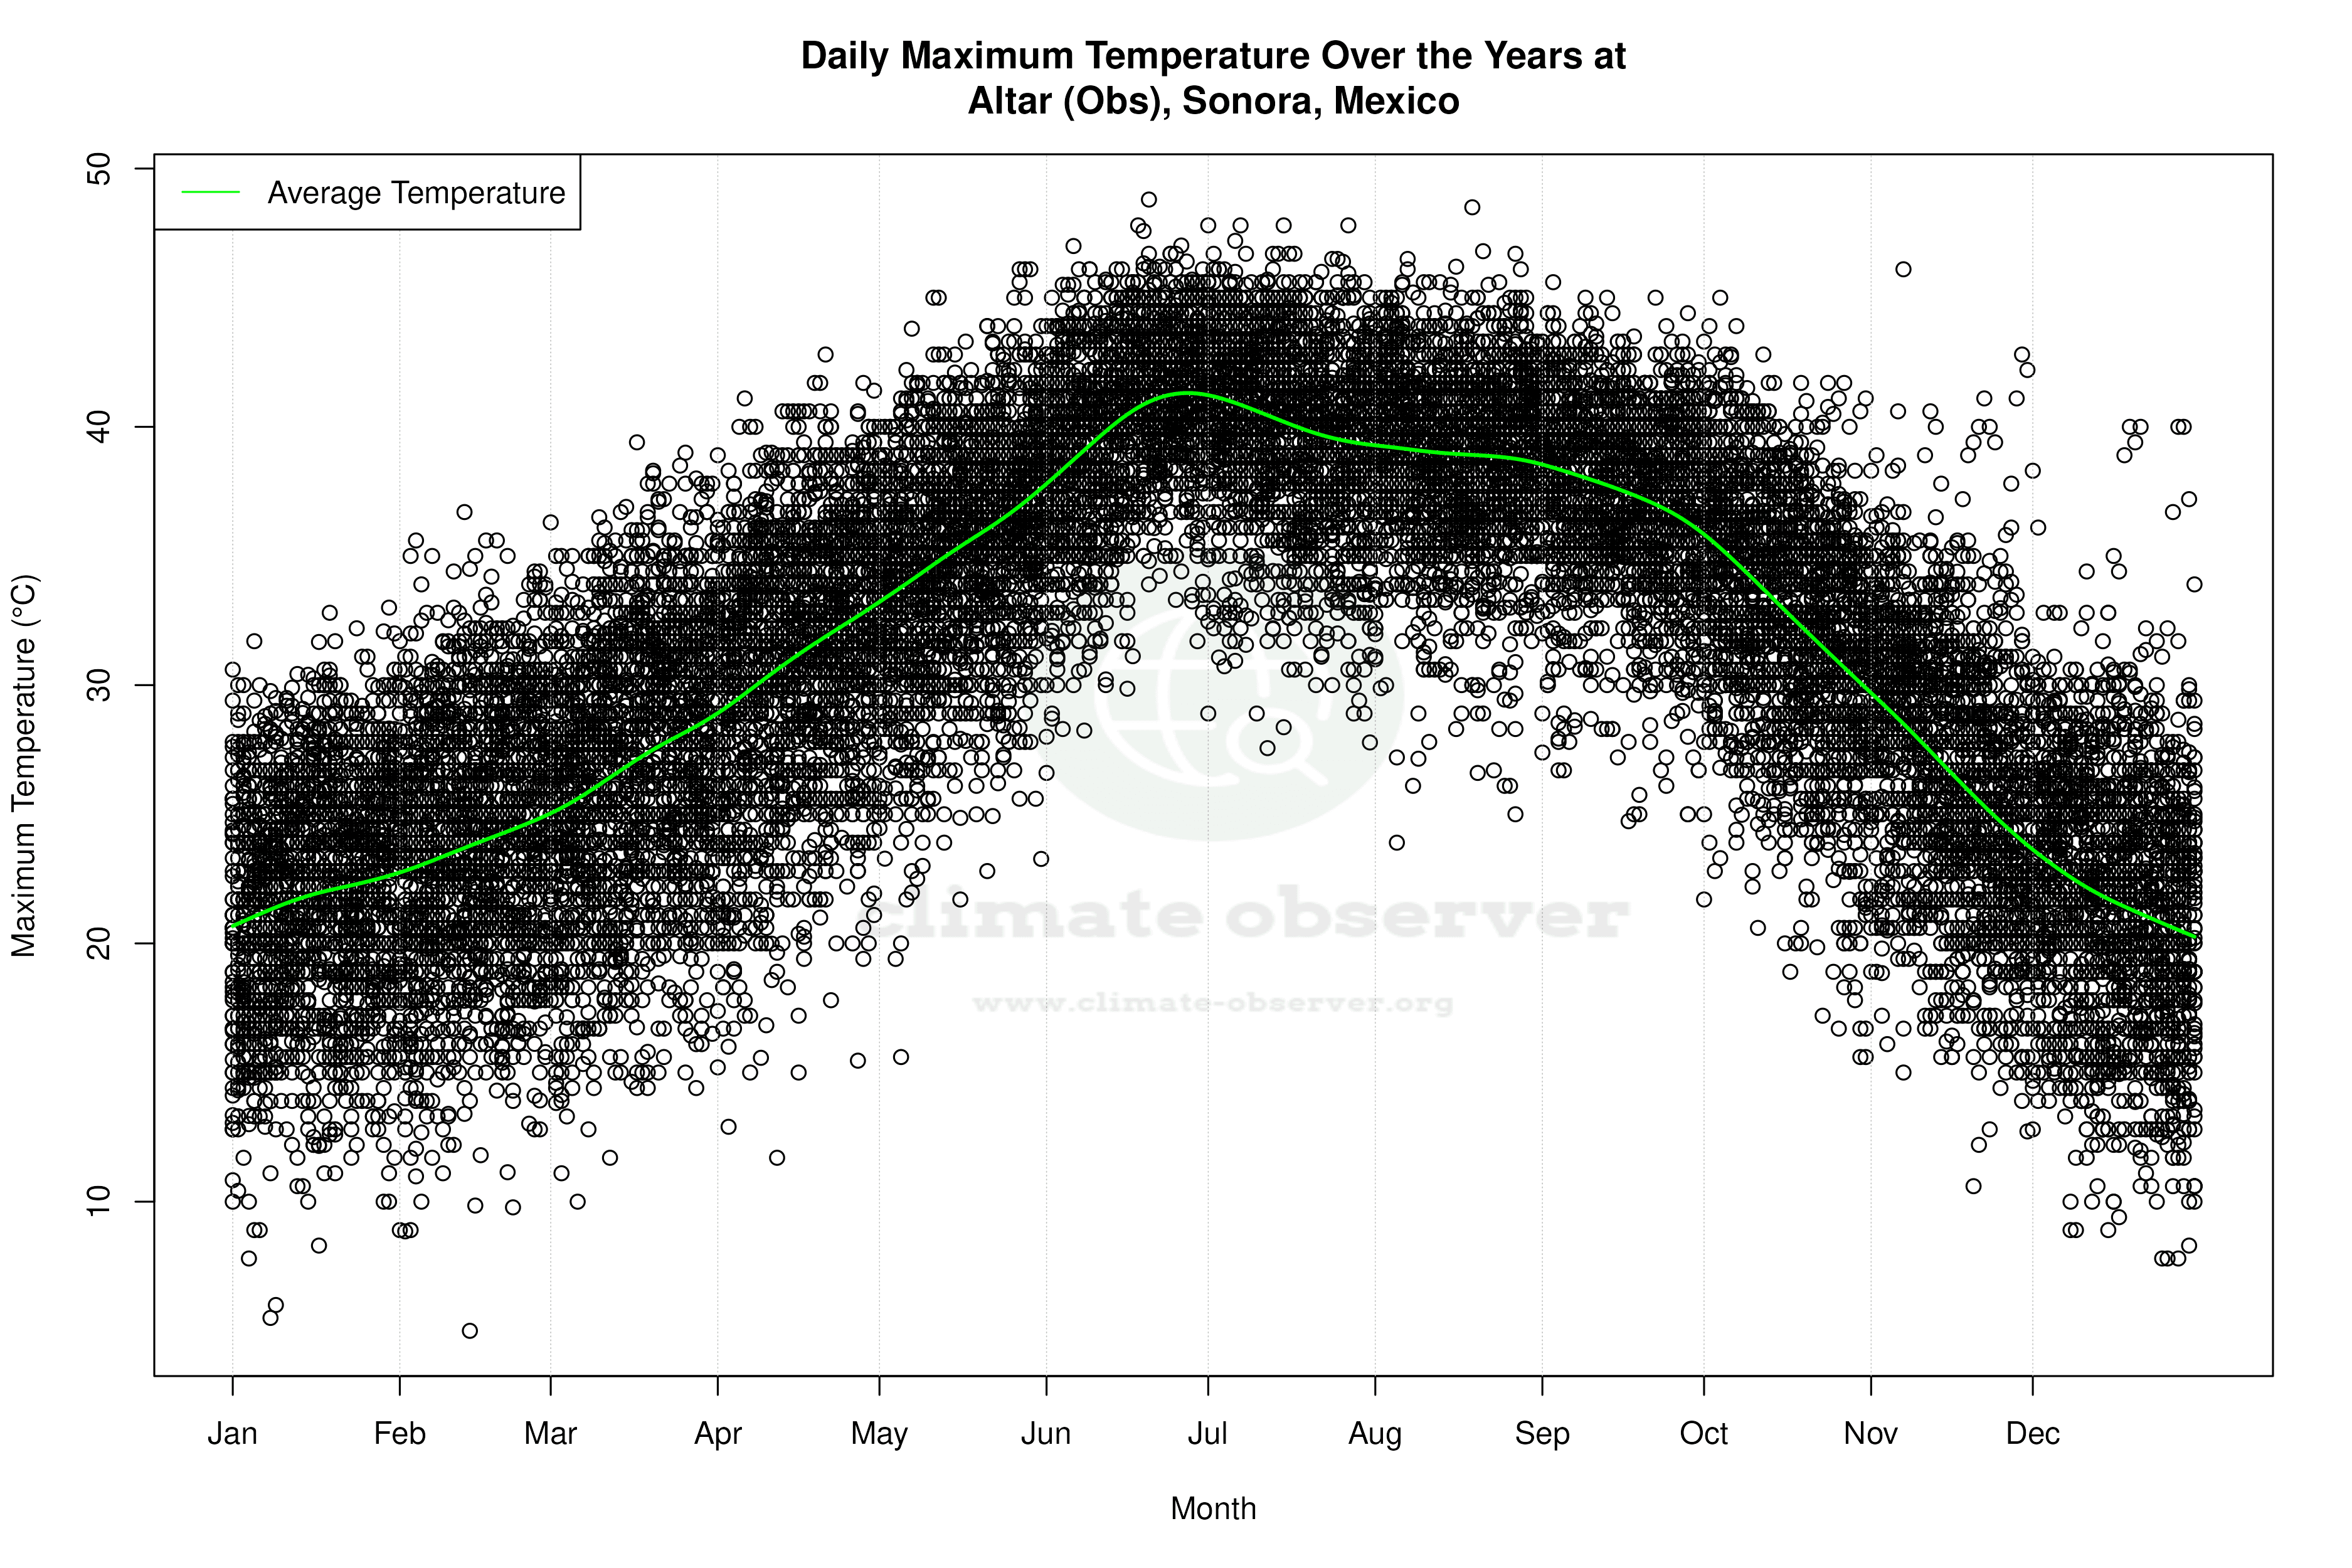


Average Max Temperature Throughout Year | 1 of 5
