Climate for Station: Piedras Negras (Obs), Coahuila, Mexico
Loading live weather...
Climate Analysis & Overview
Piedras Negras is experiencing a complex climate narrative. While historical data shows a general warming trend, recent years have seen a divergence with warming lows and cooling highs. Precipitation patterns are becoming slightly more concentrated, posing challenges for water management.
Desert Climate Dynamics
Piedras Negras, located at 28.7°N, 100.5167°W in Coahuila, Mexico, is characterised by a semi-arid climate (Köppen classification BSh). This region, influenced by its proximity to the Rio Grande and the Chihuahuan Desert, typically experiences hot summers and mild winters. The all-time temperature trends reveal a warming pattern, with highs rising by 0.62°C (1.12°F) and lows increasing by 0.66°C (1.19°F). These changes suggest a general warming climate over the long term.
Recent Temperature Divergence
In the past decade, Piedras Negras has exhibited contrasting temperature trends. While the lows have shown a warming trend of 1.07°C (1.93°F), the highs have surprisingly cooled by 0.36°C (0.65°F). This divergence could be attributed to various factors, including changes in atmospheric circulation patterns or localised weather phenomena. Such a trend may impact local agriculture and energy consumption, as warmer nights can affect crop growth and increase cooling demands.
Precipitation Patterns: A Slight Shift
The Precipitation Concentration Index (PCI) for Piedras Negras has seen a marginal increase from a baseline of 17.67 to a current value of 17.84. This suggests a slight shift towards more concentrated precipitation events, where rainfall occurs in fewer, more intense episodes. While this change is not drastic, it indicates potential challenges for water resource management and flood risk mitigation. A PCI over 20 would signal highly concentrated precipitation, but Piedras Negras remains below this threshold.
Record Extremes: A Tale of Two Extremes
Piedras Negras has experienced significant temperature extremes, with a record high of 48.3°C (118.9°F) and a record low of -10.6°C (12.9°F). These records highlight the region's susceptibility to both intense heat and occasional cold snaps. Such extremes can have profound impacts on local infrastructure, health, and ecosystems, necessitating adaptive measures to mitigate their effects.
Regional Climate Context
In the broader context of Mexico's climate goals, which aim to reduce greenhouse gas emissions and enhance climate resilience, understanding localised climate trends is crucial. Piedras Negras' unique climatic shifts underscore the importance of targeted adaptation strategies to address both warming lows and cooling highs. As Mexico continues to navigate its climate commitments, the insights from Piedras Negras can inform regional strategies to enhance sustainability and resilience.
Station Statistics
10-Year Trend
High: -0.68 °F/decade
Low: +2.26 °F/decade
Rain: +0.020 in/decade
25-Year Trend
High: +0.61 °F/decade
Low: +0.83 °F/decade
Rain: -0.003 in/decade
50-Year Trend
High: +1.02 °F/decade
Low: +0.80 °F/decade
Rain: -0.003 in/decade
All-Time Trend
High: +1.10 °F/decade
Low: +1.19 °F/decade
Rain: -0.007 in/decade
Percentage Above-Average Days
Last 12 Months: 61.4%
This Year: 55.1%
Precipitation Concentration Index (PCI) ℹ️
Last 12 Months: 15.6
Historical Average: 20.6
Percentile Rank of Last 12 Months ℹ️
High: 69th percentile
Low: 97th percentile
Rain: 67th percentile
Change in Variance ℹ️
High: -7.1%
Low: -10.5%
Intraday: -29.0%
Data Coverage
73.1%
First Year of Data
1955
Station Location
Historical Weather Records
| Max High | Avg High | Min High | Max Avg | Avg Avg | Min Avg | Max Low | Avg Low | Min Low | Max Precipitation | Avg Precipitation | Max Snow | Avg Snow | |
|---|---|---|---|---|---|---|---|---|---|---|---|---|---|
| Record | 118.94 °F | — | 30.38 °F | 100.04 °F | — | 22.10 °F | 84.92 °F | — | 12.92 °F | 6.12 in | — | — | — |
| January | 98.96 °F | 67.58 °F | 33.28 °F | 77.18 °F | 54.53 °F | 24.98 °F | 69.08 °F | 40.65 °F | 14.00 °F | 1.00 in | 0.02 in | — | — |
| February | 104.00 °F | 73.35 °F | 30.38 °F | 84.56 °F | 59.68 °F | 23.72 °F | 68.00 °F | 45.26 °F | 14.72 °F | 1.29 in | 0.02 in | — | — |
| March | 104.00 °F | 81.58 °F | 42.08 °F | 87.44 °F | 67.93 °F | 35.06 °F | 72.32 °F | 52.57 °F | 19.04 °F | 1.92 in | 0.02 in | — | — |
| April | 111.56 °F | 88.94 °F | 53.06 °F | 93.20 °F | 75.34 °F | 44.24 °F | 77.72 °F | 59.98 °F | 30.02 °F | 5.05 in | 0.04 in | — | — |
| May | 113.00 °F | 94.02 °F | 57.02 °F | 96.62 °F | 81.53 °F | 59.18 °F | 84.02 °F | 67.91 °F | 35.96 °F | 5.36 in | 0.08 in | — | — |
| June | 118.94 °F | 99.21 °F | 73.94 °F | 99.86 °F | 87.09 °F | 68.72 °F | 82.94 °F | 73.49 °F | 50.72 °F | 6.12 in | 0.05 in | — | — |
| July | 116.06 °F | 100.64 °F | 77.00 °F | 99.50 °F | 88.43 °F | 72.32 °F | 84.92 °F | 75.09 °F | 62.06 °F | 5.60 in | 0.05 in | — | — |
| August | 115.16 °F | 101.22 °F | 78.08 °F | 100.04 °F | 89.08 °F | 73.58 °F | 84.92 °F | 75.66 °F | 59.00 °F | 2.74 in | 0.04 in | — | — |
| September | 114.98 °F | 95.17 °F | 64.45 °F | 98.24 °F | 83.07 °F | 56.30 °F | 82.94 °F | 70.50 °F | 48.02 °F | 3.20 in | 0.08 in | — | — |
| October | 106.16 °F | 86.80 °F | 48.06 °F | 90.50 °F | 74.77 °F | 42.75 °F | 78.08 °F | 60.80 °F | 26.06 °F | 4.42 in | 0.05 in | — | — |
| November | 97.93 °F | 76.09 °F | 37.94 °F | 82.04 °F | 63.98 °F | 38.25 °F | 74.12 °F | 49.89 °F | 19.04 °F | 1.65 in | 0.02 in | — | — |
| December | 93.60 °F | 68.72 °F | 32.22 °F | 78.26 °F | 55.99 °F | 22.10 °F | 66.56 °F | 42.63 °F | 12.92 °F | 2.04 in | 0.02 in | — | — |
Data Visualisations
Remove WatermarksCurrent Year Climate Trends vs Historical


Max Temperature this Year | 1 of 6
Climate 12-Month Moving Averages


Max Temperature 12-Month MA | 1 of 6
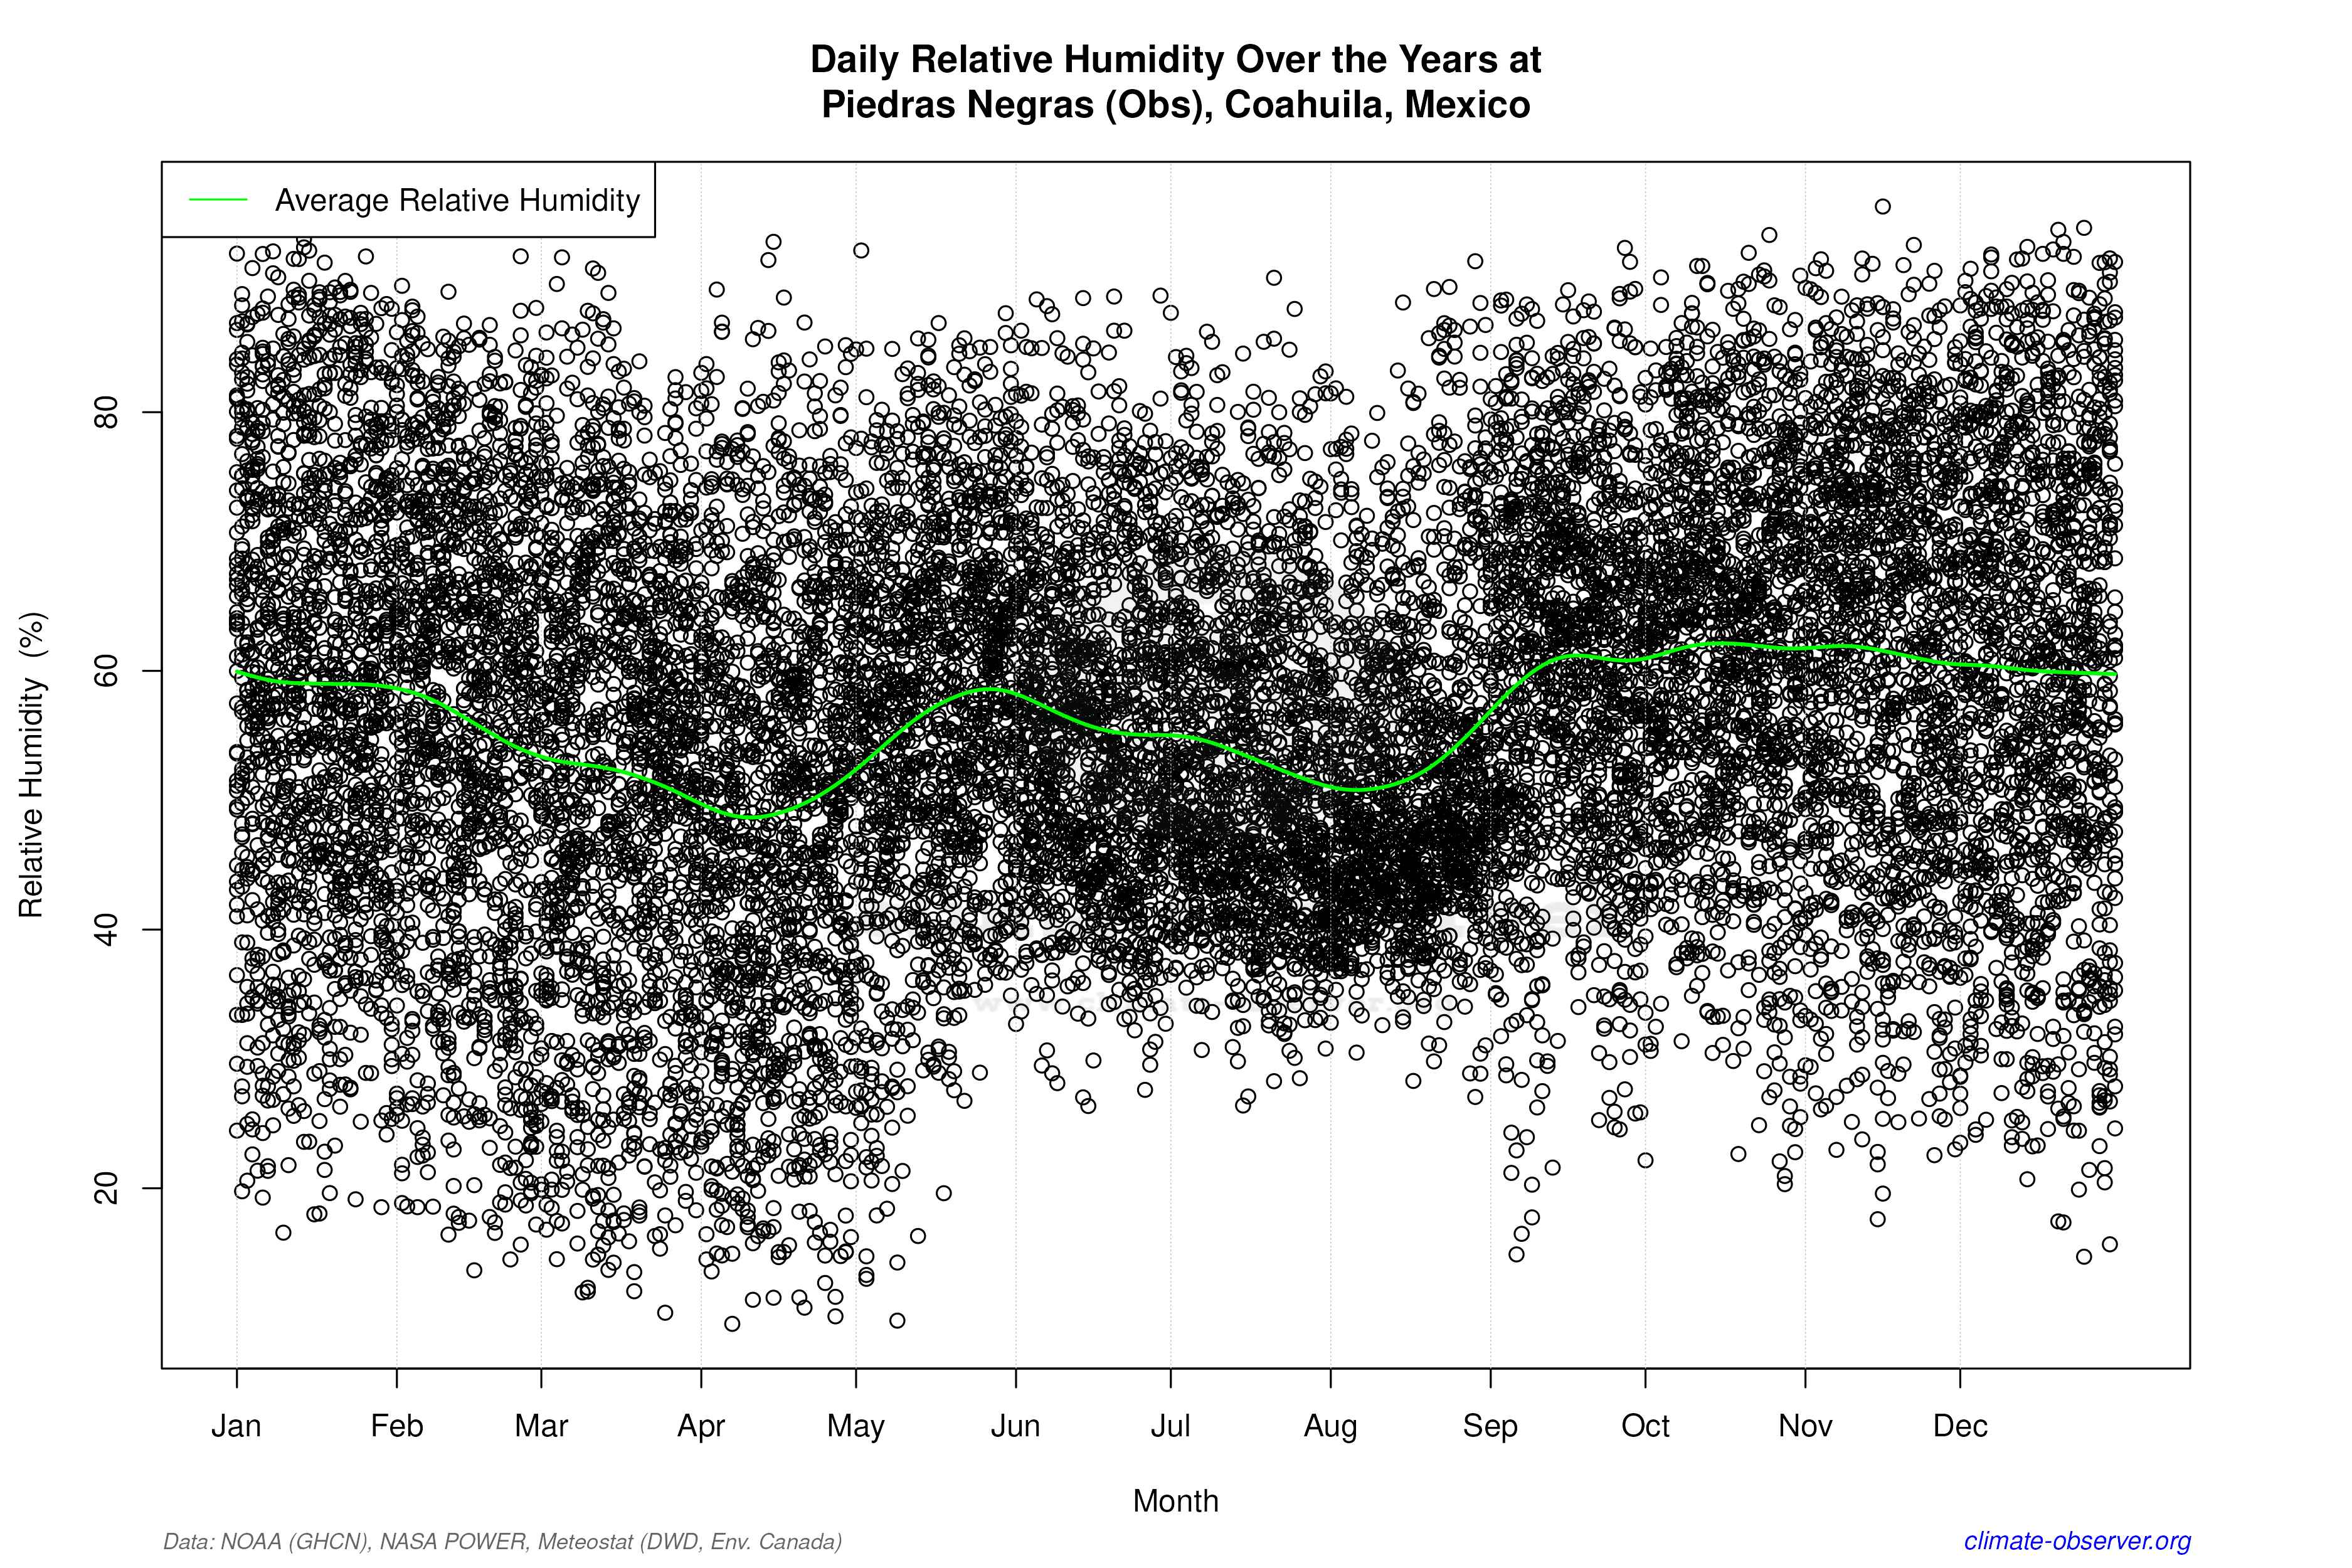
Daily Data Points and Averages Throughout the Year


Average Max Temperature Throughout Year | 1 of 5
