Climate for Station: Acapulco Gro., Guerrero, Mexico
Loading live weather...
Climate Analysis & Overview
Acapulco's climate profile reveals a complex interplay between long-term warming trends and recent cooling in high temperatures. Precipitation patterns have become slightly more evenly distributed, reflecting shifts in regional climate dynamics.
Tropical Coastal Dynamics
Acapulco, located at 16.833°N, -99.933°W, experiences a tropical savanna climate (Köppen classification Aw), characterised by a distinct wet and dry season. The city's coastal geography, bordered by the Pacific Ocean, significantly influences its climate, moderating temperatures and contributing to high humidity levels. The all-time trends indicate a warming of 0.48°C (0.86°F) in high temperatures, suggesting a long-term rise. In contrast, the last decade has seen a cooling of 1.27°C (2.29°F) in highs, indicating recent deviations from the long-term trend.
Nocturnal Temperature Shifts
The low temperatures in Acapulco have shown a consistent warming trend, with a 1.57°C (2.82°F) increase over the past decade. This is more pronounced than the all-time trend, which shows a modest rise of 0.08°C (0.14°F). This suggests that while daytime temperatures have recently cooled, nighttime temperatures continue to climb. This change can impact local ecosystems and energy consumption patterns, as warmer nights may increase demand for cooling.
Precipitation Patterns and Distribution
The Precipitation Concentration Index (PCI) has seen a decrease from a baseline of 21.25 to a current value of 18.50. This indicates that precipitation events have become slightly more evenly distributed throughout the year, reducing the concentration of rainfall in fewer, more intense events. Such a shift can have implications for water resource management and agricultural planning in the region.
Record Extremes and Implications
Acapulco's climate extremes are marked by a record high of 39.6°C (103.3°F) and a record low of 13.0°C (55.4°F). These extremes highlight the city's vulnerability to temperature fluctuations, which can be exacerbated by global climate change. Understanding these records in the context of regional climate goals is crucial for developing adaptive strategies.
Regional Climate Considerations
Mexico's commitment to reducing carbon emissions and enhancing climate resilience is a backdrop to these climatic changes. Recent weather events, such as tropical storms, underscore the importance of integrating climate data into policy and planning. Acapulco's evolving climate profile, with its nuanced trends in temperature and precipitation, provides essential insights for regional adaptation strategies.
Station Statistics
10-Year Trend
High: -2.15 °F/decade
Low: +2.96 °F/decade
Rain: +0.007 in/decade
25-Year Trend
High: +0.74 °F/decade
Low: +1.08 °F/decade
Rain: +0.030 in/decade
50-Year Trend
High: +0.84 °F/decade
Low: +0.17 °F/decade
Rain: +0.011 in/decade
All-Time Trend
High: +0.84 °F/decade
Low: +0.17 °F/decade
Rain: +0.011 in/decade
Percentage Above-Average Days
Last 12 Months: 40.8%
This Year: 5.9%
Precipitation Concentration Index (PCI) ℹ️
Last 12 Months: 17.5
Historical Average: 24.1
Percentile Rank of Last 12 Months ℹ️
High: 57th percentile
Low: 99th percentile
Rain: 75th percentile
Change in Variance ℹ️
High: -37.8%
Low: +45.9%
Intraday: +48.7%
Data Coverage
90.5%
First Year of Data
1973
Station Location
Historical Weather Records
| Max High | Avg High | Min High | Max Avg | Avg Avg | Min Avg | Max Low | Avg Low | Min Low | Max Precipitation | Avg Precipitation | Max Snow | Avg Snow | |
|---|---|---|---|---|---|---|---|---|---|---|---|---|---|
| Record | 103.28 °F | — | 72.93 °F | 94.64 °F | — | 69.80 °F | 82.94 °F | — | 55.40 °F | 15.63 in | — | — | — |
| January | 101.12 °F | 89.05 °F | 78.03 °F | 86.90 °F | 79.29 °F | 70.86 °F | 78.80 °F | 69.31 °F | 60.01 °F | 1.14 in | 0.01 in | — | — |
| February | 98.96 °F | 89.51 °F | 74.30 °F | 87.80 °F | 79.52 °F | 70.93 °F | 79.16 °F | 69.25 °F | 55.40 °F | 0.88 in | 0.00 in | — | — |
| March | 101.84 °F | 89.99 °F | 72.93 °F | 88.52 °F | 79.98 °F | 69.80 °F | 77.00 °F | 69.15 °F | 55.40 °F | 0.35 in | 0.00 in | — | — |
| April | 102.92 °F | 90.72 °F | 80.60 °F | 90.14 °F | 81.02 °F | 72.14 °F | 81.32 °F | 70.73 °F | 59.00 °F | 2.24 in | 0.00 in | — | — |
| May | 102.20 °F | 91.82 °F | 78.84 °F | 93.56 °F | 83.14 °F | 71.06 °F | 82.94 °F | 73.67 °F | 60.80 °F | 3.24 in | 0.02 in | — | — |
| June | 100.40 °F | 90.59 °F | 76.15 °F | 93.38 °F | 83.53 °F | 73.80 °F | 82.40 °F | 75.38 °F | 64.04 °F | 7.97 in | 0.30 in | — | — |
| July | 103.28 °F | 90.62 °F | 74.59 °F | 94.64 °F | 83.69 °F | 73.26 °F | 82.40 °F | 75.36 °F | 64.04 °F | 5.83 in | 0.25 in | — | — |
| August | 102.56 °F | 90.11 °F | 75.94 °F | 92.12 °F | 83.39 °F | 74.25 °F | 82.40 °F | 75.26 °F | 64.04 °F | 7.52 in | 0.31 in | — | — |
| September | 102.92 °F | 88.81 °F | 74.93 °F | 91.04 °F | 82.34 °F | 73.08 °F | 82.40 °F | 74.92 °F | 63.68 °F | 15.63 in | 0.38 in | — | — |
| October | 101.84 °F | 89.08 °F | 75.42 °F | 89.96 °F | 82.44 °F | 72.55 °F | 80.60 °F | 74.93 °F | 64.51 °F | 5.98 in | 0.19 in | — | — |
| November | 102.20 °F | 89.52 °F | 75.61 °F | 88.34 °F | 81.47 °F | 72.46 °F | 80.60 °F | 73.15 °F | 61.47 °F | 2.52 in | 0.01 in | — | — |
| December | 97.34 °F | 89.14 °F | 75.58 °F | 87.98 °F | 79.80 °F | 71.20 °F | 80.60 °F | 70.56 °F | 58.64 °F | 0.39 in | 0.00 in | — | — |
Data Visualisations
Remove WatermarksCurrent Year Climate Trends vs Historical


Max Temperature this Year | 1 of 6
Climate 12-Month Moving Averages


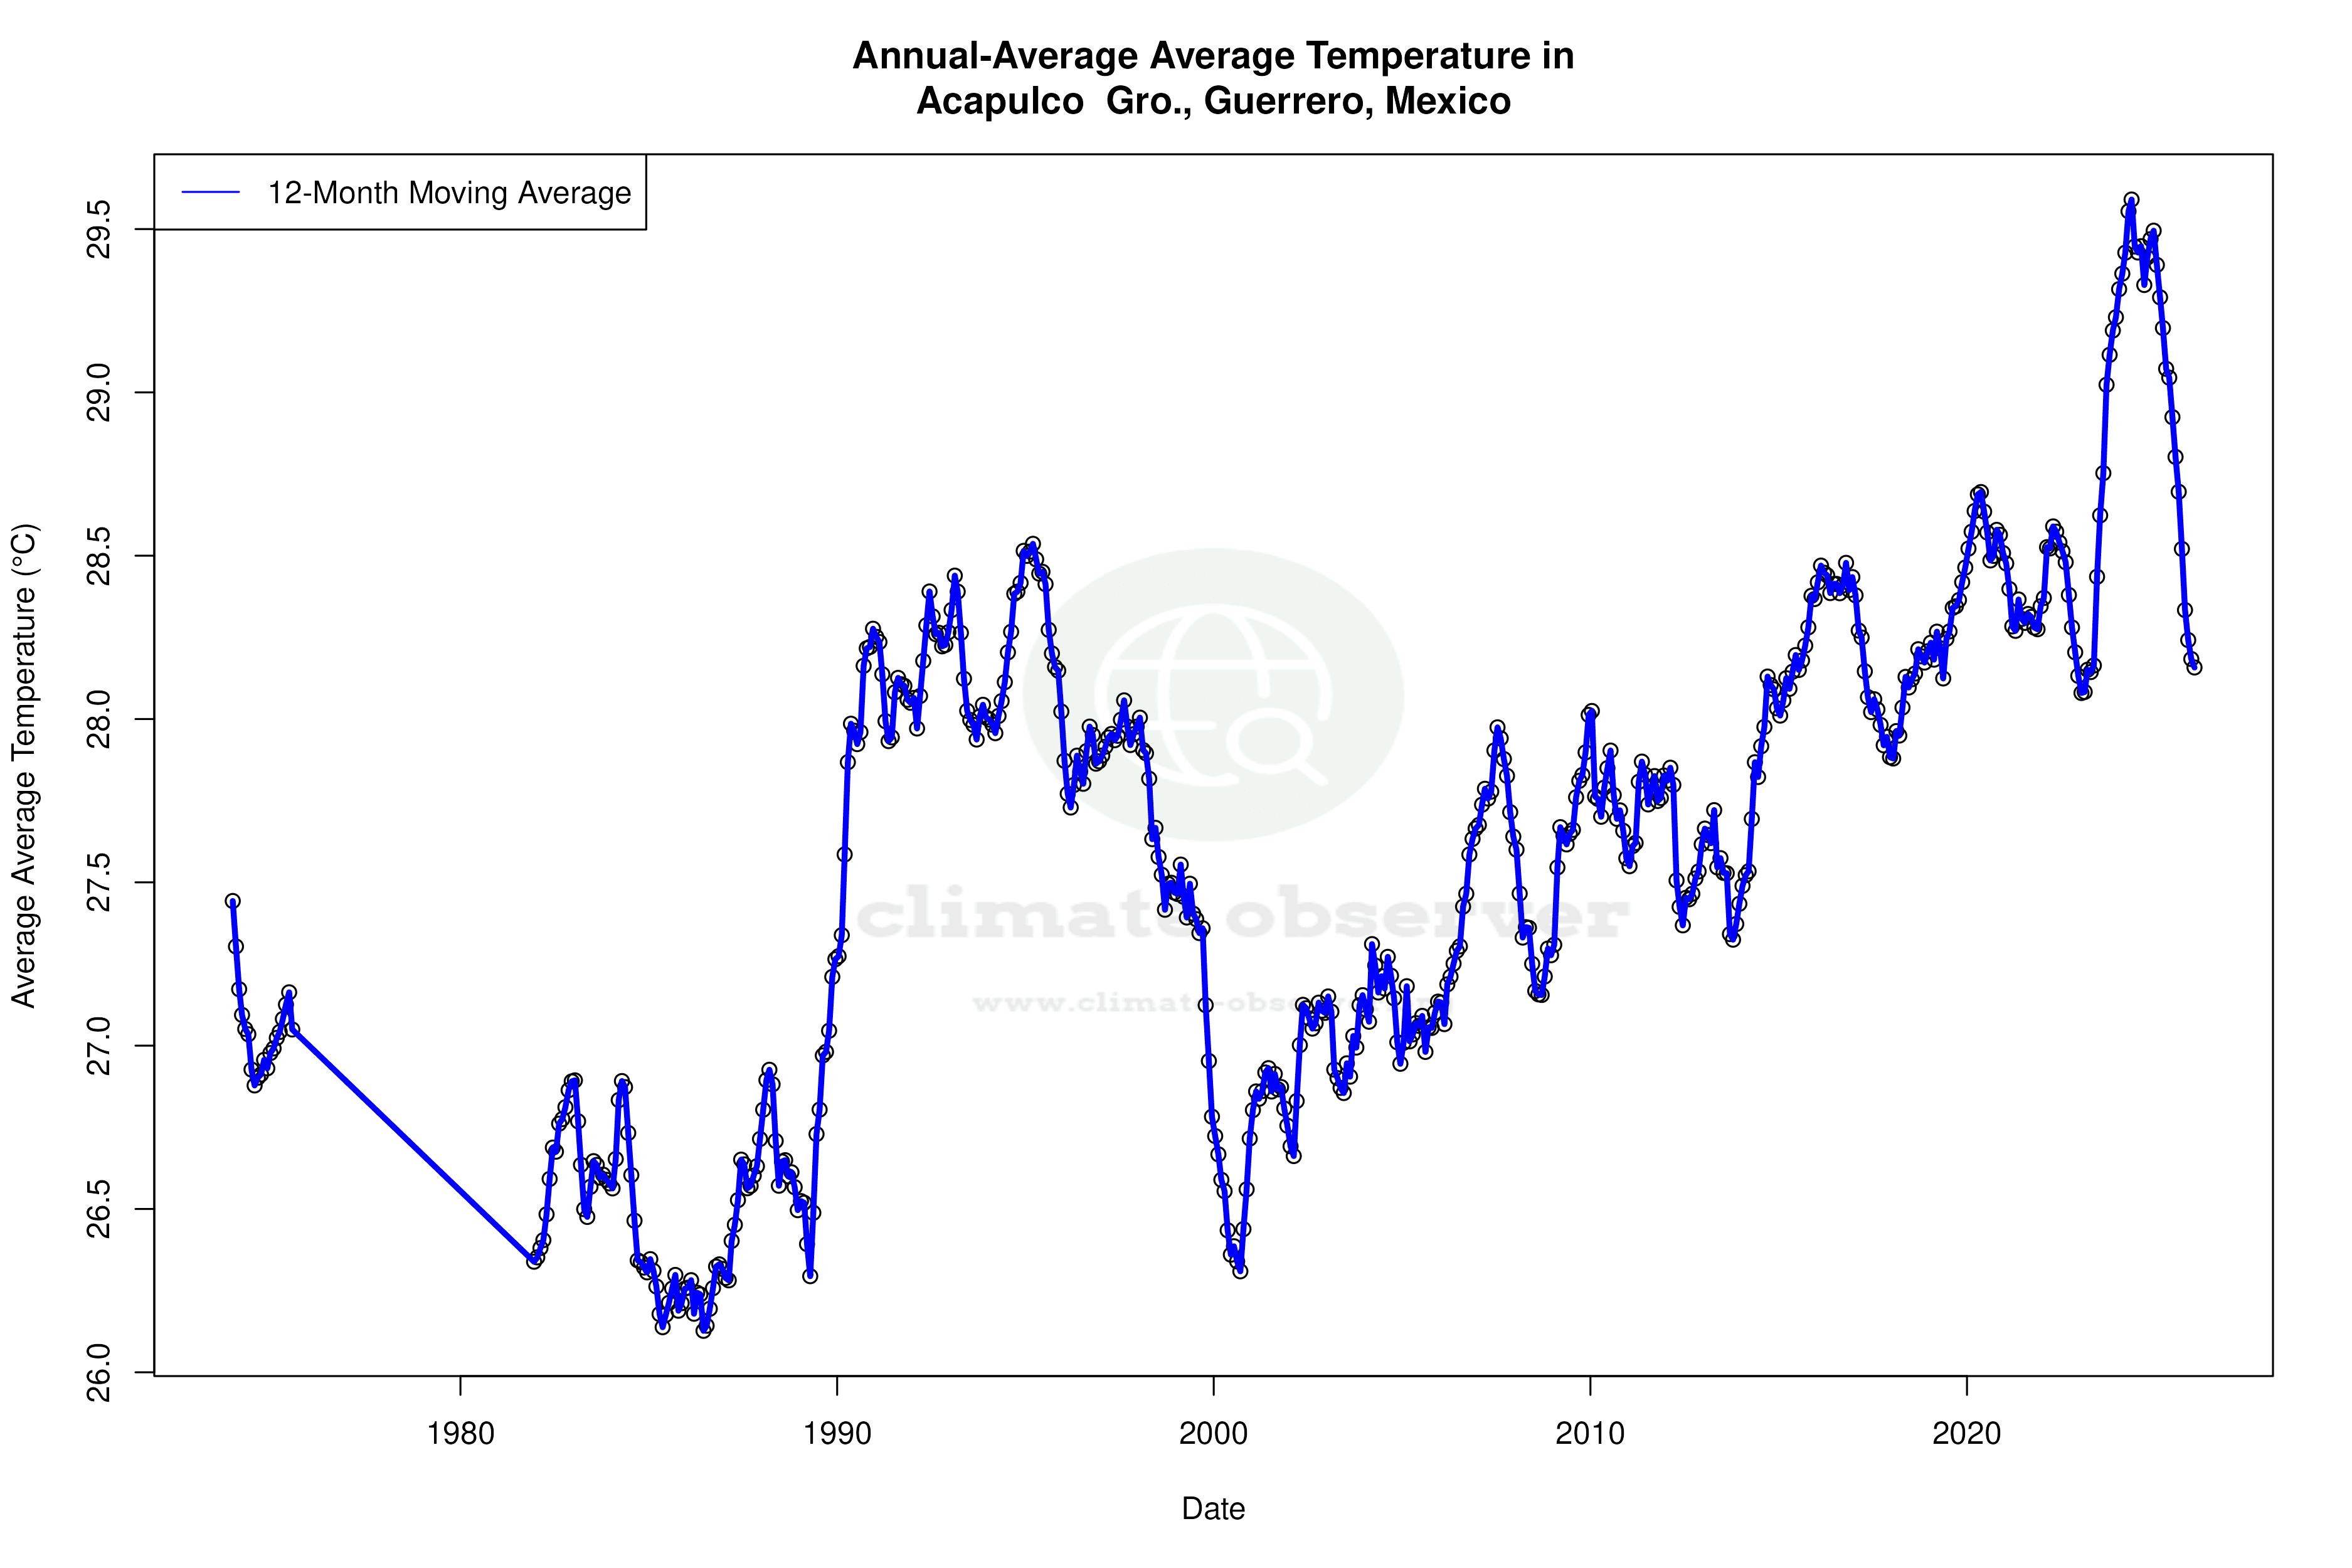


Max Temperature 12-Month MA | 1 of 6
Daily Data Points and Averages Throughout the Year


Average Max Temperature Throughout Year | 1 of 5
