Climate for Station: Sandakan, Sabah, Malaysia
Loading live weather...
Climate Analysis & Overview
Sandakan, located in Malaysia's Sabah region, is experiencing a nuanced climate shift. While the all-time trend indicates a slight warming, the recent decade shows a cooling in high temperatures. Precipitation is becoming more evenly distributed, aligning with regional climate goals for sustainable water management.
Tropical Climate Dynamics
Sandakan, situated in the tropical rainforest climate zone (Af) according to the Köppen classification, is influenced by its proximity to the Sulu Sea and the surrounding lush forests. This geographical setting contributes to consistently high humidity and significant annual rainfall. The all-time temperature trends reveal a slight warming, with highs showing a rise of 0.08°C (0.14°F) and lows a more pronounced increase of 0.36°C (0.65°F). This warming pattern aligns with broader global climate trends but is moderated by the region's dense vegetation and coastal breezes.
Decadal Cooling Anomaly
Interestingly, the past decade has exhibited a cooling trend in high temperatures, with a decrease of 0.42°C (0.76°F). This anomaly contrasts with the all-time warming trend and suggests short-term variability possibly influenced by localised weather patterns or regional climate initiatives aimed at reducing heat. Conversely, the lows have increased by 0.21°C (0.38°F) over the same period, indicating a complex interplay of factors affecting nocturnal temperatures.
Precipitation Patterns and PCI Insights
The Precipitation Concentration Index (PCI) for Sandakan has decreased from a baseline of 11.6 to a current value of 8.8, reflecting a more even distribution of rainfall throughout the year. This shift towards less concentrated precipitation events is significant, suggesting improvements in water resource management and reduced risk of flooding. Such changes are crucial for agriculture and water supply sustainability in the region.
Temperature Extremes
Sandakan experiences notable temperature extremes, with recorded highs reaching 36.5°C (97.7°F) and lows dropping to 18.3°C (64.9°F). These values illustrate the potential for significant thermal variation, although the overall climate remains warm and humid. The moderation of extremes is likely supported by the area's geographical characteristics, which buffer against more severe temperature swings.
Aligning with Regional Climate Goals
Malaysia's commitment to sustainable climate practices is evident in Sandakan's evolving climate profile. The observed trends, particularly the more even precipitation distribution, align with national efforts to enhance climate resilience and adapt to changing environmental conditions. These initiatives are vital for maintaining biodiversity and supporting the livelihoods of communities dependent on the region's natural resources.
Station Statistics
10-Year Trend
High: -0.76 °F/decade
Low: +0.62 °F/decade
Rain: -0.067 in/decade
25-Year Trend
High: -0.07 °F/decade
Low: +0.41 °F/decade
Rain: -0.017 in/decade
50-Year Trend
High: +0.08 °F/decade
Low: +0.55 °F/decade
Rain: -0.003 in/decade
All-Time Trend
High: +0.13 °F/decade
Low: +0.65 °F/decade
Rain: +0.016 in/decade
Percentage Above-Average Days
Last 12 Months: 28.5%
This Year: 18.8%
Precipitation Concentration Index (PCI) ℹ️
Last 12 Months: 10.0
Historical Average: 11.9
Percentile Rank of Last 12 Months ℹ️
High: 44th percentile
Low: 95th percentile
Rain: 46th percentile
Change in Variance ℹ️
High: +1.5%
Low: -27.9%
Intraday: -6.5%
Data Coverage
93.1%
First Year of Data
1955
Station Location
Historical Weather Records
| Max High | Avg High | Min High | Max Avg | Avg Avg | Min Avg | Max Low | Avg Low | Min Low | Max Precipitation | Avg Precipitation | Max Snow | Avg Snow | |
|---|---|---|---|---|---|---|---|---|---|---|---|---|---|
| Record | 97.70 °F | — | 75.92 °F | 90.32 °F | — | 73.04 °F | 83.39 °F | — | 64.94 °F | 13.03 in | — | — | — |
| January | 93.92 °F | 84.90 °F | 75.92 °F | 90.32 °F | 79.99 °F | 73.22 °F | 83.12 °F | 74.88 °F | 64.94 °F | 11.72 in | 0.52 in | — | — |
| February | 93.38 °F | 85.43 °F | 77.00 °F | 86.36 °F | 80.35 °F | 73.58 °F | 80.60 °F | 74.87 °F | 66.92 °F | 13.03 in | 0.36 in | — | — |
| March | 93.20 °F | 87.12 °F | 79.23 °F | 86.36 °F | 81.36 °F | 74.48 °F | 82.40 °F | 75.20 °F | 68.00 °F | 6.69 in | 0.23 in | — | — |
| April | 95.54 °F | 88.92 °F | 80.47 °F | 88.88 °F | 82.53 °F | 75.02 °F | 82.40 °F | 75.69 °F | 69.98 °F | 4.53 in | 0.16 in | — | — |
| May | 97.70 °F | 90.48 °F | 80.06 °F | 87.44 °F | 82.91 °F | 76.46 °F | 83.39 °F | 75.90 °F | 69.98 °F | 4.25 in | 0.18 in | — | — |
| June | 96.44 °F | 90.27 °F | 78.80 °F | 88.34 °F | 82.24 °F | 75.92 °F | 81.68 °F | 75.14 °F | 69.08 °F | 6.65 in | 0.25 in | — | — |
| July | 96.80 °F | 90.14 °F | 80.06 °F | 88.16 °F | 81.81 °F | 75.20 °F | 81.09 °F | 74.65 °F | 68.36 °F | 4.76 in | 0.26 in | — | — |
| August | 96.80 °F | 90.41 °F | 78.98 °F | 87.62 °F | 81.90 °F | 75.74 °F | 81.07 °F | 74.60 °F | 66.92 °F | 5.47 in | 0.28 in | — | — |
| September | 95.90 °F | 89.91 °F | 78.98 °F | 86.90 °F | 81.62 °F | 75.20 °F | 80.60 °F | 74.54 °F | 69.08 °F | 7.87 in | 0.32 in | — | — |
| October | 95.90 °F | 88.90 °F | 80.06 °F | 86.54 °F | 81.39 °F | 75.02 °F | 81.39 °F | 74.77 °F | 69.08 °F | 8.28 in | 0.36 in | — | — |
| November | 95.00 °F | 87.41 °F | 78.26 °F | 85.64 °F | 80.99 °F | 73.04 °F | 81.68 °F | 74.88 °F | 68.00 °F | 6.89 in | 0.41 in | — | — |
| December | 93.56 °F | 85.99 °F | 75.92 °F | 88.16 °F | 80.39 °F | 73.58 °F | 82.40 °F | 74.96 °F | 68.18 °F | 8.78 in | 0.51 in | — | — |
Data Visualisations
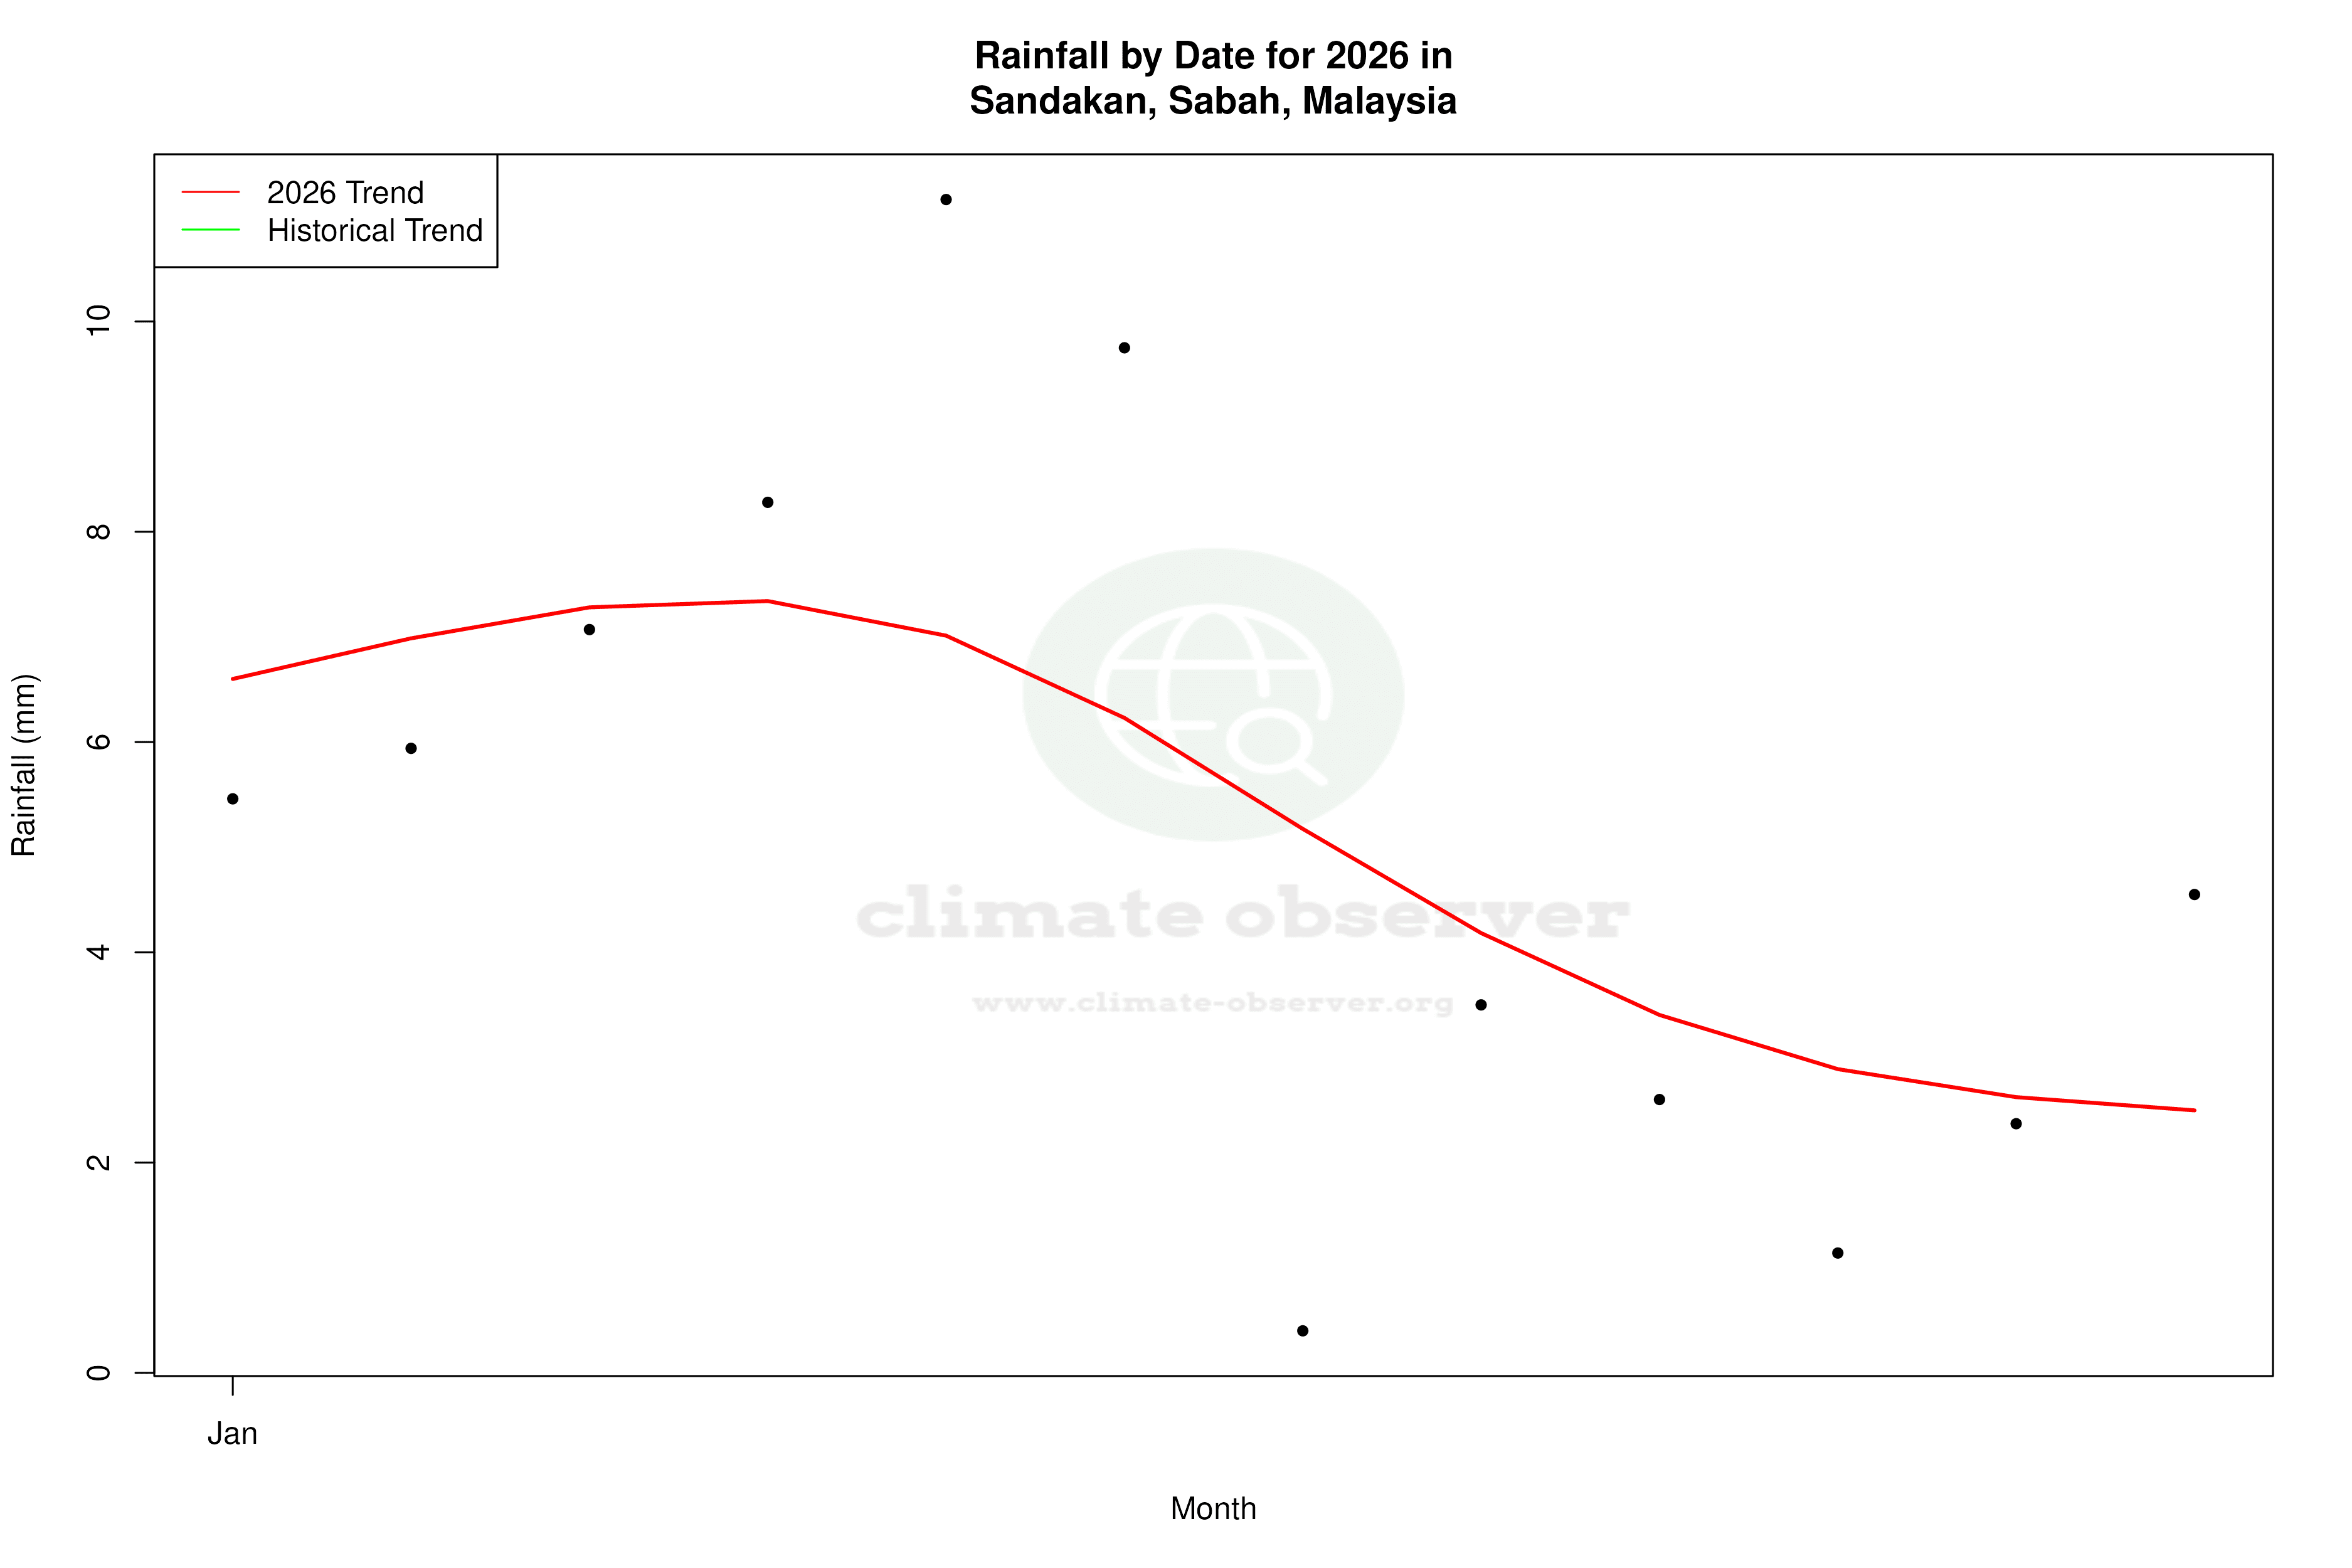
Remove WatermarksCurrent Year Climate Trends vs Historical
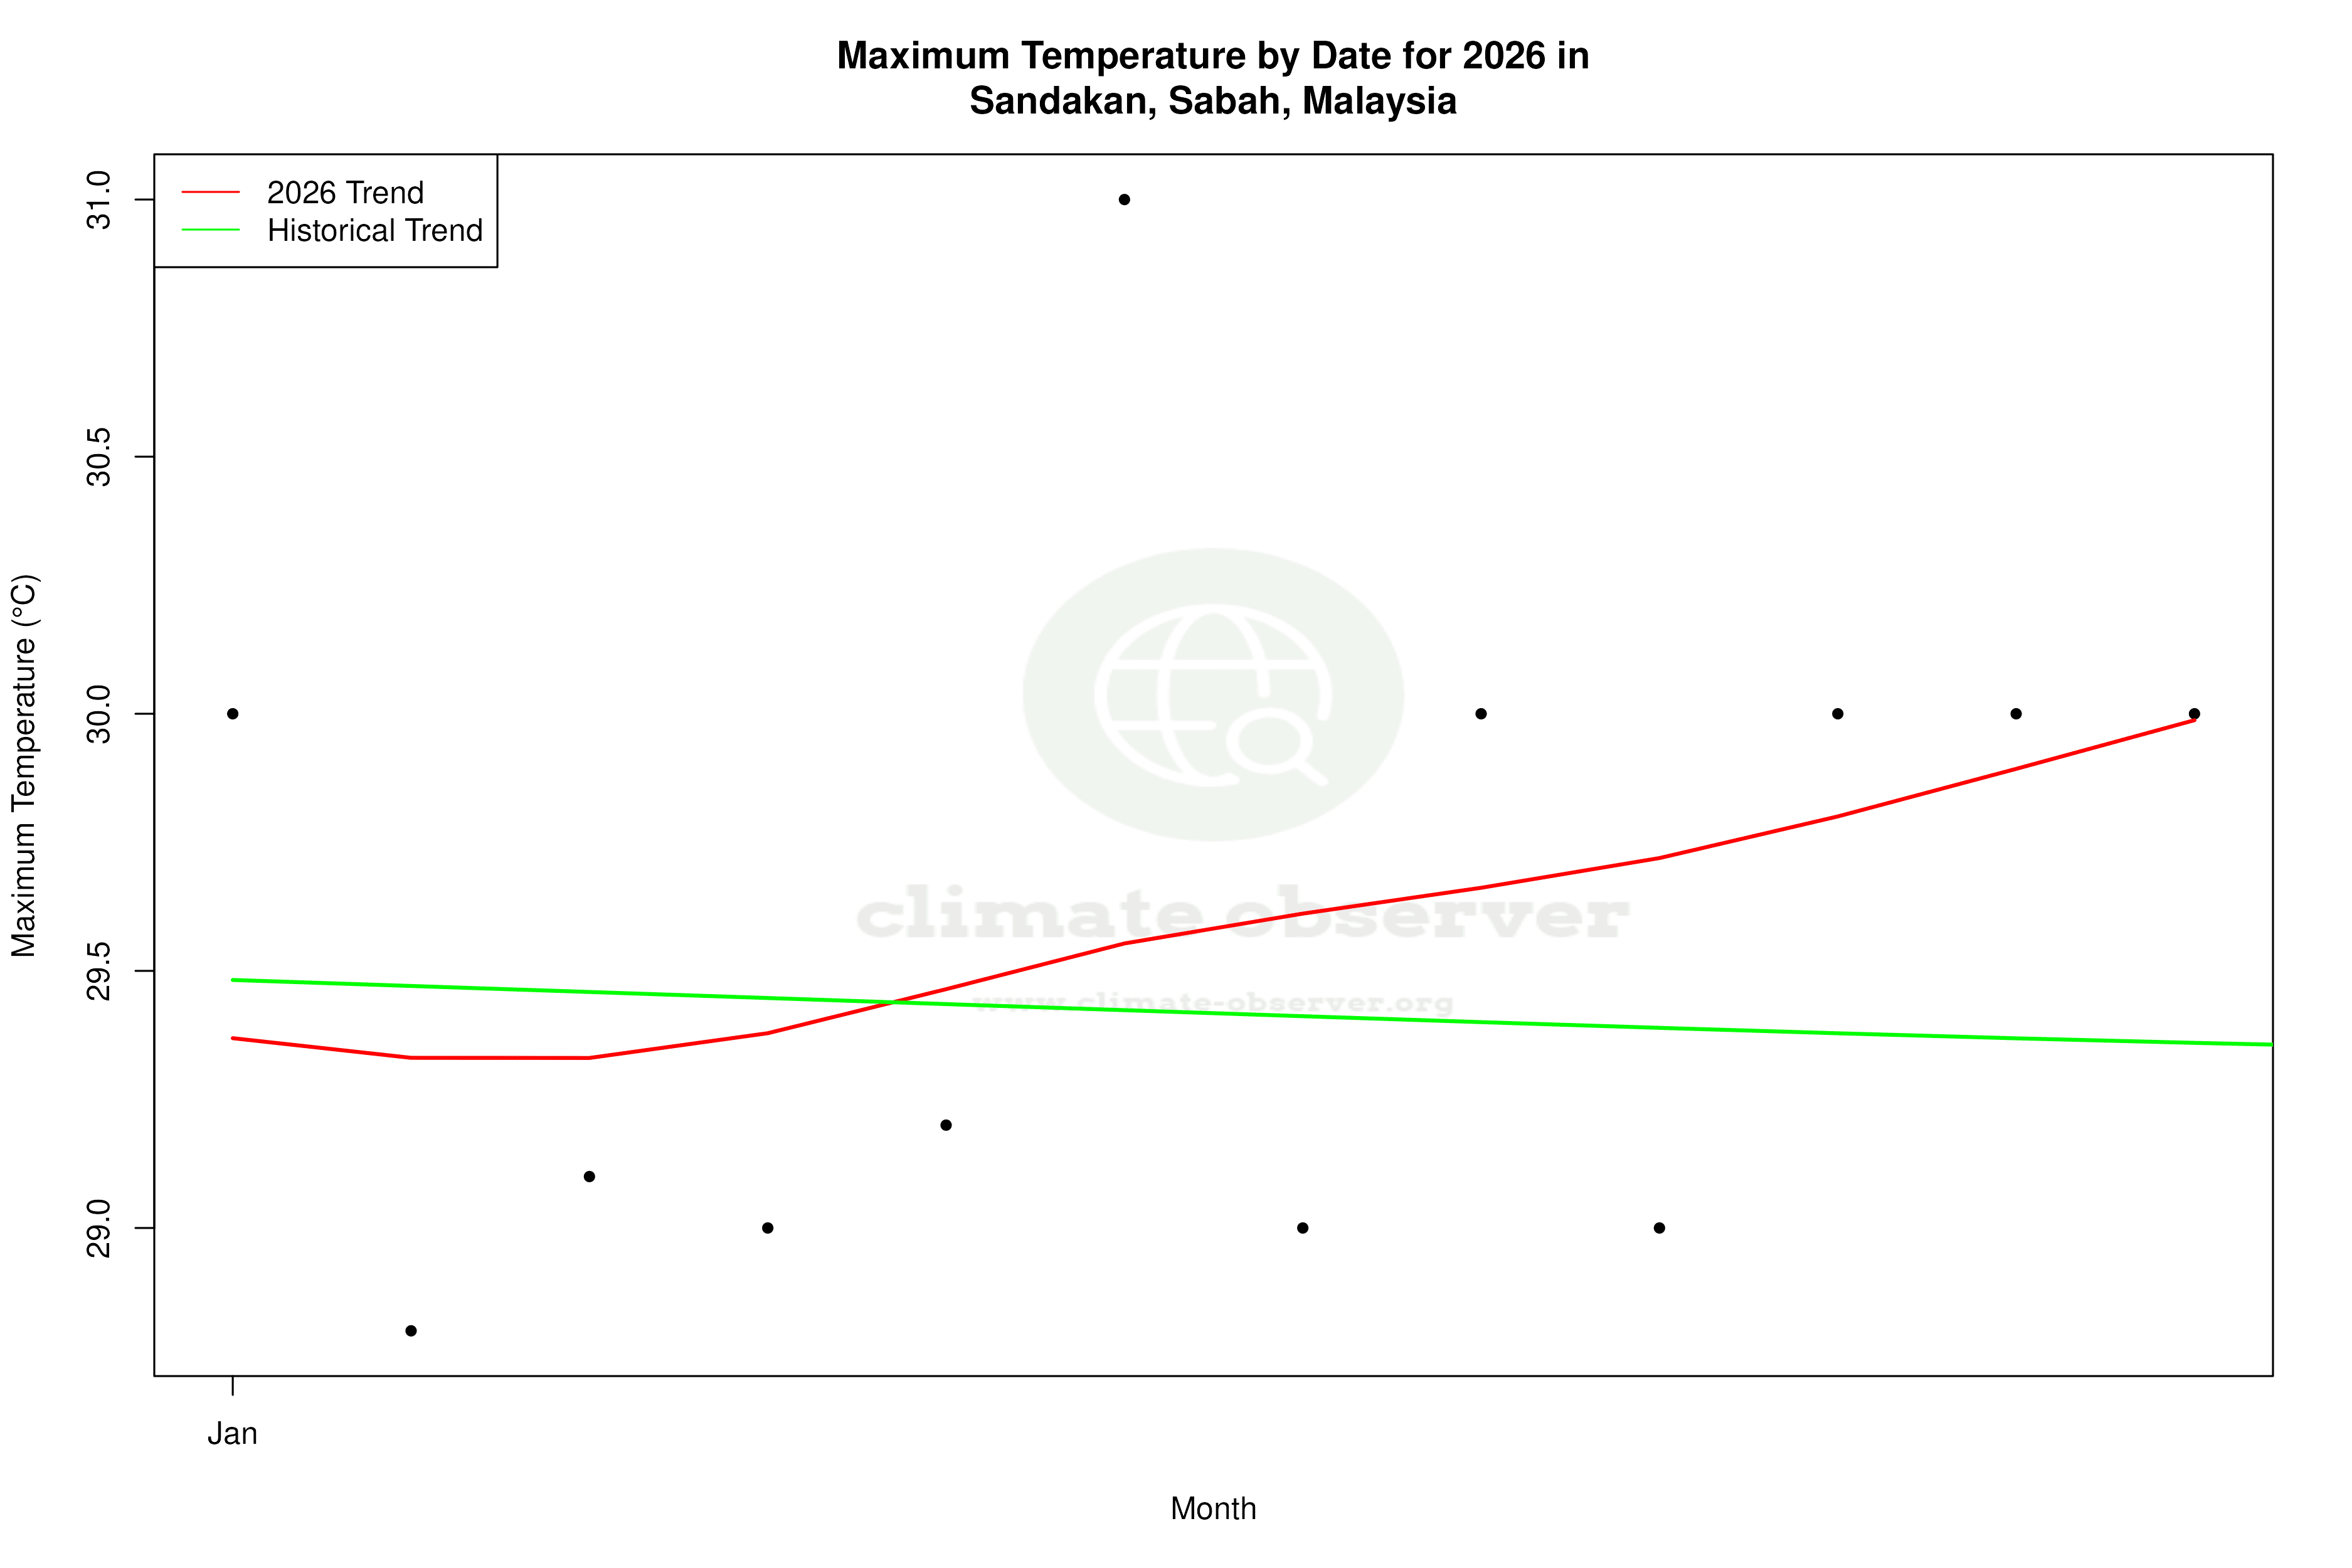


Max Temperature this Year | 1 of 6
Climate 12-Month Moving Averages


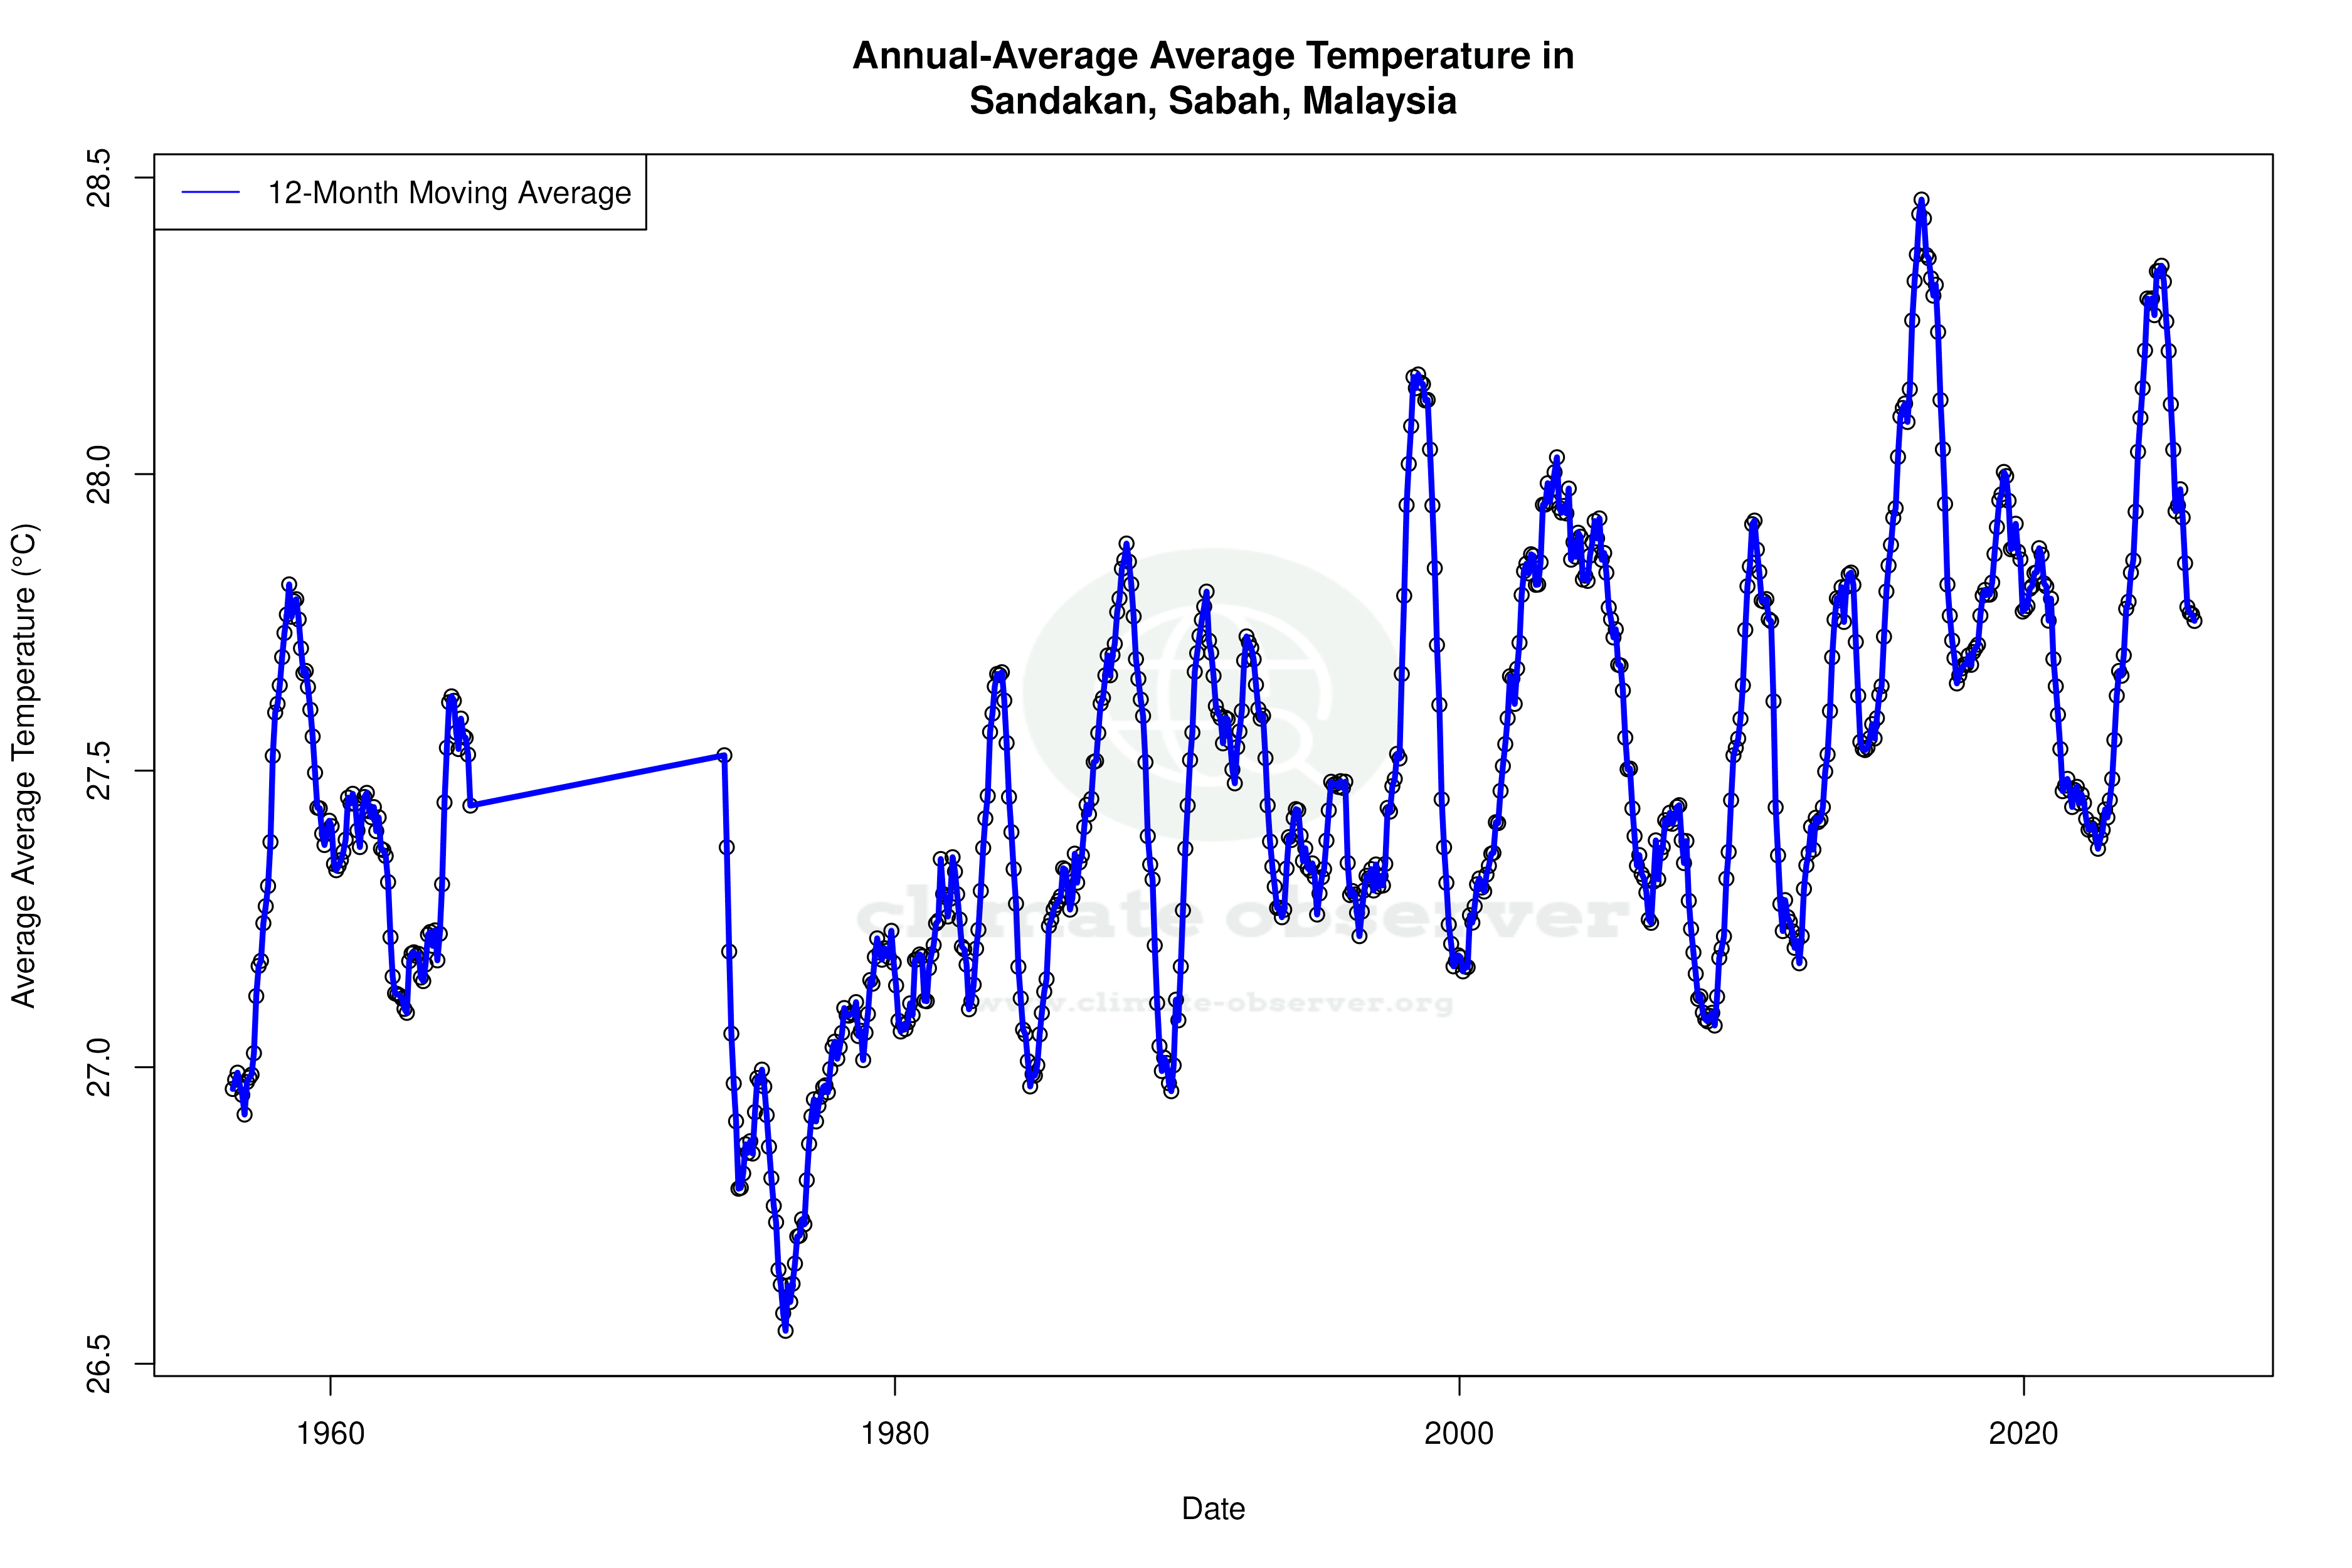


Max Temperature 12-Month MA | 1 of 6
Daily Data Points and Averages Throughout the Year

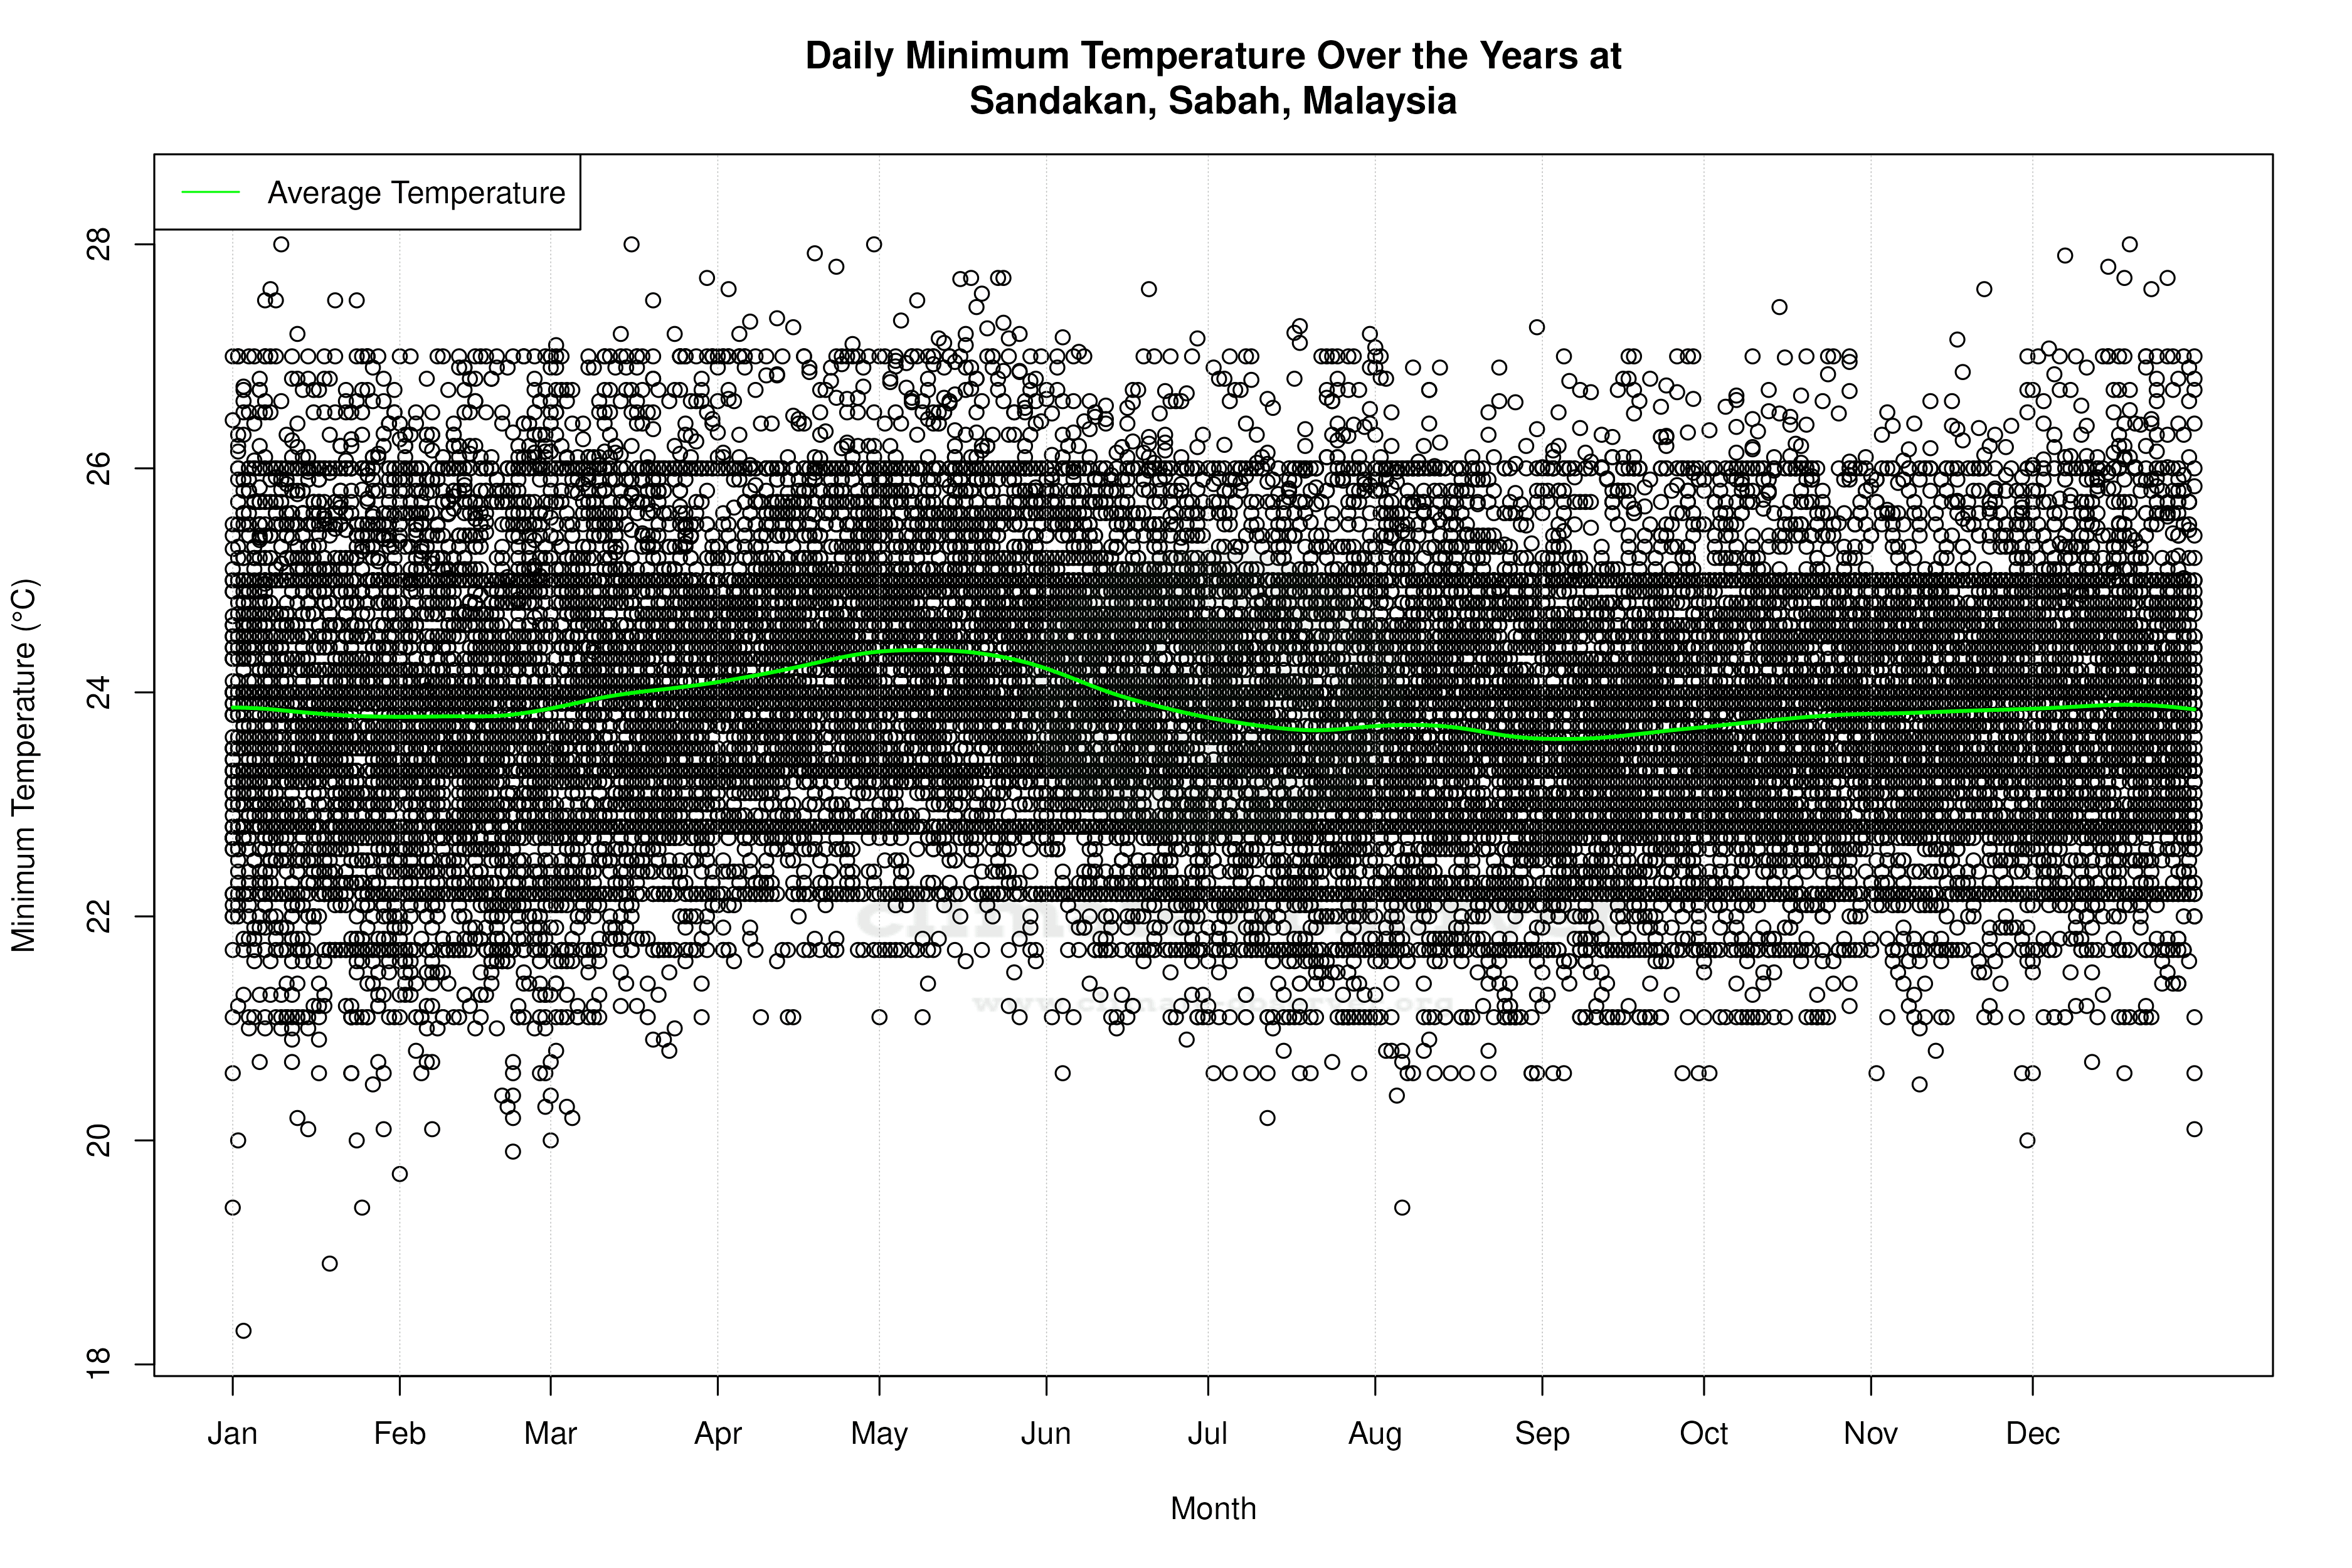


Average Max Temperature Throughout Year | 1 of 5
