Climate for Station: Kuala Lumpur Intl, Selangor, Malaysia
Loading live weather...
Climate Analysis & Overview
Kuala Lumpur International Airport has experienced a nuanced climate story. While all-time trends indicate a warming with highs rising by 0.28°C (0.50°F) and lows by 0.15°C (0.27°F), the past decade shows a cooling trend with highs falling by 0.14°C (0.25°F) and lows by 0.21°C (0.38°F). Precipitation is becoming more evenly distributed, reflecting a shift in local weather patterns.
Equatorial Climate Dynamics
Kuala Lumpur International Airport, located at 2.746°N, 101.71°E, sits within Malaysia's tropical rainforest climate zone, classified as 'Af' under the Köppen system. This classification is characterised by high humidity and abundant rainfall throughout the year. The airport's proximity to the Malacca Strait and surrounding lush landscapes influences its weather patterns, contributing to the area's high moisture content and frequent precipitation events.
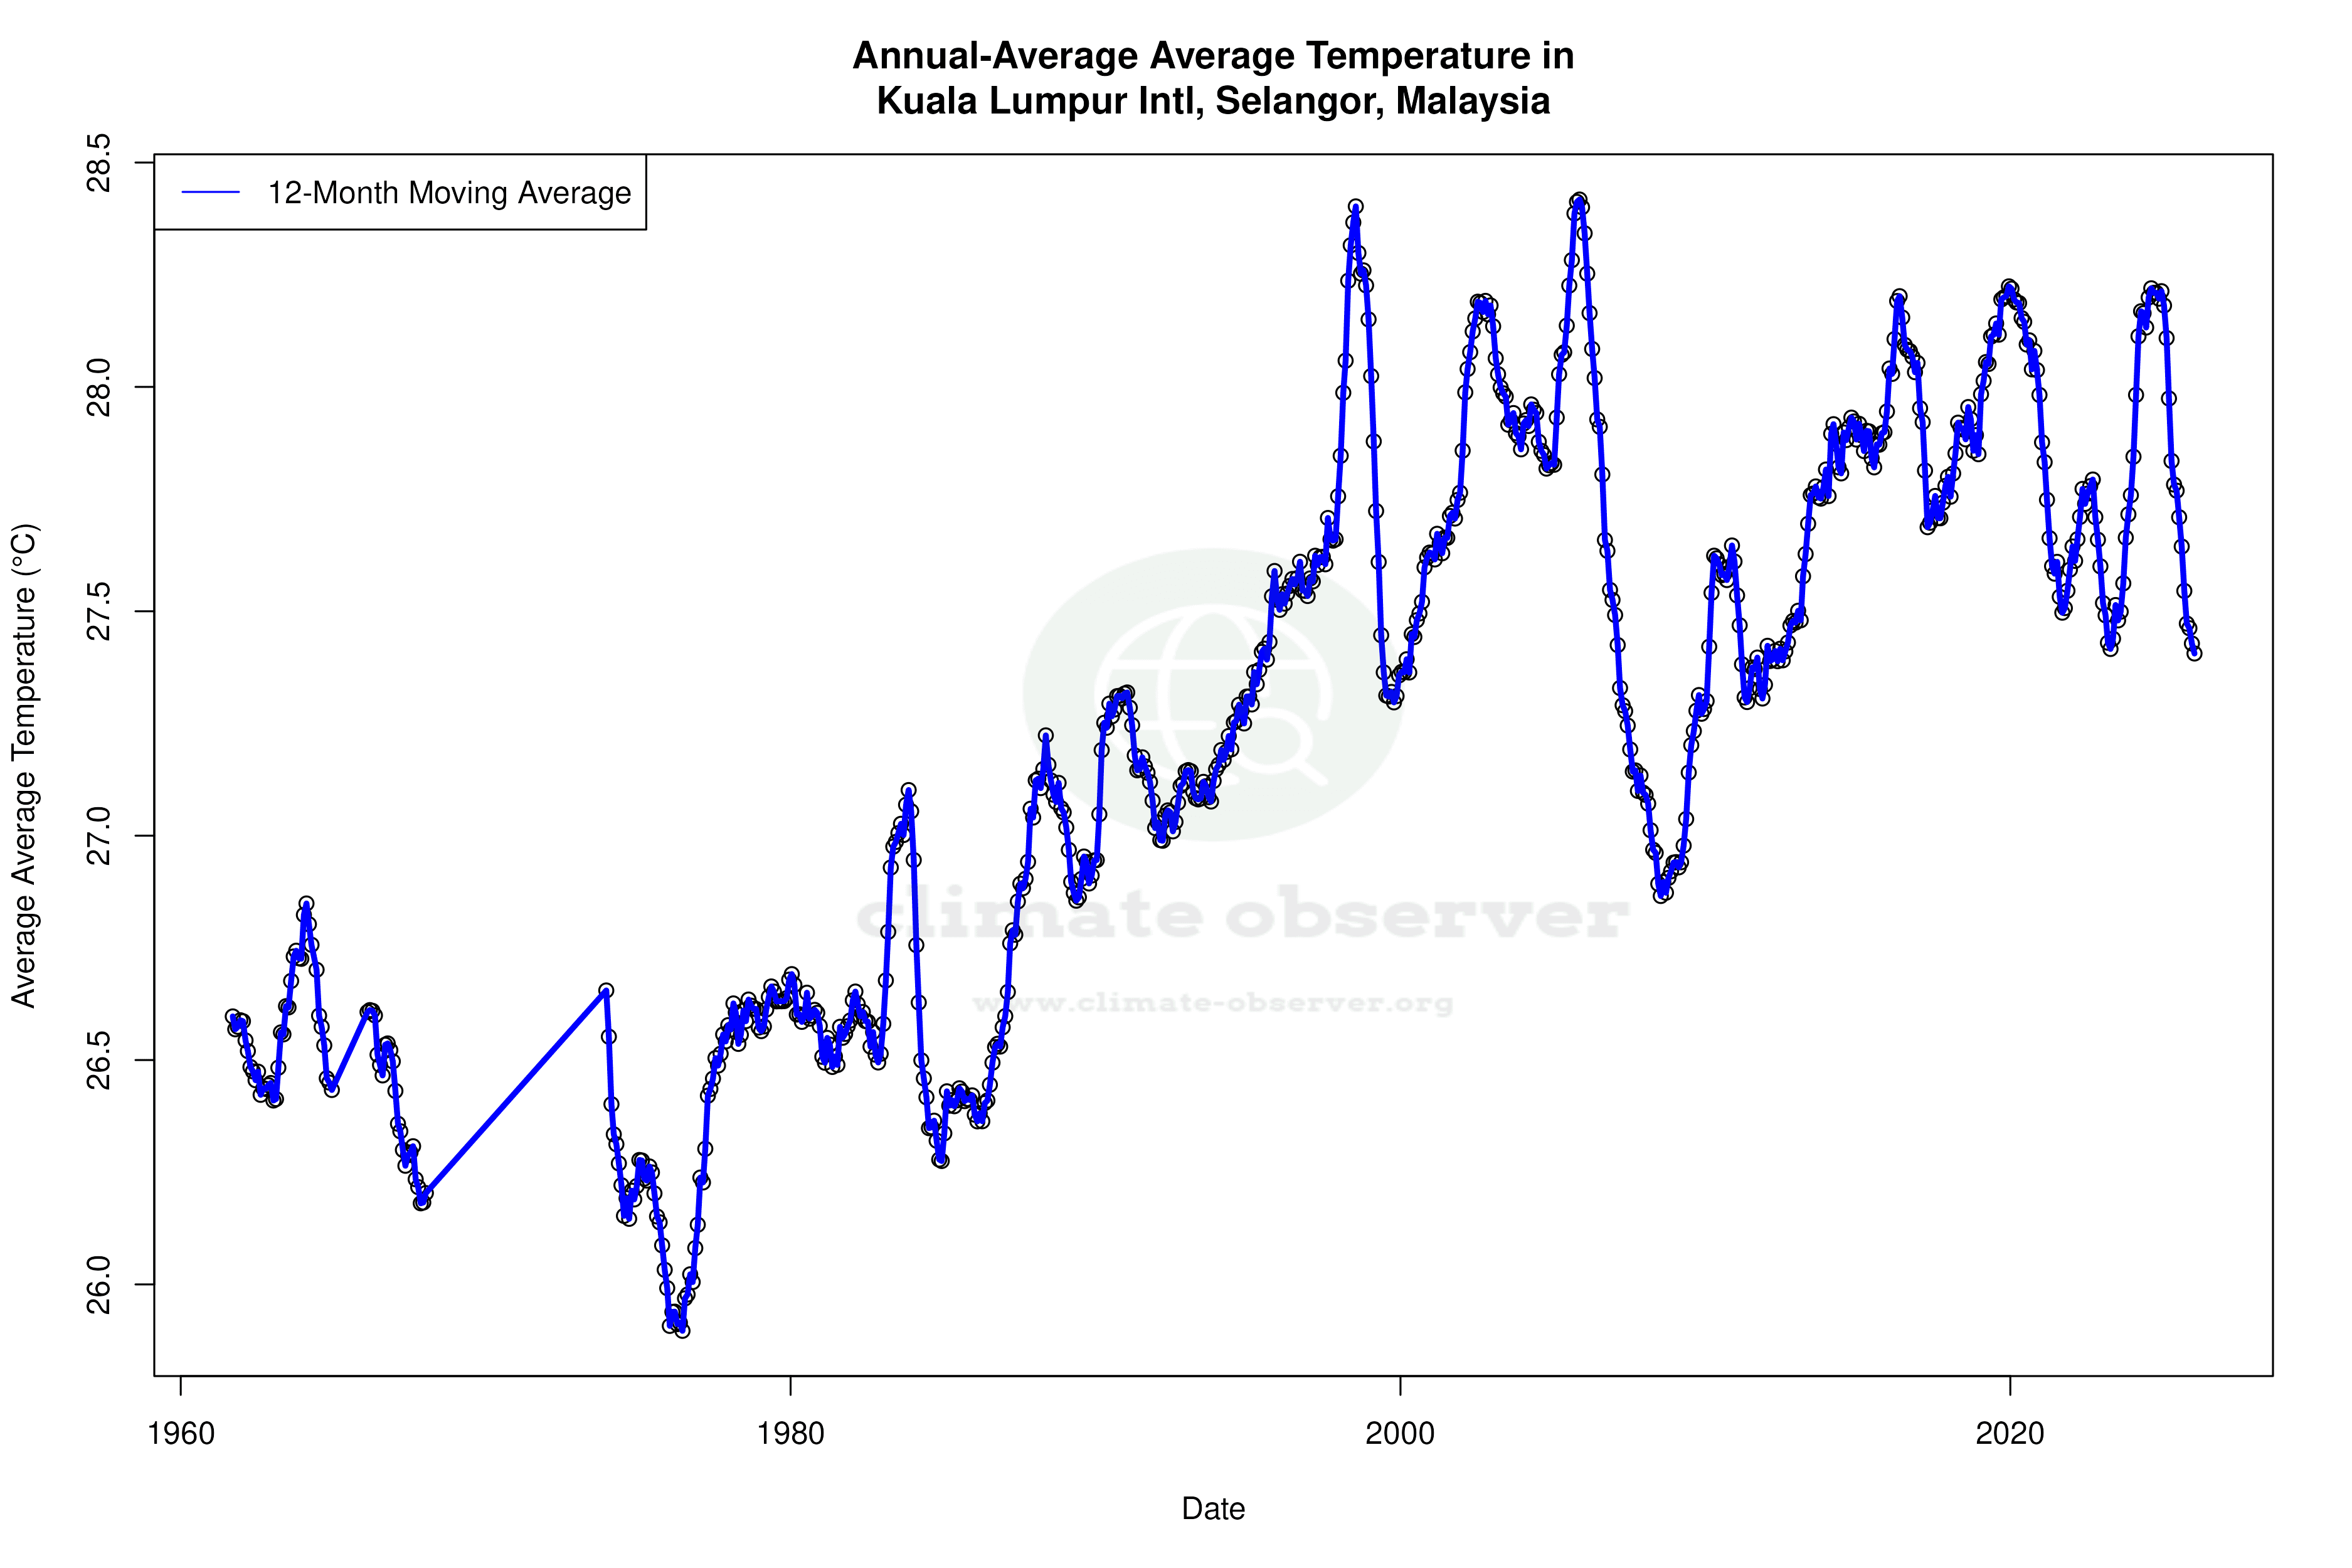
Temperature Trends: A Tale of Two Scales
The climate data for Kuala Lumpur International reveals an intriguing dichotomy. Over the long term, the area has experienced a warming trend, with all-time high temperatures increasing by 0.28°C (0.50°F) and low temperatures by 0.15°C (0.27°F). However, the last decade has seen a cooling trend, with highs decreasing by 0.14°C (0.25°F) and lows by 0.21°C (0.38°F). This recent cooling could be attributed to regional climate interventions or natural variability, contrasting the broader global warming narrative.
Precipitation Patterns: A More Even Distribution
The Precipitation Concentration Index (PCI) offers insight into the distribution of rainfall events. A PCI of 8.98 indicates a more even distribution of rainfall, compared to the baseline of 10.53. This shift suggests that rain is falling more consistently throughout the year, rather than being concentrated in fewer, more intense events. This change could be beneficial for agriculture and water management in the region, aligning with Malaysia's climate resilience goals.
Record Extremes and Their Implications
Kuala Lumpur International has recorded a maximum temperature of 39.0°C (102.2°F) and a minimum of 18.0°C (64.4°F). These extremes highlight the potential for significant temperature variability, even within a tropical climate. Understanding these records is crucial for infrastructure planning and public health strategies, as extreme temperatures can impact energy consumption and heat-related illnesses.
Regional Climate Goals and Future Outlook
Malaysia is actively working towards enhancing its climate resilience and sustainability. Recent initiatives focus on reducing carbon emissions and improving energy efficiency. The observed trends at Kuala Lumpur International, particularly the more even distribution of precipitation, align with these goals by potentially reducing the risk of flooding and drought. As global climate patterns continue to evolve, monitoring these local changes remains vital for informed policy-making and adaptation strategies.
Station Statistics
10-Year Trend
High: -0.40 °F/decade
Low: -0.25 °F/decade
Rain: -0.025 in/decade
25-Year Trend
High: -0.38 °F/decade
Low: +0.13 °F/decade
Rain: +0.008 in/decade
50-Year Trend
High: +0.95 °F/decade
Low: +0.04 °F/decade
Rain: +0.025 in/decade
All-Time Trend
High: +0.49 °F/decade
Low: +0.27 °F/decade
Rain: +0.023 in/decade
Percentage Above-Average Days
Last 12 Months: 45.0%
This Year: 35.6%
Precipitation Concentration Index (PCI) ℹ️
Last 12 Months: 10.3
Historical Average: 10.2
Percentile Rank of Last 12 Months ℹ️
High: 25th percentile
Low: 44th percentile
Rain: 43rd percentile
Change in Variance ℹ️
High: -39.3%
Low: -30.3%
Intraday: -55.3%
Data Coverage
72.2%
First Year of Data
1949
Station Location
Historical Weather Records
| Max High | Avg High | Min High | Max Avg | Avg Avg | Min Avg | Max Low | Avg Low | Min Low | Max Precipitation | Avg Precipitation | Max Snow | Avg Snow | |
|---|---|---|---|---|---|---|---|---|---|---|---|---|---|
| Record | 102.20 °F | — | 75.74 °F | 89.60 °F | — | 72.68 °F | 82.40 °F | — | 64.40 °F | 7.17 in | — | — | — |
| January | 102.20 °F | 88.83 °F | 75.74 °F | 86.54 °F | 80.25 °F | 72.68 °F | 80.60 °F | 74.25 °F | 66.02 °F | 5.12 in | 0.25 in | — | — |
| February | 97.16 °F | 90.16 °F | 78.03 °F | 86.90 °F | 81.09 °F | 73.04 °F | 79.70 °F | 74.54 °F | 66.02 °F | 5.12 in | 0.22 in | — | — |
| March | 98.78 °F | 90.64 °F | 79.63 °F | 88.52 °F | 81.53 °F | 73.94 °F | 80.78 °F | 75.58 °F | 66.02 °F | 6.10 in | 0.30 in | — | — |
| April | 98.96 °F | 90.62 °F | 79.77 °F | 89.60 °F | 81.69 °F | 75.38 °F | 80.96 °F | 76.42 °F | 69.80 °F | 4.09 in | 0.35 in | — | — |
| May | 101.30 °F | 90.31 °F | 79.54 °F | 88.88 °F | 82.15 °F | 74.12 °F | 81.81 °F | 77.02 °F | 68.72 °F | 7.17 in | 0.27 in | — | — |
| June | 97.34 °F | 89.74 °F | 79.34 °F | 87.26 °F | 81.76 °F | 74.30 °F | 81.50 °F | 76.45 °F | 69.80 °F | 3.98 in | 0.19 in | — | — |
| July | 97.34 °F | 88.93 °F | 78.80 °F | 88.16 °F | 81.06 °F | 74.30 °F | 80.96 °F | 75.78 °F | 69.80 °F | 4.06 in | 0.21 in | — | — |
| August | 96.98 °F | 88.97 °F | 78.98 °F | 85.82 °F | 80.97 °F | 73.76 °F | 81.32 °F | 75.62 °F | 64.40 °F | 4.14 in | 0.22 in | — | — |
| September | 96.44 °F | 88.71 °F | 78.80 °F | 87.26 °F | 80.64 °F | 73.58 °F | 82.40 °F | 75.44 °F | 69.98 °F | 5.12 in | 0.26 in | — | — |
| October | 97.52 °F | 88.68 °F | 77.00 °F | 87.26 °F | 80.48 °F | 73.58 °F | 80.60 °F | 75.50 °F | 64.40 °F | 4.72 in | 0.32 in | — | — |
| November | 102.20 °F | 88.24 °F | 77.00 °F | 84.92 °F | 79.95 °F | 73.58 °F | 79.70 °F | 75.22 °F | 69.26 °F | 4.84 in | 0.40 in | — | — |
| December | 95.90 °F | 88.07 °F | 76.57 °F | 85.46 °F | 79.91 °F | 73.04 °F | 78.80 °F | 74.72 °F | 66.20 °F | 5.91 in | 0.31 in | — | — |
Data Visualisations
Remove WatermarksCurrent Year Climate Trends vs Historical


Max Temperature this Year | 1 of 6
Climate 12-Month Moving Averages


Max Temperature 12-Month MA | 1 of 6
Daily Data Points and Averages Throughout the Year


Average Max Temperature Throughout Year | 1 of 5
