Climate for Station: Inhambane, Mozambique
Loading live weather...
Climate Analysis & Overview
Inhambane's climate is experiencing a complex interplay of warming and cooling trends, with recent years showing a significant increase in temperature extremes. Precipitation patterns have become more evenly distributed, potentially altering local agricultural practices and water resource management.
Coastal Climate Characteristics
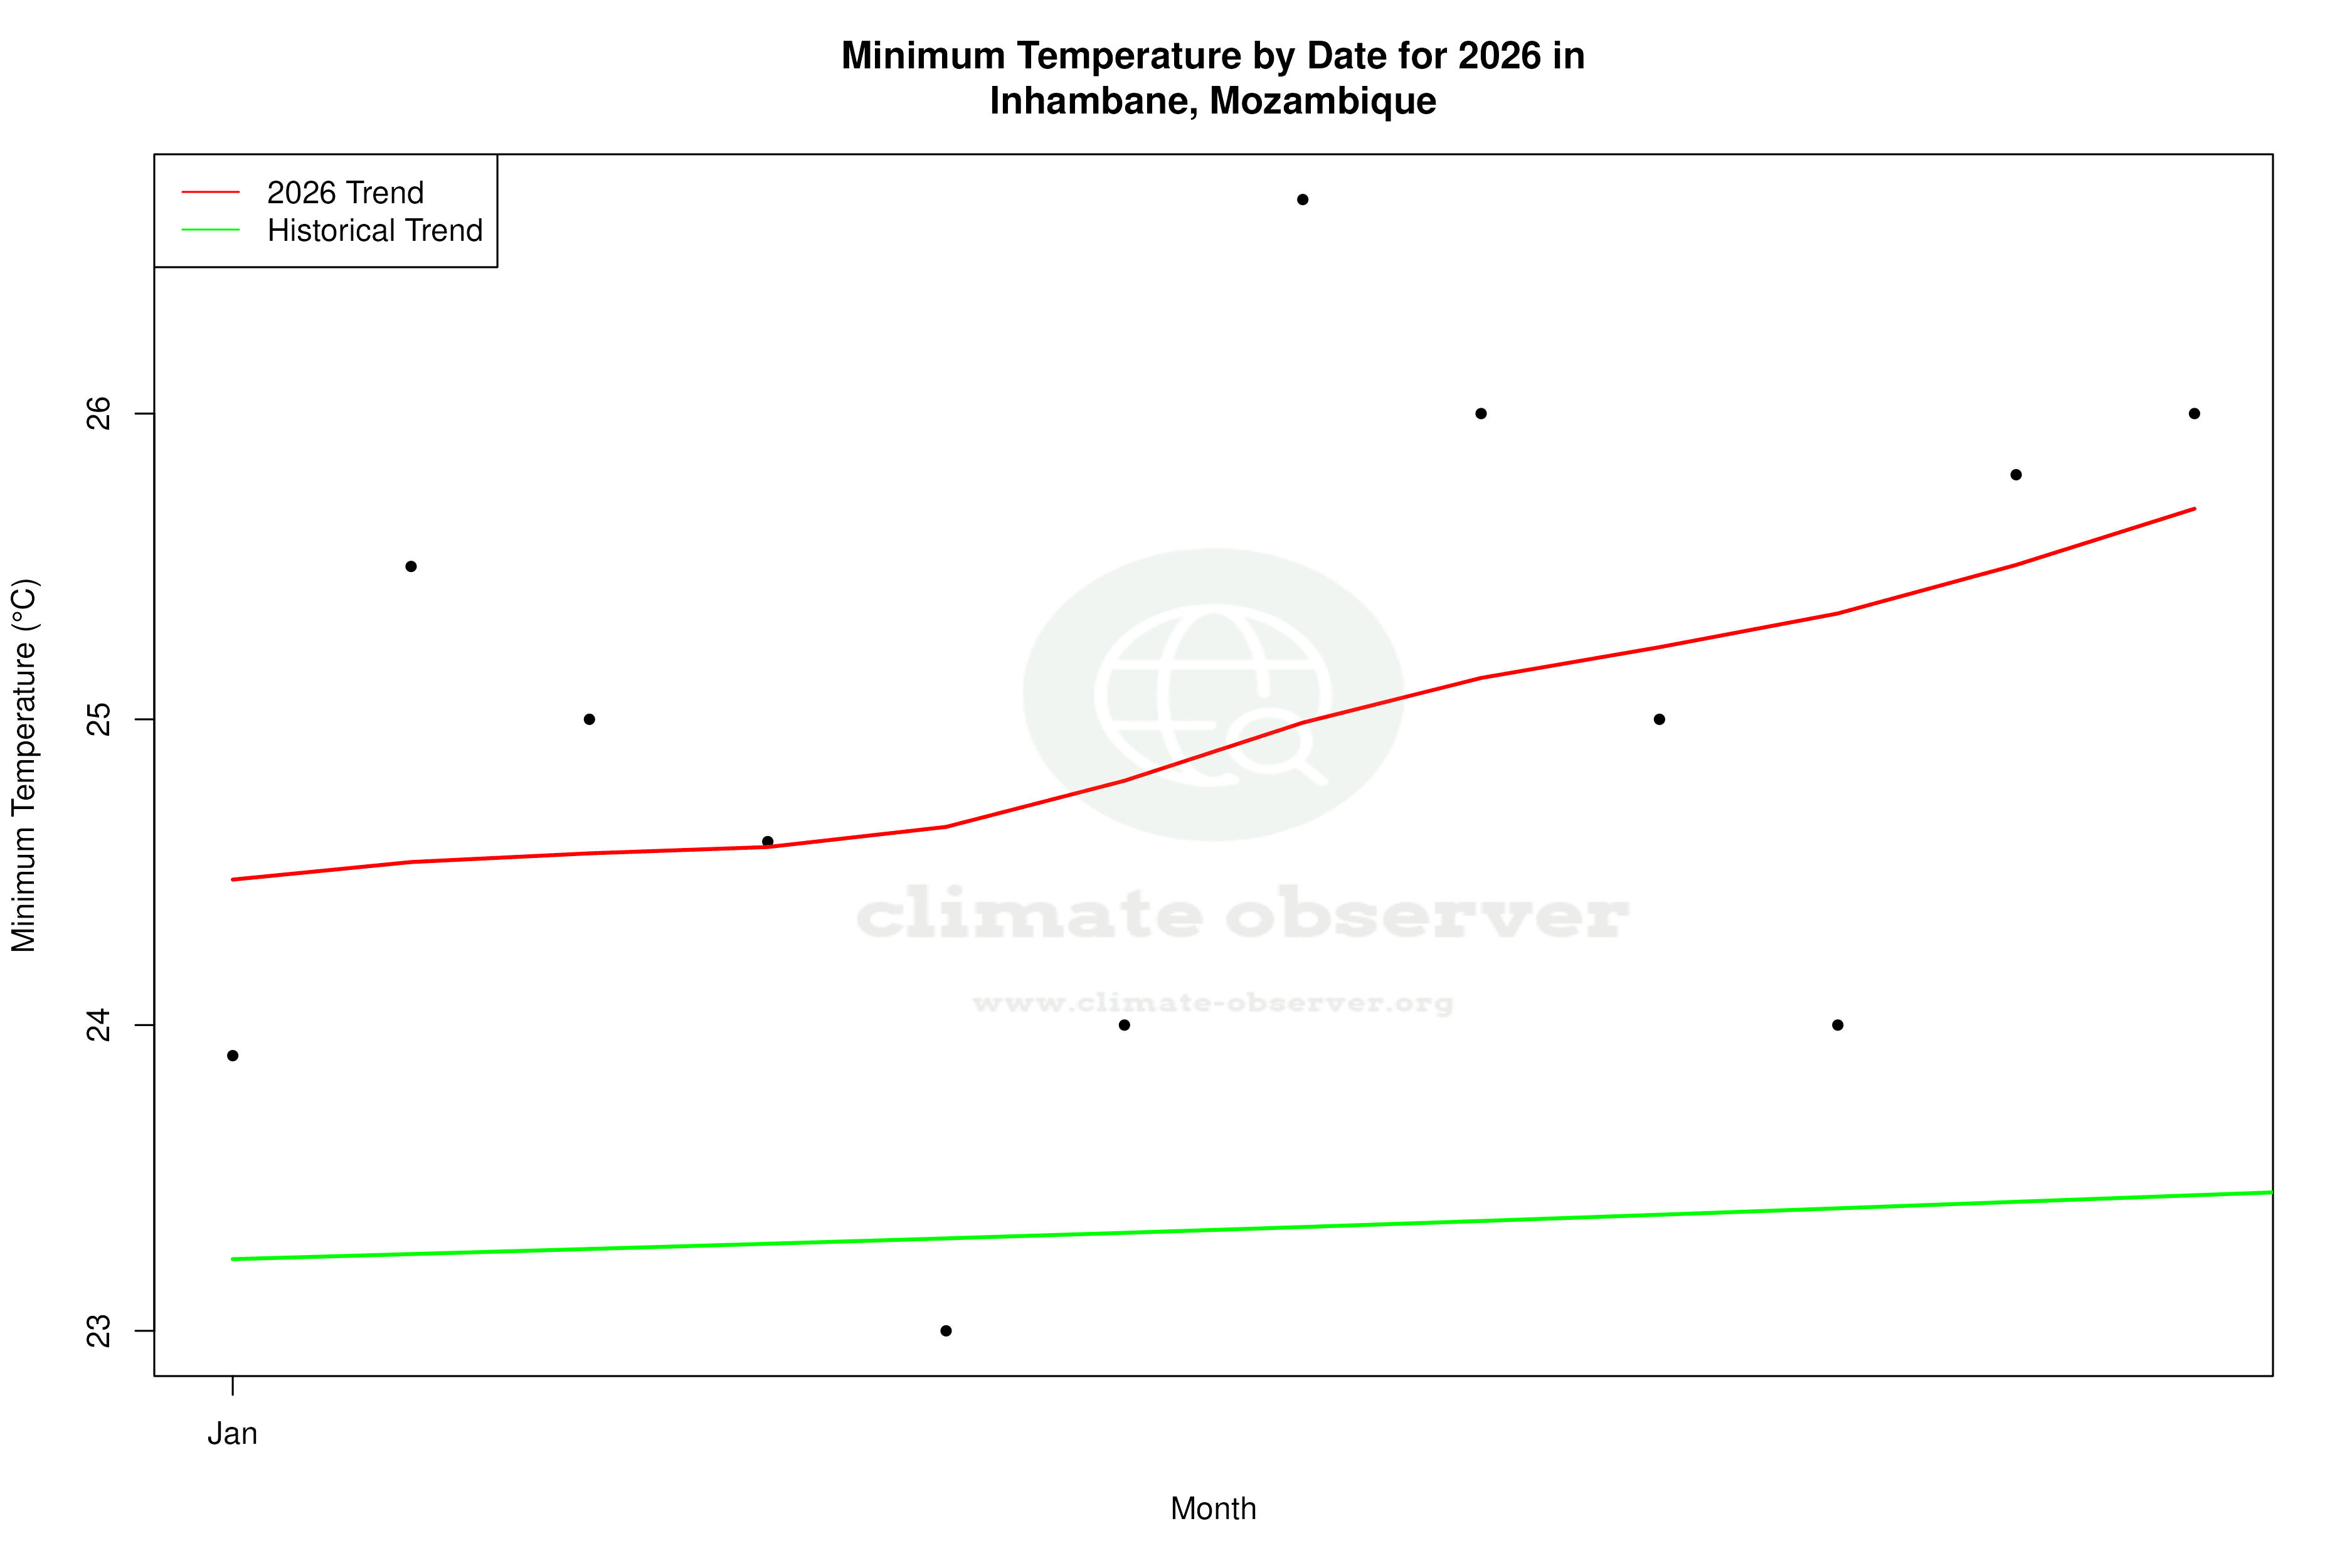
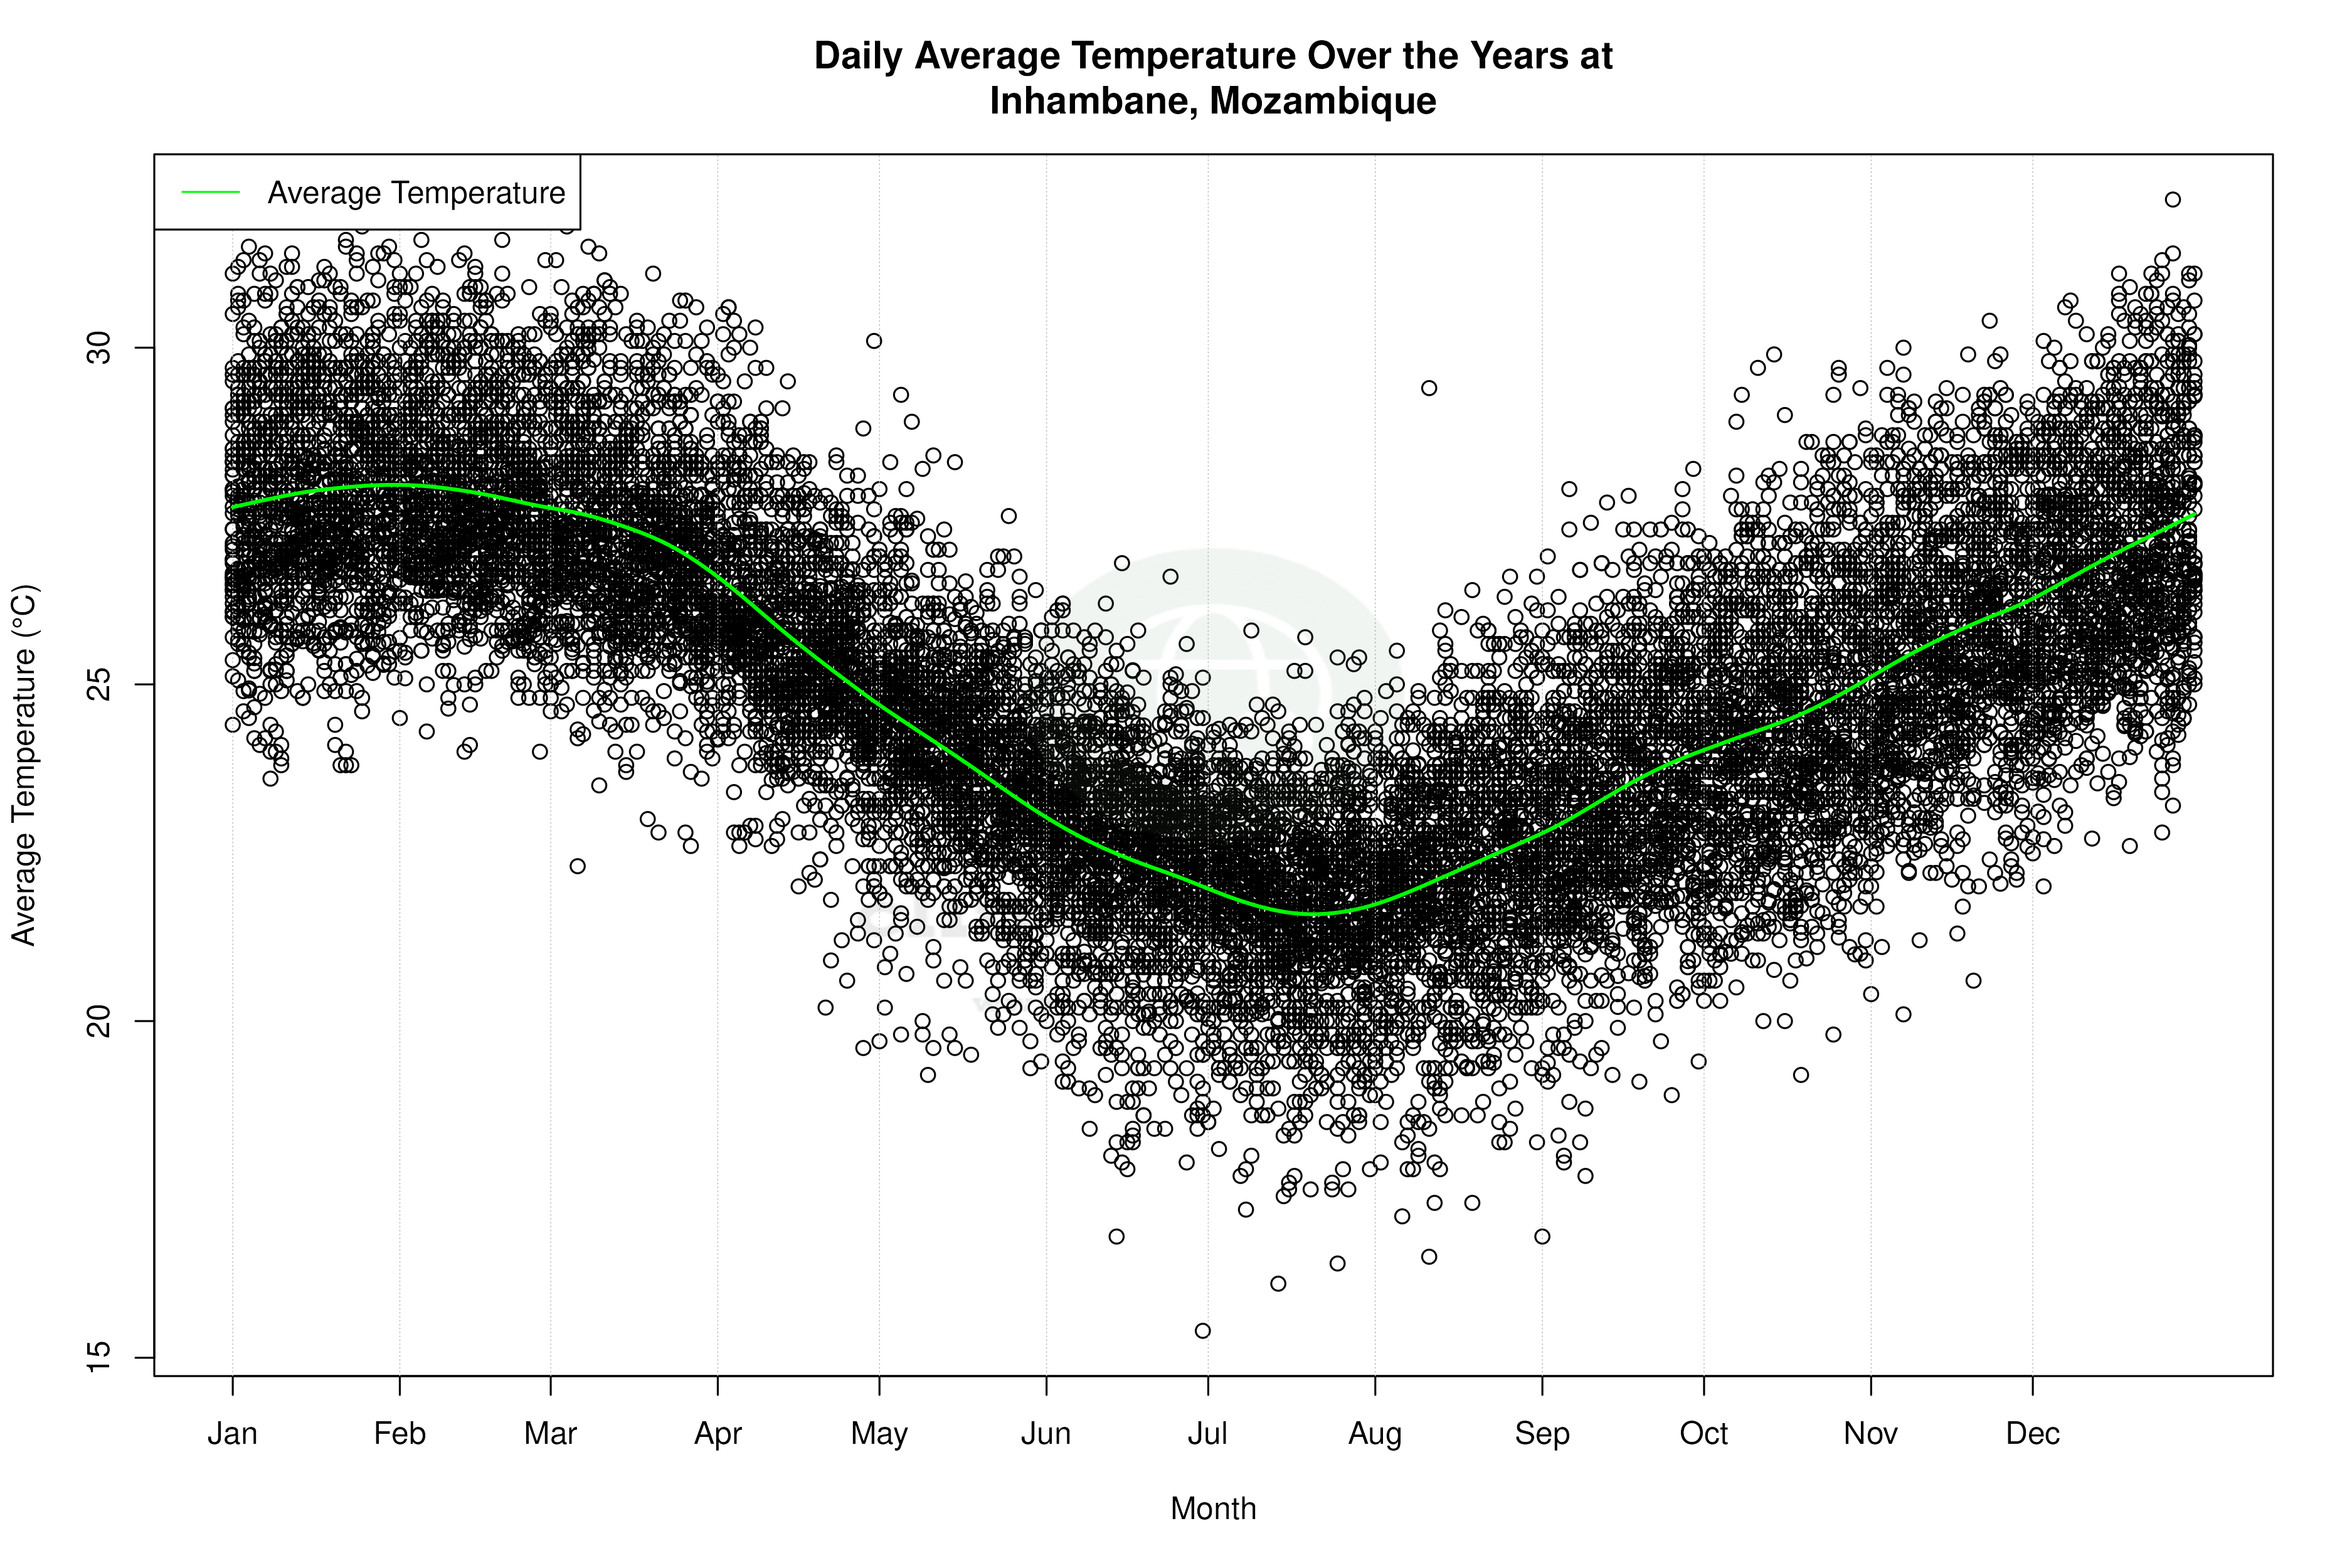
Inhambane, located along Mozambique's southeastern coast, is classified under the Köppen climate classification as a tropical savanna climate (Aw). This classification indicates a distinct wet and dry season, influenced by its proximity to the Indian Ocean. The coastal geography moderates temperature extremes, but recent data suggests notable changes. Over the past decade, the region has experienced a warming trend with high temperatures increasing by 1.06°C (1.91°F) and low temperatures rising by 2.38°C (4.28°F). This short-term warming contrasts with the all-time trends, which show a slight cooling of high temperatures by 0.09°C (0.16°F) and a modest warming of low temperatures by 0.20°C (0.36°F).
Temperature Extremes and Records
Despite the general moderation of coastal climates, Inhambane has recorded significant temperature extremes. The maximum temperature on record is 38.6°C (101.5°F), while the minimum is 7.0°C (44.6°F). These records underscore the potential for both high heat and cooler spells, which can impact local ecosystems and human activities. The recent warming trend in low temperatures may suggest milder nights, which could influence energy consumption patterns and agricultural cycles.
Shifts in Precipitation Patterns
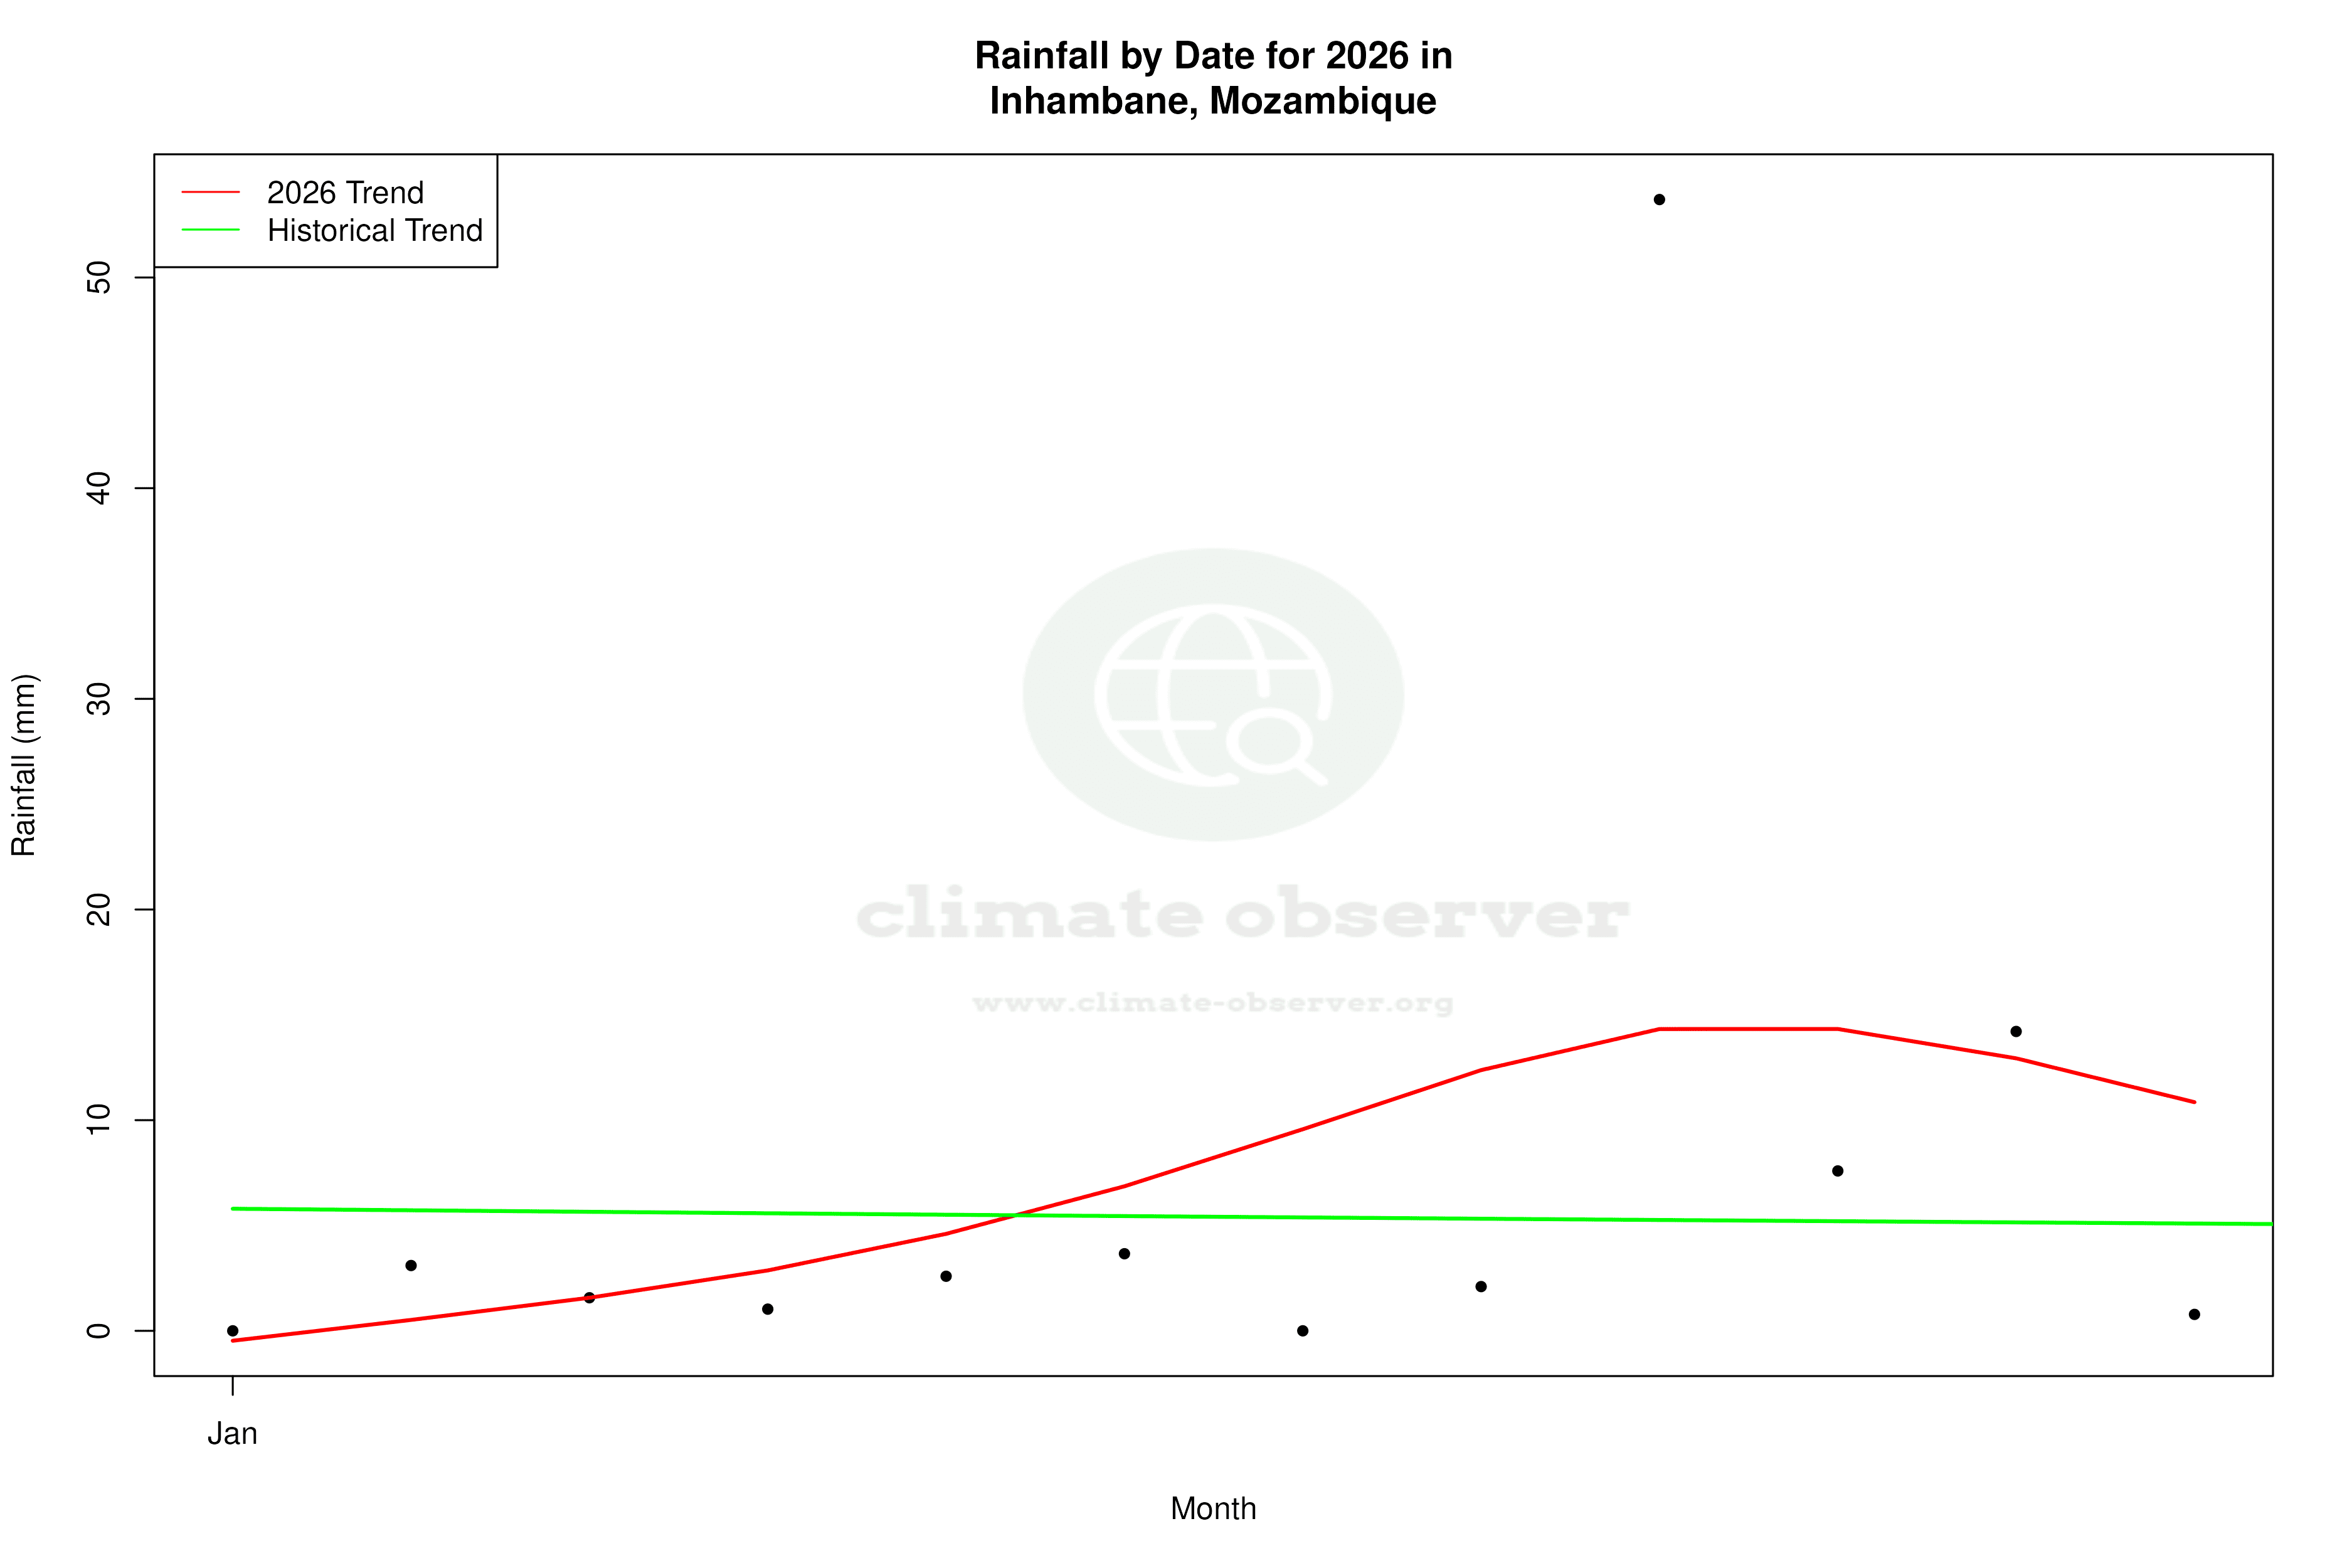
The Precipitation Concentration Index (PCI) for Inhambane has decreased from a baseline of 17.98 to a current value of 12.66. This indicates a more even distribution of rainfall throughout the year, moving away from concentrated heavy rain events. Such a shift can have significant implications for water resource management and agriculture, as more consistent rainfall can benefit crop growth and reduce the risk of flood-related damage.
Regional Climate Implications
Inhambane's climate trends are set against the backdrop of Mozambique's broader climate goals, which include enhancing resilience to climate change and improving water resource management. The observed increase in temperature extremes and changes in precipitation distribution may require adaptive strategies to ensure sustainable development. As the region continues to experience these climatic shifts, understanding the local impacts will be crucial for policymakers and stakeholders.
Future Considerations
The contrasting trends in short-term and all-time temperature changes highlight the complexity of Inhambane's climate dynamics. While recent years have seen a marked warming, the long-term data suggests a more nuanced picture. This duality underscores the importance of continuous monitoring and adaptive management to mitigate potential adverse effects on the environment and local communities.
Station Statistics
10-Year Trend
High: +1.21 °F/decade
Low: +4.68 °F/decade
Rain: -0.031 in/decade
25-Year Trend
High: +2.52 °F/decade
Low: -1.26 °F/decade
Rain: +0.006 in/decade
50-Year Trend
High: +0.17 °F/decade
Low: +0.58 °F/decade
Rain: +0.001 in/decade
All-Time Trend
High: -0.13 °F/decade
Low: +0.42 °F/decade
Rain: -0.001 in/decade
Percentage Above-Average Days
Last 12 Months: 55.1%
This Year: 46.8%
Precipitation Concentration Index (PCI) ℹ️
Last 12 Months: 18.1
Historical Average: 17.4
Percentile Rank of Last 12 Months ℹ️
High: 69th percentile
Low: 93rd percentile
Rain: 30th percentile
Change in Variance ℹ️
High: -8.7%
Low: +42.2%
Intraday: +5.9%
Data Coverage
91.1%
First Year of Data
1955
Station Location
Historical Weather Records
| Max High | Avg High | Min High | Max Avg | Avg Avg | Min Avg | Max Low | Avg Low | Min Low | Max Precipitation | Avg Precipitation | Max Snow | Avg Snow | |
|---|---|---|---|---|---|---|---|---|---|---|---|---|---|
| Record | 101.48 °F | — | 65.48 °F | 89.96 °F | — | 59.72 °F | 85.10 °F | — | 44.60 °F | 13.16 in | — | — | — |
| January | 97.16 °F | 86.45 °F | 77.18 °F | 89.60 °F | 82.11 °F | 74.48 °F | 85.10 °F | 74.32 °F | 59.36 °F | 6.19 in | 0.20 in | — | — |
| February | 97.70 °F | 86.54 °F | 76.64 °F | 89.42 °F | 82.04 °F | 75.20 °F | 82.92 °F | 74.65 °F | 65.66 °F | 5.69 in | 0.18 in | — | — |
| March | 97.70 °F | 85.67 °F | 75.56 °F | 89.24 °F | 81.10 °F | 72.14 °F | 83.61 °F | 73.35 °F | 59.54 °F | 6.07 in | 0.14 in | — | — |
| April | 93.56 °F | 83.10 °F | 72.68 °F | 87.08 °F | 78.19 °F | 67.28 °F | 82.02 °F | 70.48 °F | 58.10 °F | 5.02 in | 0.09 in | — | — |
| May | 94.10 °F | 80.17 °F | 70.16 °F | 84.74 °F | 75.05 °F | 66.56 °F | 79.54 °F | 66.34 °F | 50.00 °F | 3.56 in | 0.06 in | — | — |
| June | 89.60 °F | 77.39 °F | 67.10 °F | 80.24 °F | 72.52 °F | 59.72 °F | 76.68 °F | 63.26 °F | 45.14 °F | 6.60 in | 0.06 in | — | — |
| July | 88.70 °F | 76.30 °F | 68.00 °F | 78.44 °F | 71.06 °F | 60.98 °F | 75.56 °F | 61.99 °F | 46.04 °F | 3.46 in | 0.04 in | — | — |
| August | 93.20 °F | 77.20 °F | 67.10 °F | 84.92 °F | 72.05 °F | 61.70 °F | 73.74 °F | 62.96 °F | 44.60 °F | 1.65 in | 0.02 in | — | — |
| September | 94.10 °F | 78.85 °F | 65.48 °F | 82.76 °F | 74.17 °F | 62.24 °F | 76.28 °F | 65.65 °F | 50.72 °F | 3.67 in | 0.03 in | — | — |
| October | 93.92 °F | 80.75 °F | 69.80 °F | 85.82 °F | 76.04 °F | 66.56 °F | 78.44 °F | 68.26 °F | 50.00 °F | 2.30 in | 0.05 in | — | — |
| November | 98.96 °F | 82.80 °F | 68.18 °F | 86.72 °F | 78.29 °F | 68.18 °F | 79.88 °F | 70.86 °F | 52.88 °F | 13.16 in | 0.10 in | — | — |
| December | 101.48 °F | 84.92 °F | 73.35 °F | 89.96 °F | 80.45 °F | 71.60 °F | 84.65 °F | 73.01 °F | 59.90 °F | 9.51 in | 0.18 in | — | — |
Data Visualisations
Remove WatermarksCurrent Year Climate Trends vs Historical


Max Temperature this Year | 1 of 6
Climate 12-Month Moving Averages


Max Temperature 12-Month MA | 1 of 6
Daily Data Points and Averages Throughout the Year


Average Max Temperature Throughout Year | 1 of 5
