Climate for Station: Xai Xai, Gaza, Mozambique
Loading live weather...
Climate Analysis & Overview
Xai Xai, located in Mozambique's Gaza province, exhibits a complex climate narrative with a slight overall warming trend in highs and a more pronounced warming in lows over the long term. However, the past decade shows a cooling in both highs and lows, indicating a nuanced climatic shift. Precipitation patterns have become marginally more concentrated, reflecting potential changes in rainfall distribution.
Climatic Context of Xai Xai
Xai Xai, positioned at -25.05, 33.633, falls under the Köppen climate classification of Aw, indicating a tropical savanna climate with a distinct wet and dry season. The Limpopo River, which flows nearby, plays a significant role in the region's hydrology, influencing local weather patterns and contributing to the area's agricultural viability. The proximity to the Indian Ocean also moderates temperatures, preventing extremes.
Temperature Trends: A Tale of Two Scales
Examining the long-term data, Xai Xai has experienced a slight warming trend in high temperatures, with an increase of 0.06°C (0.11°F). The lows have warmed more significantly, rising by 0.46°C (0.83°F). This suggests a gradual increase in nighttime temperatures, which could have implications for local ecosystems and agriculture. However, the past decade tells a different story, with high temperatures showing a cooling trend of -0.09°C (-0.16°F) and lows decreasing by -0.80°C (-1.44°F). This recent cooling could be indicative of short-term climatic variability or localised influences.
Extreme Temperature Records
Xai Xai's temperature extremes underscore the region's climatic variability. The highest recorded temperature stands at 44.2°C (111.6°F), while the lowest is 3.4°C (38.1°F). These records highlight the potential for significant temperature swings, which can impact human health, infrastructure, and natural systems.
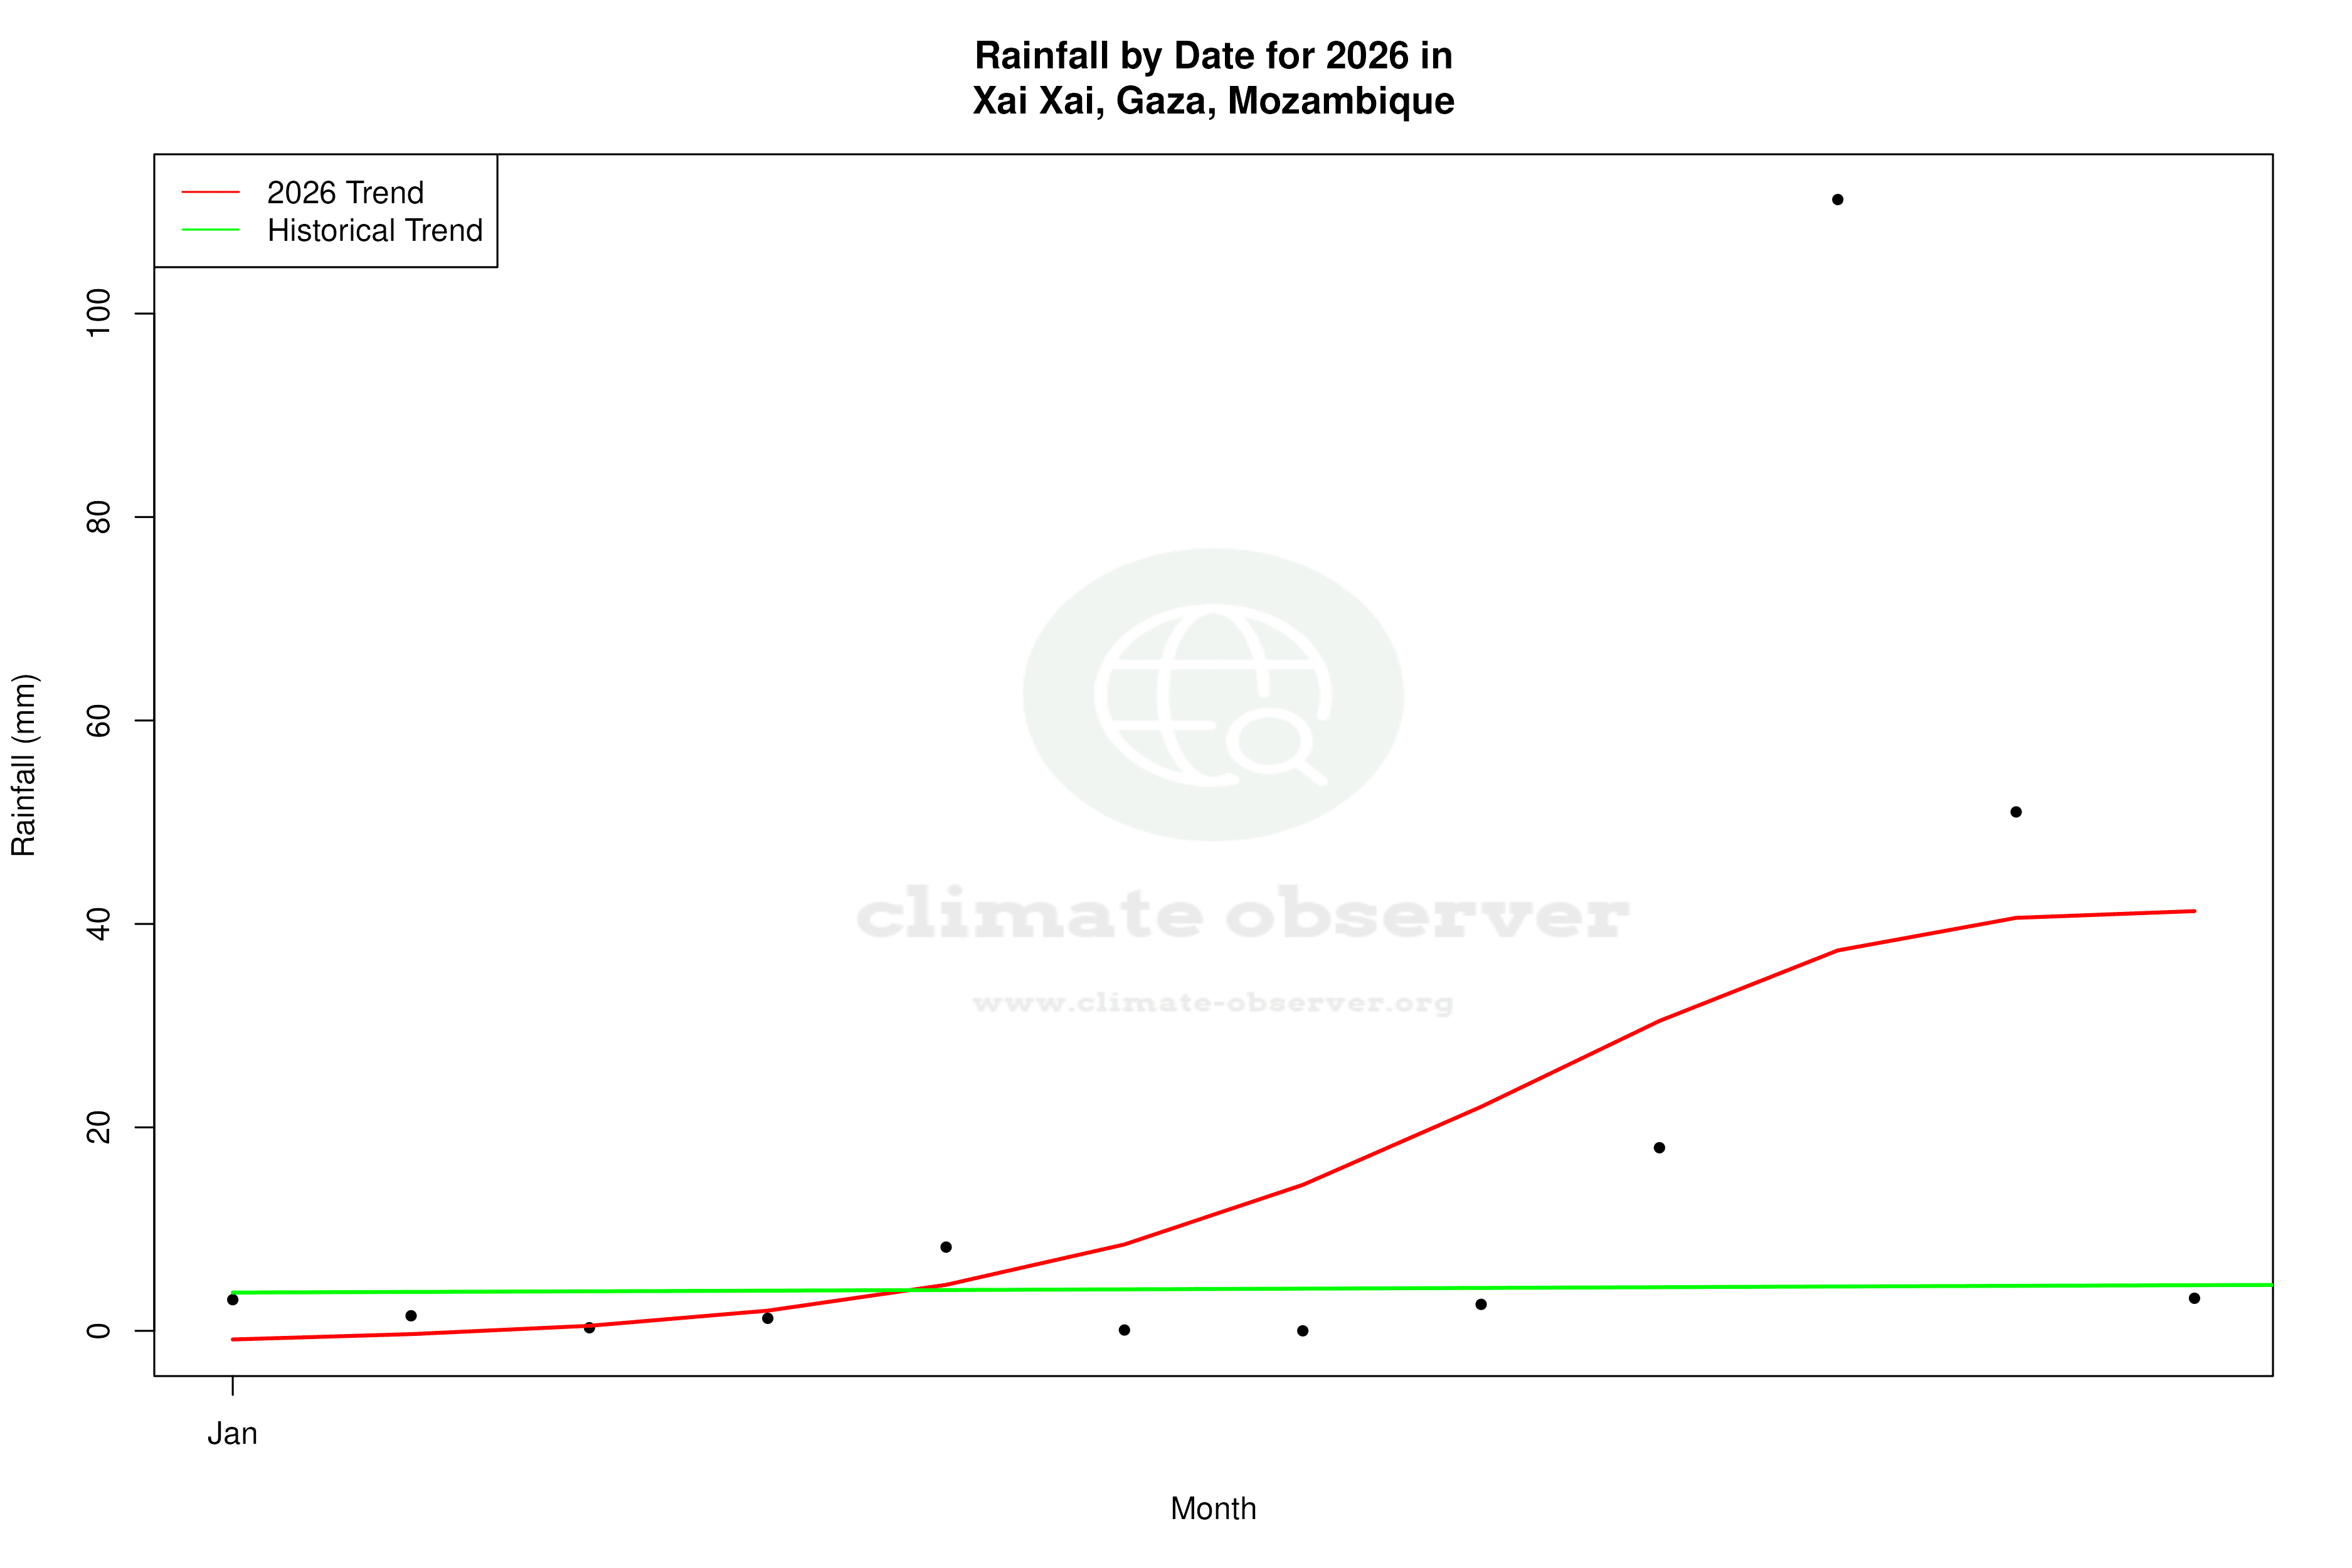
Precipitation Patterns: Concentration Changes
The Precipitation Concentration Index (PCI) offers insights into rainfall distribution. Xai Xai's PCI has increased from a baseline of 16.4 to a current value of 17.5, indicating a marginal increase in precipitation concentration. This suggests that rainfall events are becoming slightly more intense and less evenly distributed throughout the year. Such changes could affect water resource management and agricultural planning, necessitating adaptive strategies to cope with potential droughts or flooding.
Regional Climate Goals and Considerations
Mozambique is actively pursuing climate resilience initiatives, focusing on sustainable agriculture and water management to mitigate the impacts of climate variability. Recent weather events, such as cyclones, have underscored the importance of these efforts. Understanding the nuanced climate trends in regions like Xai Xai is crucial for informing policy and ensuring the long-term well-being of its communities.
Station Statistics
10-Year Trend
High: +0.06 °F/decade
Low: -0.90 °F/decade
Rain: +0.012 in/decade
25-Year Trend
High: -0.18 °F/decade
Low: -0.45 °F/decade
Rain: +0.016 in/decade
50-Year Trend
High: +0.08 °F/decade
Low: +0.76 °F/decade
Rain: -0.002 in/decade
All-Time Trend
High: +0.09 °F/decade
Low: +0.77 °F/decade
Rain: -0.002 in/decade
Percentage Above-Average Days
Last 12 Months: 48.1%
This Year: 43.6%
Precipitation Concentration Index (PCI) ℹ️
Last 12 Months: 22.7
Historical Average: 15.1
Percentile Rank of Last 12 Months ℹ️
High: 59th percentile
Low: 77th percentile
Rain: 67th percentile
Change in Variance ℹ️
High: -2.3%
Low: -20.7%
Intraday: -9.8%
Data Coverage
91.0%
First Year of Data
1951
Station Location
Historical Weather Records
| Max High | Avg High | Min High | Max Avg | Avg Avg | Min Avg | Max Low | Avg Low | Min Low | Max Precipitation | Avg Precipitation | Max Snow | Avg Snow | |
|---|---|---|---|---|---|---|---|---|---|---|---|---|---|
| Record | 111.56 °F | — | 59.00 °F | 94.28 °F | — | 53.42 °F | 85.46 °F | — | 38.12 °F | 9.74 in | — | — | — |
| January | 106.70 °F | 87.77 °F | 69.80 °F | 94.10 °F | 80.29 °F | 70.52 °F | 80.60 °F | 72.09 °F | 53.96 °F | 5.28 in | 0.19 in | — | — |
| February | 109.04 °F | 87.47 °F | 74.66 °F | 91.04 °F | 80.21 °F | 73.15 °F | 81.50 °F | 72.36 °F | 57.38 °F | 7.41 in | 0.19 in | — | — |
| March | 103.10 °F | 86.59 °F | 73.40 °F | 92.84 °F | 78.95 °F | 68.90 °F | 84.20 °F | 70.61 °F | 52.88 °F | 4.09 in | 0.14 in | — | — |
| April | 101.30 °F | 84.19 °F | 69.44 °F | 89.42 °F | 75.49 °F | 65.48 °F | 77.49 °F | 66.54 °F | 48.92 °F | 9.74 in | 0.12 in | — | — |
| May | 97.52 °F | 81.12 °F | 64.20 °F | 82.58 °F | 71.59 °F | 53.42 °F | 73.20 °F | 61.32 °F | 40.82 °F | 4.13 in | 0.08 in | — | — |
| June | 92.30 °F | 77.73 °F | 61.70 °F | 79.88 °F | 68.09 °F | 54.86 °F | 70.16 °F | 56.94 °F | 38.12 °F | 2.98 in | 0.06 in | — | — |
| July | 92.12 °F | 77.14 °F | 64.40 °F | 79.34 °F | 67.27 °F | 55.40 °F | 71.96 °F | 55.81 °F | 40.28 °F | 2.67 in | 0.05 in | — | — |
| August | 99.14 °F | 79.73 °F | 63.86 °F | 85.64 °F | 69.57 °F | 55.58 °F | 70.83 °F | 57.94 °F | 41.72 °F | 2.13 in | 0.04 in | — | — |
| September | 103.46 °F | 82.91 °F | 59.00 °F | 94.28 °F | 72.94 °F | 57.92 °F | 73.58 °F | 62.00 °F | 42.08 °F | 2.74 in | 0.04 in | — | — |
| October | 109.40 °F | 84.44 °F | 65.30 °F | 93.02 °F | 74.94 °F | 60.26 °F | 78.80 °F | 65.33 °F | 47.84 °F | 4.97 in | 0.07 in | — | — |
| November | 111.56 °F | 86.34 °F | 67.64 °F | 92.30 °F | 77.48 °F | 64.40 °F | 85.46 °F | 68.19 °F | 52.88 °F | 4.39 in | 0.11 in | — | — |
| December | 108.32 °F | 87.84 °F | 70.88 °F | 93.02 °F | 79.58 °F | 68.90 °F | 85.10 °F | 70.61 °F | 52.70 °F | 8.54 in | 0.16 in | — | — |
Data Visualisations
Remove WatermarksCurrent Year Climate Trends vs Historical


Max Temperature this Year | 1 of 6
Climate 12-Month Moving Averages


Max Temperature 12-Month MA | 1 of 6
Daily Data Points and Averages Throughout the Year


Average Max Temperature Throughout Year | 1 of 5
