Climate for Station: Norfolk Island Intl, Norfolk Island [Australia]
Loading live weather...
Climate Analysis & Overview
Norfolk Island's climate is experiencing a nuanced warming trend, with a significant shift in precipitation patterns towards more even distribution. While the all-time temperature changes are modest, recent trends suggest a more pronounced warming in high temperatures.
Climate Classification and Geographic Influence
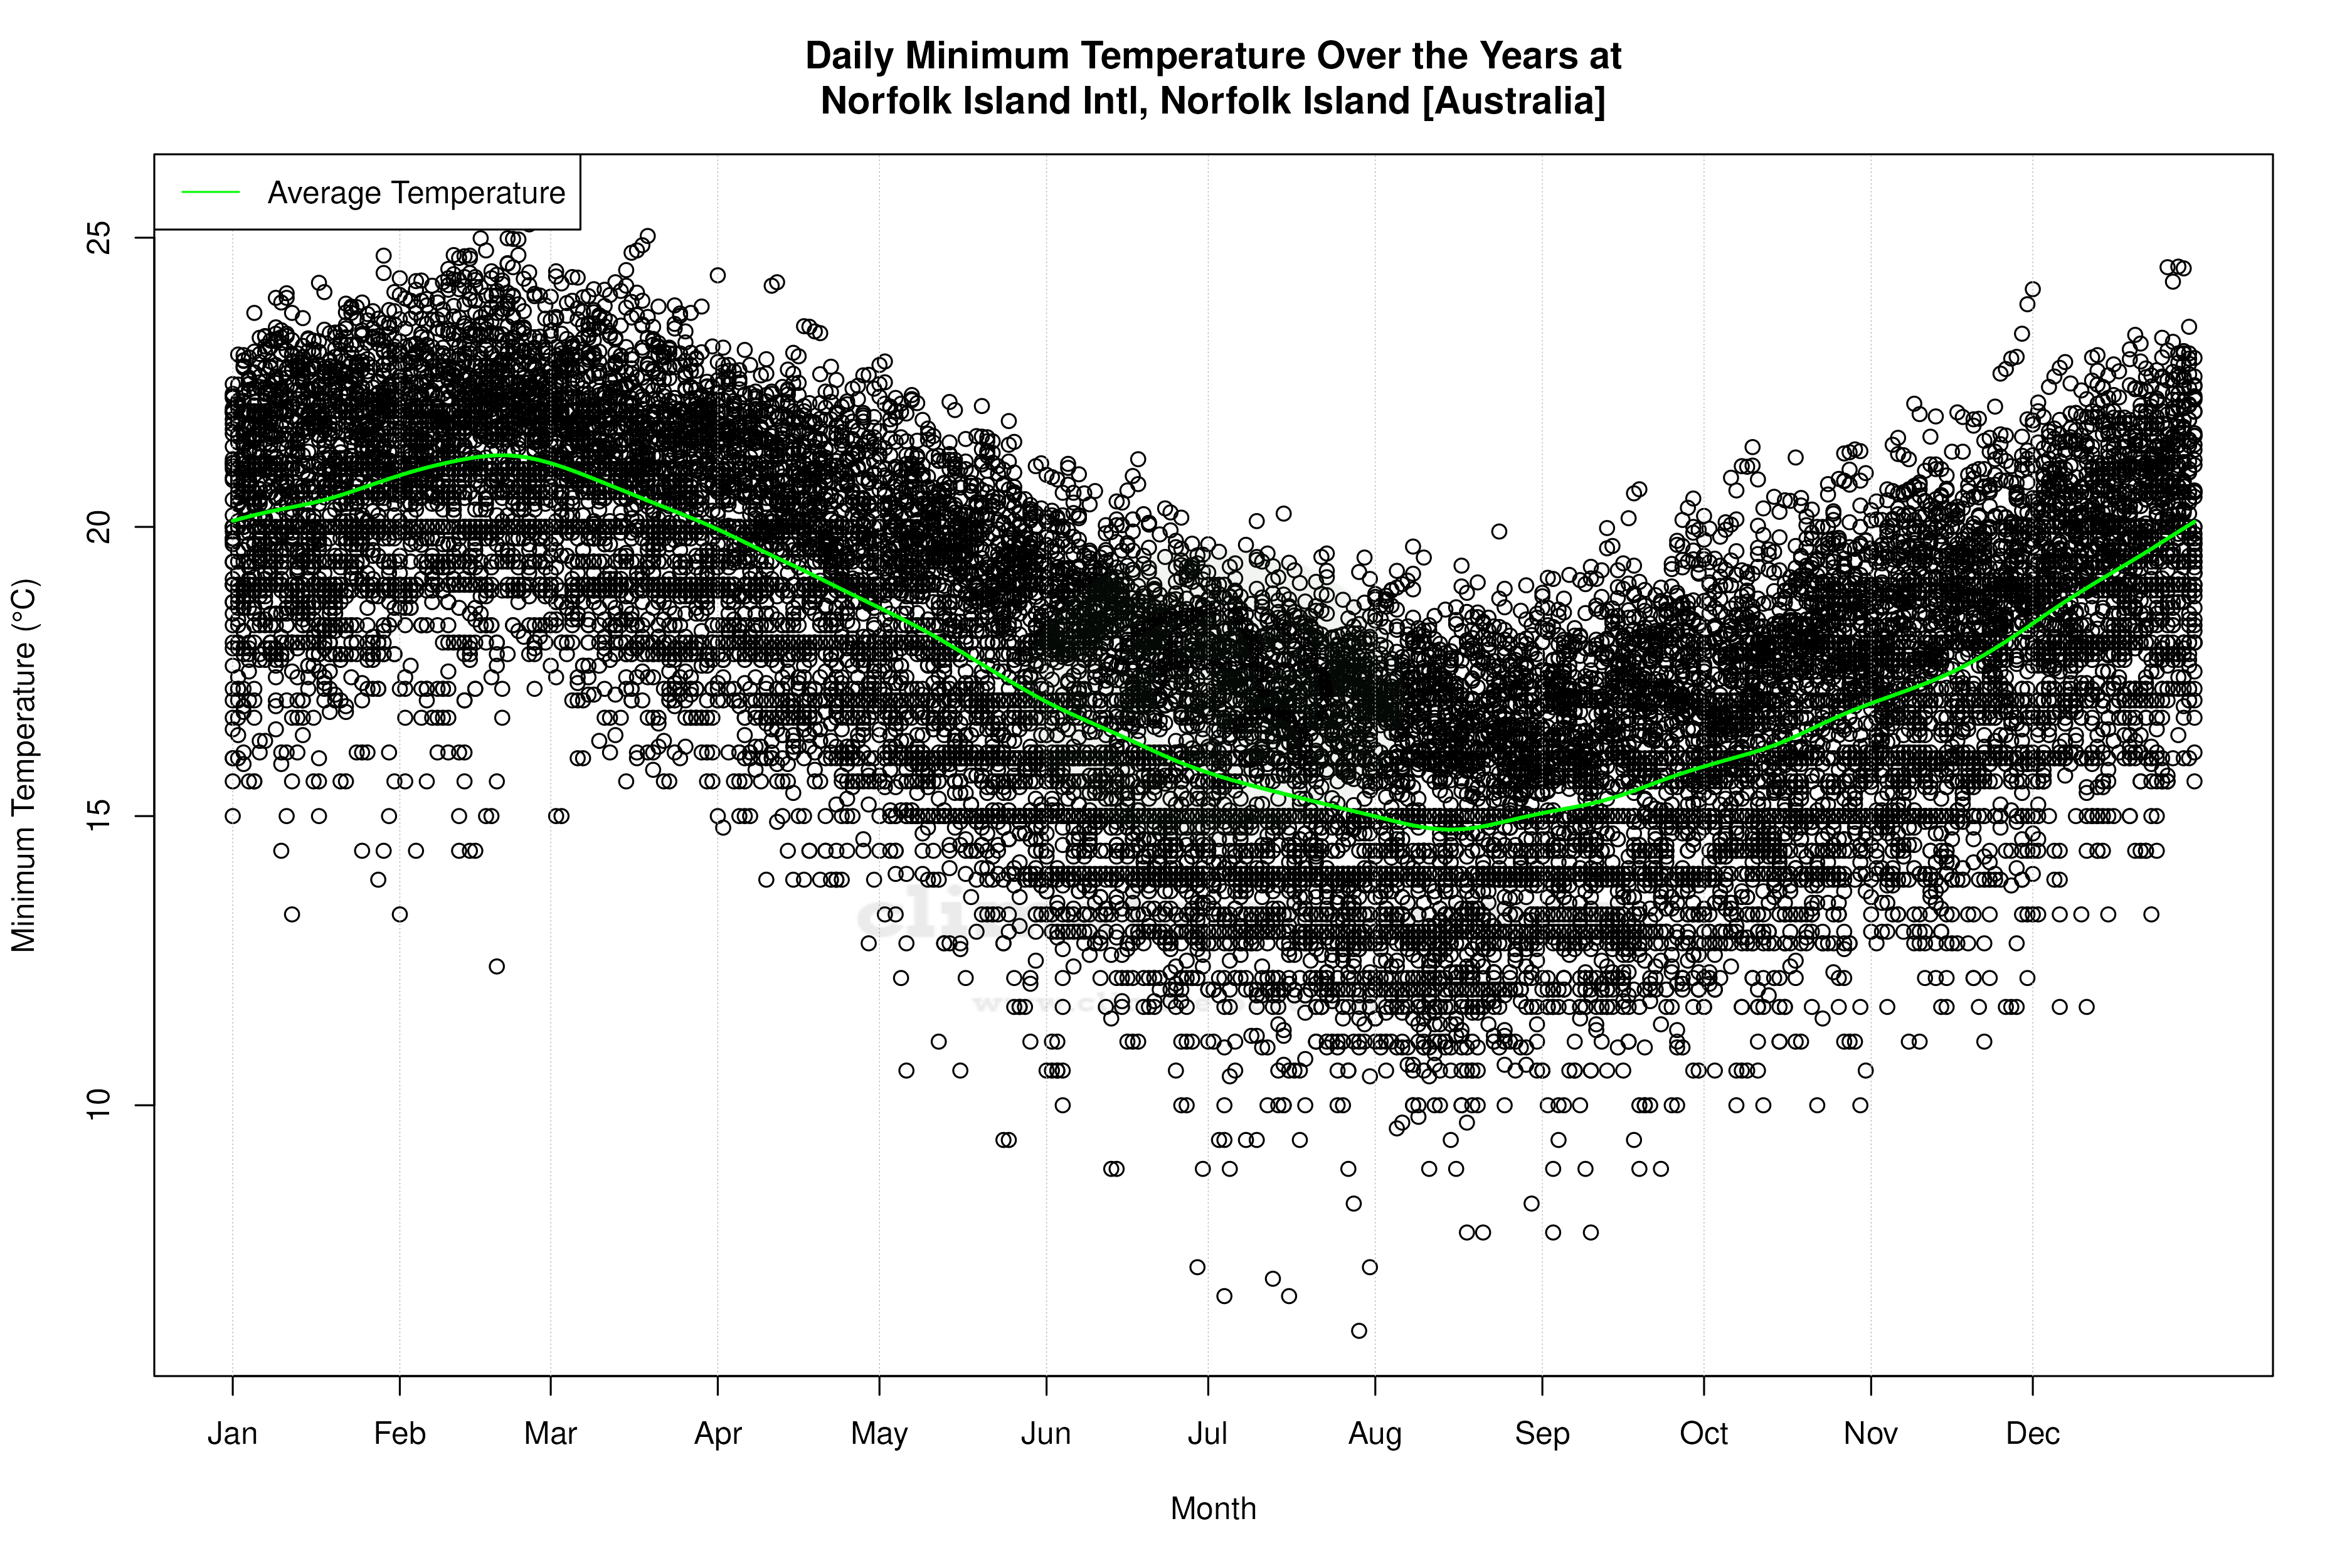
Norfolk Island, situated in the South Pacific Ocean, is classified under the Köppen climate system as a Cfa climate—temperate with no dry season and a warm summer. The island's geographical position, surrounded by ocean, moderates its climate, preventing extreme temperature fluctuations. This maritime influence is evident in the island's temperature records, with a recorded maximum high of 28.5°C (83.3°F) and a minimum low of 6.1°C (43.0°F). These figures reflect the island's moderate climate, which is less prone to extremes due to its oceanic surroundings.
Temperature Trends: A Mixed Picture
Over the long term, Norfolk Island has experienced a modest warming trend. The all-time high temperatures have risen by 0.06°C (0.11°F), while the lows have increased by 0.05°C (0.09°F). However, the past decade reveals a more dynamic picture, with high temperatures rising by 0.86°C (1.55°F), indicating a more pronounced warming trend. In contrast, the low temperatures have slightly decreased by 0.14°C (0.25°F) over the same period. This divergence between highs and lows suggests a complex interaction of local and regional climatic factors.
Precipitation Patterns: Towards Even Distribution
The Precipitation Concentration Index (PCI) provides insight into rainfall distribution. Norfolk Island's PCI has decreased from a baseline of 13.4 to a current value of 10.4, indicating a shift towards more evenly distributed precipitation events. This change suggests that rainfall is becoming less concentrated in intense downpours, which could have implications for water management and agricultural practices on the island.
Regional Climate Goals and Recent Weather Events
Australia's regional climate goals aim to enhance resilience to climate change impacts, including those affecting Norfolk Island. Recent weather events, such as cyclones in the broader Pacific region, underscore the importance of understanding local climate dynamics. The observed warming trend, particularly in high temperatures, aligns with broader regional patterns of climate change, necessitating adaptive strategies to mitigate potential impacts on the island's ecosystem and infrastructure.
Implications of Climatic Shifts
The nuanced changes in Norfolk Island's climate, with warming high temperatures and more evenly distributed precipitation, present both challenges and opportunities. These shifts could affect local biodiversity, agriculture, and water resources. Understanding these trends is crucial for developing effective climate adaptation strategies that align with regional goals and ensure the island's resilience in the face of ongoing climatic changes.
Station Statistics
10-Year Trend
High: +1.61 °F/decade
Low: +0.10 °F/decade
Rain: +0.007 in/decade
25-Year Trend
High: +1.04 °F/decade
Low: -0.90 °F/decade
Rain: -0.000 in/decade
50-Year Trend
High: +0.67 °F/decade
Low: -1.32 °F/decade
Rain: -0.013 in/decade
All-Time Trend
High: +0.05 °F/decade
Low: +0.05 °F/decade
Rain: -0.009 in/decade
Percentage Above-Average Days
Last 12 Months: 62.2%
This Year: 65.7%
Precipitation Concentration Index (PCI) ℹ️
Last 12 Months: 10.4
Historical Average: 11.6
Percentile Rank of Last 12 Months ℹ️
High: 96th percentile
Low: 48th percentile
Rain: 17th percentile
Change in Variance ℹ️
High: +26.0%
Low: -5.1%
Intraday: -45.7%
Data Coverage
70.5%
First Year of Data
1949
Station Location
Historical Weather Records
| Max High | Avg High | Min High | Max Avg | Avg Avg | Min Avg | Max Low | Avg Low | Min Low | Max Precipitation | Avg Precipitation | Max Snow | Avg Snow | |
|---|---|---|---|---|---|---|---|---|---|---|---|---|---|
| Record | 83.30 °F | — | 57.20 °F | 82.04 °F | — | 52.16 °F | 78.19 °F | — | 42.98 °F | 7.17 in | — | — | — |
| January | 83.30 °F | 74.93 °F | 67.28 °F | 82.04 °F | 71.30 °F | 64.40 °F | 76.44 °F | 68.79 °F | 55.94 °F | 4.09 in | 0.11 in | — | — |
| February | 82.94 °F | 75.87 °F | 69.33 °F | 78.08 °F | 72.14 °F | 65.84 °F | 78.19 °F | 70.10 °F | 54.32 °F | 7.17 in | 0.11 in | — | — |
| March | 82.76 °F | 74.85 °F | 68.72 °F | 78.44 °F | 71.03 °F | 64.58 °F | 77.05 °F | 69.06 °F | 59.00 °F | 3.62 in | 0.10 in | — | — |
| April | 80.60 °F | 72.56 °F | 66.11 °F | 75.74 °F | 68.62 °F | 59.36 °F | 75.83 °F | 66.82 °F | 55.04 °F | 4.49 in | 0.13 in | — | — |
| May | 77.18 °F | 69.71 °F | 62.60 °F | 72.75 °F | 65.78 °F | 56.84 °F | 73.15 °F | 64.21 °F | 48.92 °F | 6.65 in | 0.14 in | — | — |
| June | 74.12 °F | 66.92 °F | 59.00 °F | 70.99 °F | 63.02 °F | 52.16 °F | 70.29 °F | 61.50 °F | 44.96 °F | 4.21 in | 0.14 in | — | — |
| July | 72.14 °F | 65.17 °F | 59.00 °F | 73.94 °F | 61.22 °F | 52.70 °F | 68.41 °F | 59.76 °F | 42.98 °F | 4.25 in | 0.14 in | — | — |
| August | 71.60 °F | 64.74 °F | 57.20 °F | 68.09 °F | 60.77 °F | 53.96 °F | 67.86 °F | 58.75 °F | 46.04 °F | 3.85 in | 0.12 in | — | — |
| September | 74.12 °F | 65.76 °F | 60.01 °F | 69.62 °F | 61.89 °F | 54.50 °F | 69.17 °F | 59.73 °F | 46.04 °F | 2.87 in | 0.09 in | — | — |
| October | 76.10 °F | 67.69 °F | 61.23 °F | 76.10 °F | 63.85 °F | 57.56 °F | 70.48 °F | 61.42 °F | 50.00 °F | 3.06 in | 0.09 in | — | — |
| November | 80.60 °F | 70.08 °F | 62.78 °F | 75.56 °F | 66.29 °F | 59.00 °F | 71.83 °F | 63.47 °F | 51.98 °F | 3.23 in | 0.10 in | — | — |
| December | 82.04 °F | 73.03 °F | 65.77 °F | 77.00 °F | 69.33 °F | 60.08 °F | 76.10 °F | 66.59 °F | 53.06 °F | 4.45 in | 0.11 in | — | — |
Data Visualisations
Remove WatermarksCurrent Year Climate Trends vs Historical


Max Temperature this Year | 1 of 6
Climate 12-Month Moving Averages


Max Temperature 12-Month MA | 1 of 6
Daily Data Points and Averages Throughout the Year


Average Max Temperature Throughout Year | 1 of 5
