Climate for Station: N'guigni, Diffa, Niger
Loading live weather...
Climate Analysis & Overview
N'guigmi, located in the arid region of Niger, is experiencing a complex climate narrative. While long-term data suggests a warming trend, recent years have shown a cooling in maximum temperatures. The increasing concentration of precipitation events poses challenges for local agriculture and water management.
Köppen Climate and Geographical Influence
N'guigmi, situated at 14.25°N, 13.12°E, falls under the BWh classification of the Köppen climate system, indicative of a hot desert climate. This region is characterised by extremely high temperatures and minimal rainfall. The local geography, with its flat terrain and proximity to Lake Chad, influences the area's climate by contributing to high evaporation rates and limited moisture retention. The absence of significant geographical barriers, such as mountains, allows for the uninhibited flow of hot, dry air, exacerbating the arid conditions.
Temperature Trends: A Tale of Two Directions
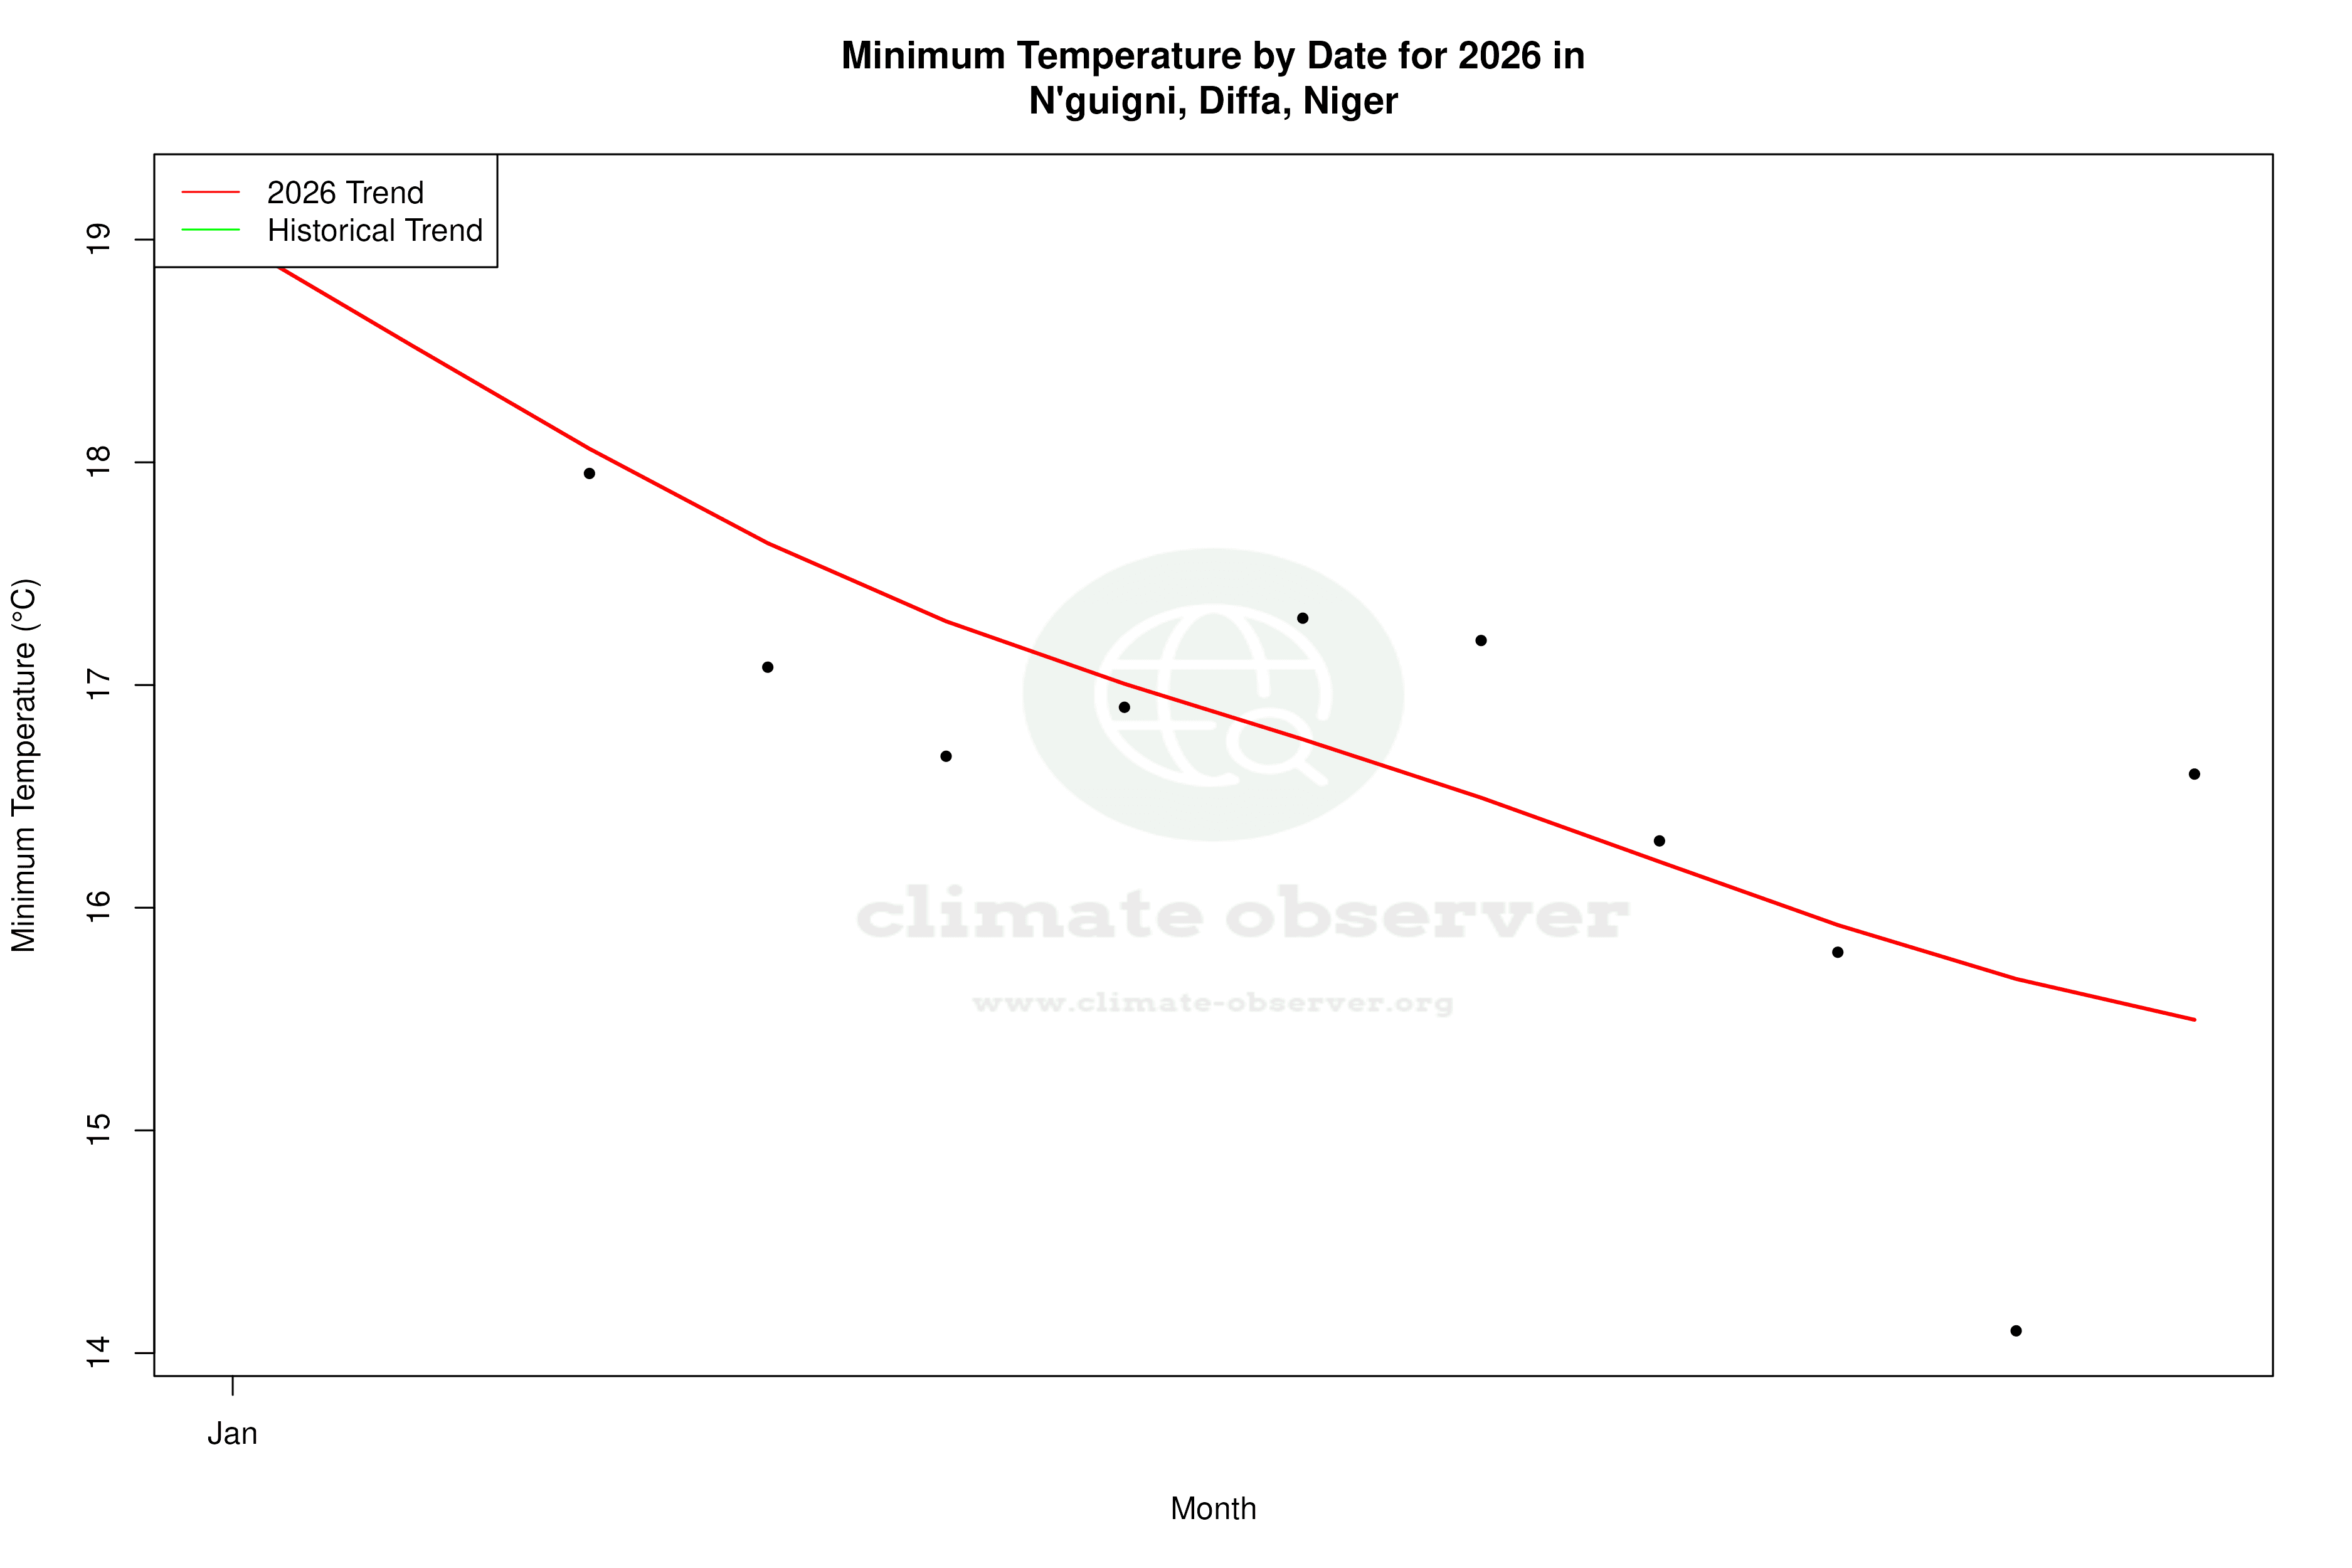
The all-time temperature trends for N'guigmi reveal a warming pattern. Maximum temperatures have risen by 0.52°C (0.94°F), while minimum temperatures have increased by 0.14°C (0.25°F). However, the past decade tells a different story, with a cooling trend in highs by -0.51°C (-0.92°F), contrasting with a slight warming in lows by 0.09°C (0.16°F). This divergence suggests a complex interplay of factors influencing short-term and long-term temperature patterns, possibly linked to regional weather phenomena or anthropogenic influences.
Precipitation Patterns: Increasing Concentration
The Precipitation Concentration Index (PCI) for N'guigmi has shown a significant increase from a baseline of 35.4 to a current value of 44.0. This indicates that rainfall is becoming more concentrated in fewer, more intense events. Such a shift can lead to challenges in water resource management, as the region may experience longer dry spells interrupted by heavy downpours, impacting agriculture and increasing the risk of flooding.
Record Extremes: A Climate of Contrasts
N'guigmi's climate is marked by extreme temperature records, with an all-time high of 50.8°C (123.4°F) and a low of 0.6°C (33.1°F). These extremes highlight the harshness of the desert climate, where temperatures can swing dramatically between day and night. Such variability poses challenges for both human habitation and ecological systems, requiring adaptive strategies to manage the impacts of these extremes.
Regional Climate Goals and Challenges
Niger's climate goals focus on enhancing resilience to climate change, particularly in its arid regions. The increasing concentration of precipitation events in N'guigmi underscores the need for improved water management strategies and infrastructure to mitigate the impacts of climate variability. Recent weather events, such as intense heatwaves and sporadic heavy rains, further highlight the urgency of these initiatives.
Station Statistics
10-Year Trend
High: -1.12 °F/decade
Low: +0.49 °F/decade
Rain: +0.014 in/decade
25-Year Trend
High: -0.14 °F/decade
Low: +0.48 °F/decade
Rain: +0.006 in/decade
50-Year Trend
High: +0.36 °F/decade
Low: +0.42 °F/decade
Rain: +0.002 in/decade
All-Time Trend
High: +0.98 °F/decade
Low: +0.30 °F/decade
Rain: +0.001 in/decade
Percentage Above-Average Days
Last 12 Months: 53.9%
This Year: 70.5%
Precipitation Concentration Index (PCI) ℹ️
Last 12 Months: 36.7
Historical Average: 37.5
Percentile Rank of Last 12 Months ℹ️
High: 55th percentile
Low: 89th percentile
Rain: 55th percentile
Change in Variance ℹ️
High: -4.8%
Low: +0.7%
Intraday: -13.7%
Data Coverage
79.6%
First Year of Data
1926
Station Location
Historical Weather Records
| Max High | Avg High | Min High | Max Avg | Avg Avg | Min Avg | Max Low | Avg Low | Min Low | Max Precipitation | Avg Precipitation | Max Snow | Avg Snow | |
|---|---|---|---|---|---|---|---|---|---|---|---|---|---|
| Record | 123.44 °F | — | 59.00 °F | 104.90 °F | — | 53.96 °F | 91.38 °F | — | 33.08 °F | 4.18 in | — | — | — |
| January | 105.44 °F | 84.44 °F | 59.00 °F | 91.40 °F | 70.90 °F | 53.96 °F | 71.60 °F | 55.46 °F | 36.68 °F | 0.01 in | 0.00 in | — | — |
| February | 113.00 °F | 89.62 °F | 60.80 °F | 94.10 °F | 75.86 °F | 58.82 °F | 78.80 °F | 59.76 °F | 33.08 °F | 0.31 in | 0.00 in | — | — |
| March | 113.90 °F | 97.42 °F | 68.00 °F | 99.32 °F | 84.02 °F | 66.56 °F | 85.28 °F | 67.55 °F | 48.20 °F | 3.93 in | 0.00 in | — | — |
| April | 123.44 °F | 103.51 °F | 84.20 °F | 103.64 °F | 91.11 °F | 76.28 °F | 88.88 °F | 73.80 °F | 55.22 °F | 0.61 in | 0.00 in | — | — |
| May | 120.20 °F | 105.80 °F | 86.90 °F | 104.90 °F | 93.76 °F | 79.34 °F | 91.38 °F | 77.11 °F | 53.60 °F | 3.46 in | 0.01 in | — | — |
| June | 118.40 °F | 104.24 °F | 81.50 °F | 104.36 °F | 92.78 °F | 78.98 °F | 89.94 °F | 78.24 °F | 61.16 °F | 2.28 in | 0.02 in | — | — |
| July | 117.32 °F | 98.74 °F | 77.72 °F | 101.12 °F | 88.32 °F | 75.20 °F | 88.70 °F | 77.37 °F | 58.82 °F | 3.93 in | 0.09 in | — | — |
| August | 110.12 °F | 94.66 °F | 73.40 °F | 96.98 °F | 85.29 °F | 73.58 °F | 86.90 °F | 75.47 °F | 59.00 °F | 4.18 in | 0.16 in | — | — |
| September | 111.56 °F | 98.55 °F | 78.98 °F | 97.88 °F | 87.37 °F | 75.74 °F | 86.90 °F | 75.00 °F | 58.10 °F | 1.42 in | 0.04 in | — | — |
| October | 119.66 °F | 99.34 °F | 82.40 °F | 97.52 °F | 86.93 °F | 73.76 °F | 87.80 °F | 71.37 °F | 55.04 °F | 0.39 in | 0.00 in | — | — |
| November | 109.40 °F | 92.73 °F | 68.00 °F | 93.74 °F | 79.47 °F | 63.86 °F | 80.24 °F | 63.99 °F | 34.70 °F | 0.39 in | 0.00 in | — | — |
| December | 104.00 °F | 86.08 °F | 68.00 °F | 88.52 °F | 72.36 °F | 55.94 °F | 74.48 °F | 57.13 °F | 36.50 °F | 0.00 in | 0.00 in | — | — |
Data Visualisations
Remove WatermarksCurrent Year Climate Trends vs Historical


Max Temperature this Year | 1 of 6
Climate 12-Month Moving Averages


Max Temperature 12-Month MA | 1 of 6
Daily Data Points and Averages Throughout the Year


Average Max Temperature Throughout Year | 1 of 5
