Climate for Station: Den Helder-1, North Holland, Netherlands
Loading live weather...
Climate Analysis & Overview
Den Helder-1 is experiencing a warming trend, with both high and low temperatures rising over the past decade and all-time records. The precipitation pattern has become slightly more evenly distributed, indicating a subtle shift in local climate dynamics.
Coastal Climate Dynamics
Den Helder, located at coordinates 52.9331, 4.75, is characterised by a temperate maritime climate, known as Cfb in the Köppen classification. This coastal city in Noord-Holland is influenced by the North Sea, which moderates temperature fluctuations and contributes to relatively high humidity levels. The all-time temperature trends reveal a consistent warming pattern, with highs increasing by 0.21°C (0.38°F) and lows by 0.20°C (0.37°F). This warming trend aligns with regional climate objectives focused on understanding and mitigating climate change impacts.
Decadal Temperature Trends
Over the past decade, Den Helder-1 has experienced more pronounced warming, with high temperatures rising by 0.64°C (1.15°F) and lows by 0.62°C (1.12°F). These figures suggest a more accelerated warming in recent years compared to the long-term trend. The relatively rapid increase in temperatures over the last ten years could be attributed to several factors, including changes in atmospheric circulation patterns and increased urbanisation, which can amplify local heat effects.
Precipitation Patterns
The Precipitation Concentration Index (PCI) for Den Helder-1 shows a slight decrease from a baseline of 11.37 to a current value of 11.33. This marginal change indicates that precipitation is becoming slightly more evenly distributed throughout the year, rather than being concentrated in fewer, more intense events. For a region that already experiences frequent rainfall, this subtle shift could have implications for water management and flood prevention strategies.
Extreme Temperature Records
Den Helder-1's climate records highlight the potential for extreme temperatures, with a maximum recorded temperature of 34.5°C (94.1°F) and a minimum of -18.8°C (-1.8°F). These extremes underscore the variability inherent in the region's climate, which can occasionally deviate significantly from the moderate conditions typically expected in a maritime climate. Understanding these extremes is crucial for preparing for potential impacts on infrastructure and ecosystems.
Regional Climate Context
Den Helder's climate profile is part of a broader regional trend observed across the Netherlands, where efforts are underway to adapt to and mitigate the effects of climate change. The observed warming trends and slight changes in precipitation distribution provide valuable insights for policymakers and researchers working towards sustainable climate solutions. As the country continues to experience shifts in weather patterns, the data from stations like Den Helder-1 will be instrumental in shaping future climate resilience strategies.
Station Statistics
10-Year Trend
High: +0.87 °F/decade
Low: +1.23 °F/decade
Rain: +0.015 in/decade
25-Year Trend
High: +0.79 °F/decade
Low: +0.61 °F/decade
Rain: +0.005 in/decade
50-Year Trend
High: +0.87 °F/decade
Low: +0.78 °F/decade
Rain: +0.004 in/decade
All-Time Trend
High: +0.38 °F/decade
Low: +0.38 °F/decade
Rain: +0.001 in/decade
Percentage Above-Average Days
Last 12 Months: 55.5%
This Year: 57.7%
Precipitation Concentration Index (PCI) ℹ️
Last 12 Months: 11.3
Historical Average: 11.3
Percentile Rank of Last 12 Months ℹ️
High: 95th percentile
Low: 94th percentile
Rain: 52nd percentile
Change in Variance ℹ️
High: -6.4%
Low: -11.1%
Intraday: -2.5%
Data Coverage
66.7%
First Year of Data
1850
Station Location
Historical Weather Records
| Max High | Avg High | Min High | Max Avg | Avg Avg | Min Avg | Max Low | Avg Low | Min Low | Max Precipitation | Avg Precipitation | Max Snow | Avg Snow | |
|---|---|---|---|---|---|---|---|---|---|---|---|---|---|
| Record | 94.10 °F | — | 12.02 °F | 84.02 °F | — | 11.12 °F | 72.50 °F | — | -1.84 °F | 3.28 in | — | — | — |
| January | 56.66 °F | 40.95 °F | 12.92 °F | 52.70 °F | 38.84 °F | 12.02 °F | 51.08 °F | 33.22 °F | -1.84 °F | 1.42 in | 0.08 in | — | — |
| February | 62.96 °F | 41.24 °F | 13.28 °F | 55.58 °F | 38.55 °F | 11.12 °F | 50.90 °F | 32.78 °F | 0.32 °F | 1.39 in | 0.06 in | — | — |
| March | 68.90 °F | 45.73 °F | 22.10 °F | 56.84 °F | 42.25 °F | 23.36 °F | 49.64 °F | 35.64 °F | 5.36 °F | 2.11 in | 0.06 in | — | — |
| April | 79.16 °F | 51.53 °F | 31.28 °F | 66.38 °F | 47.13 °F | 33.26 °F | 58.28 °F | 40.08 °F | 22.82 °F | 1.17 in | 0.05 in | — | — |
| May | 87.80 °F | 58.76 °F | 42.98 °F | 71.78 °F | 53.81 °F | 39.02 °F | 64.22 °F | 46.32 °F | 24.80 °F | 2.32 in | 0.05 in | — | — |
| June | 89.06 °F | 63.78 °F | 48.92 °F | 77.00 °F | 58.99 °F | 43.88 °F | 68.00 °F | 51.46 °F | 31.46 °F | 1.51 in | 0.06 in | — | — |
| July | 94.10 °F | 67.30 °F | 54.68 °F | 84.02 °F | 62.87 °F | 52.88 °F | 72.32 °F | 55.34 °F | 39.56 °F | 3.14 in | 0.08 in | — | — |
| August | 91.40 °F | 67.85 °F | 56.30 °F | 79.34 °F | 63.51 °F | 52.70 °F | 72.50 °F | 55.75 °F | 39.02 °F | 2.77 in | 0.10 in | — | — |
| September | 86.54 °F | 63.88 °F | 48.56 °F | 76.10 °F | 59.29 °F | 45.68 °F | 69.62 °F | 52.30 °F | 33.62 °F | 2.15 in | 0.11 in | — | — |
| October | 77.18 °F | 56.67 °F | 36.68 °F | 67.64 °F | 52.88 °F | 36.14 °F | 62.06 °F | 46.41 °F | 21.20 °F | 1.81 in | 0.11 in | — | — |
| November | 64.22 °F | 48.40 °F | 23.18 °F | 59.90 °F | 45.89 °F | 24.08 °F | 56.66 °F | 39.79 °F | 10.58 °F | 1.50 in | 0.11 in | — | — |
| December | 59.54 °F | 43.23 °F | 12.02 °F | 54.50 °F | 41.12 °F | 18.32 °F | 52.52 °F | 35.40 °F | 7.88 °F | 3.28 in | 0.09 in | — | — |
Data Visualisations
Remove WatermarksCurrent Year Climate Trends vs Historical


Max Temperature this Year | 1 of 6
Climate 12-Month Moving Averages


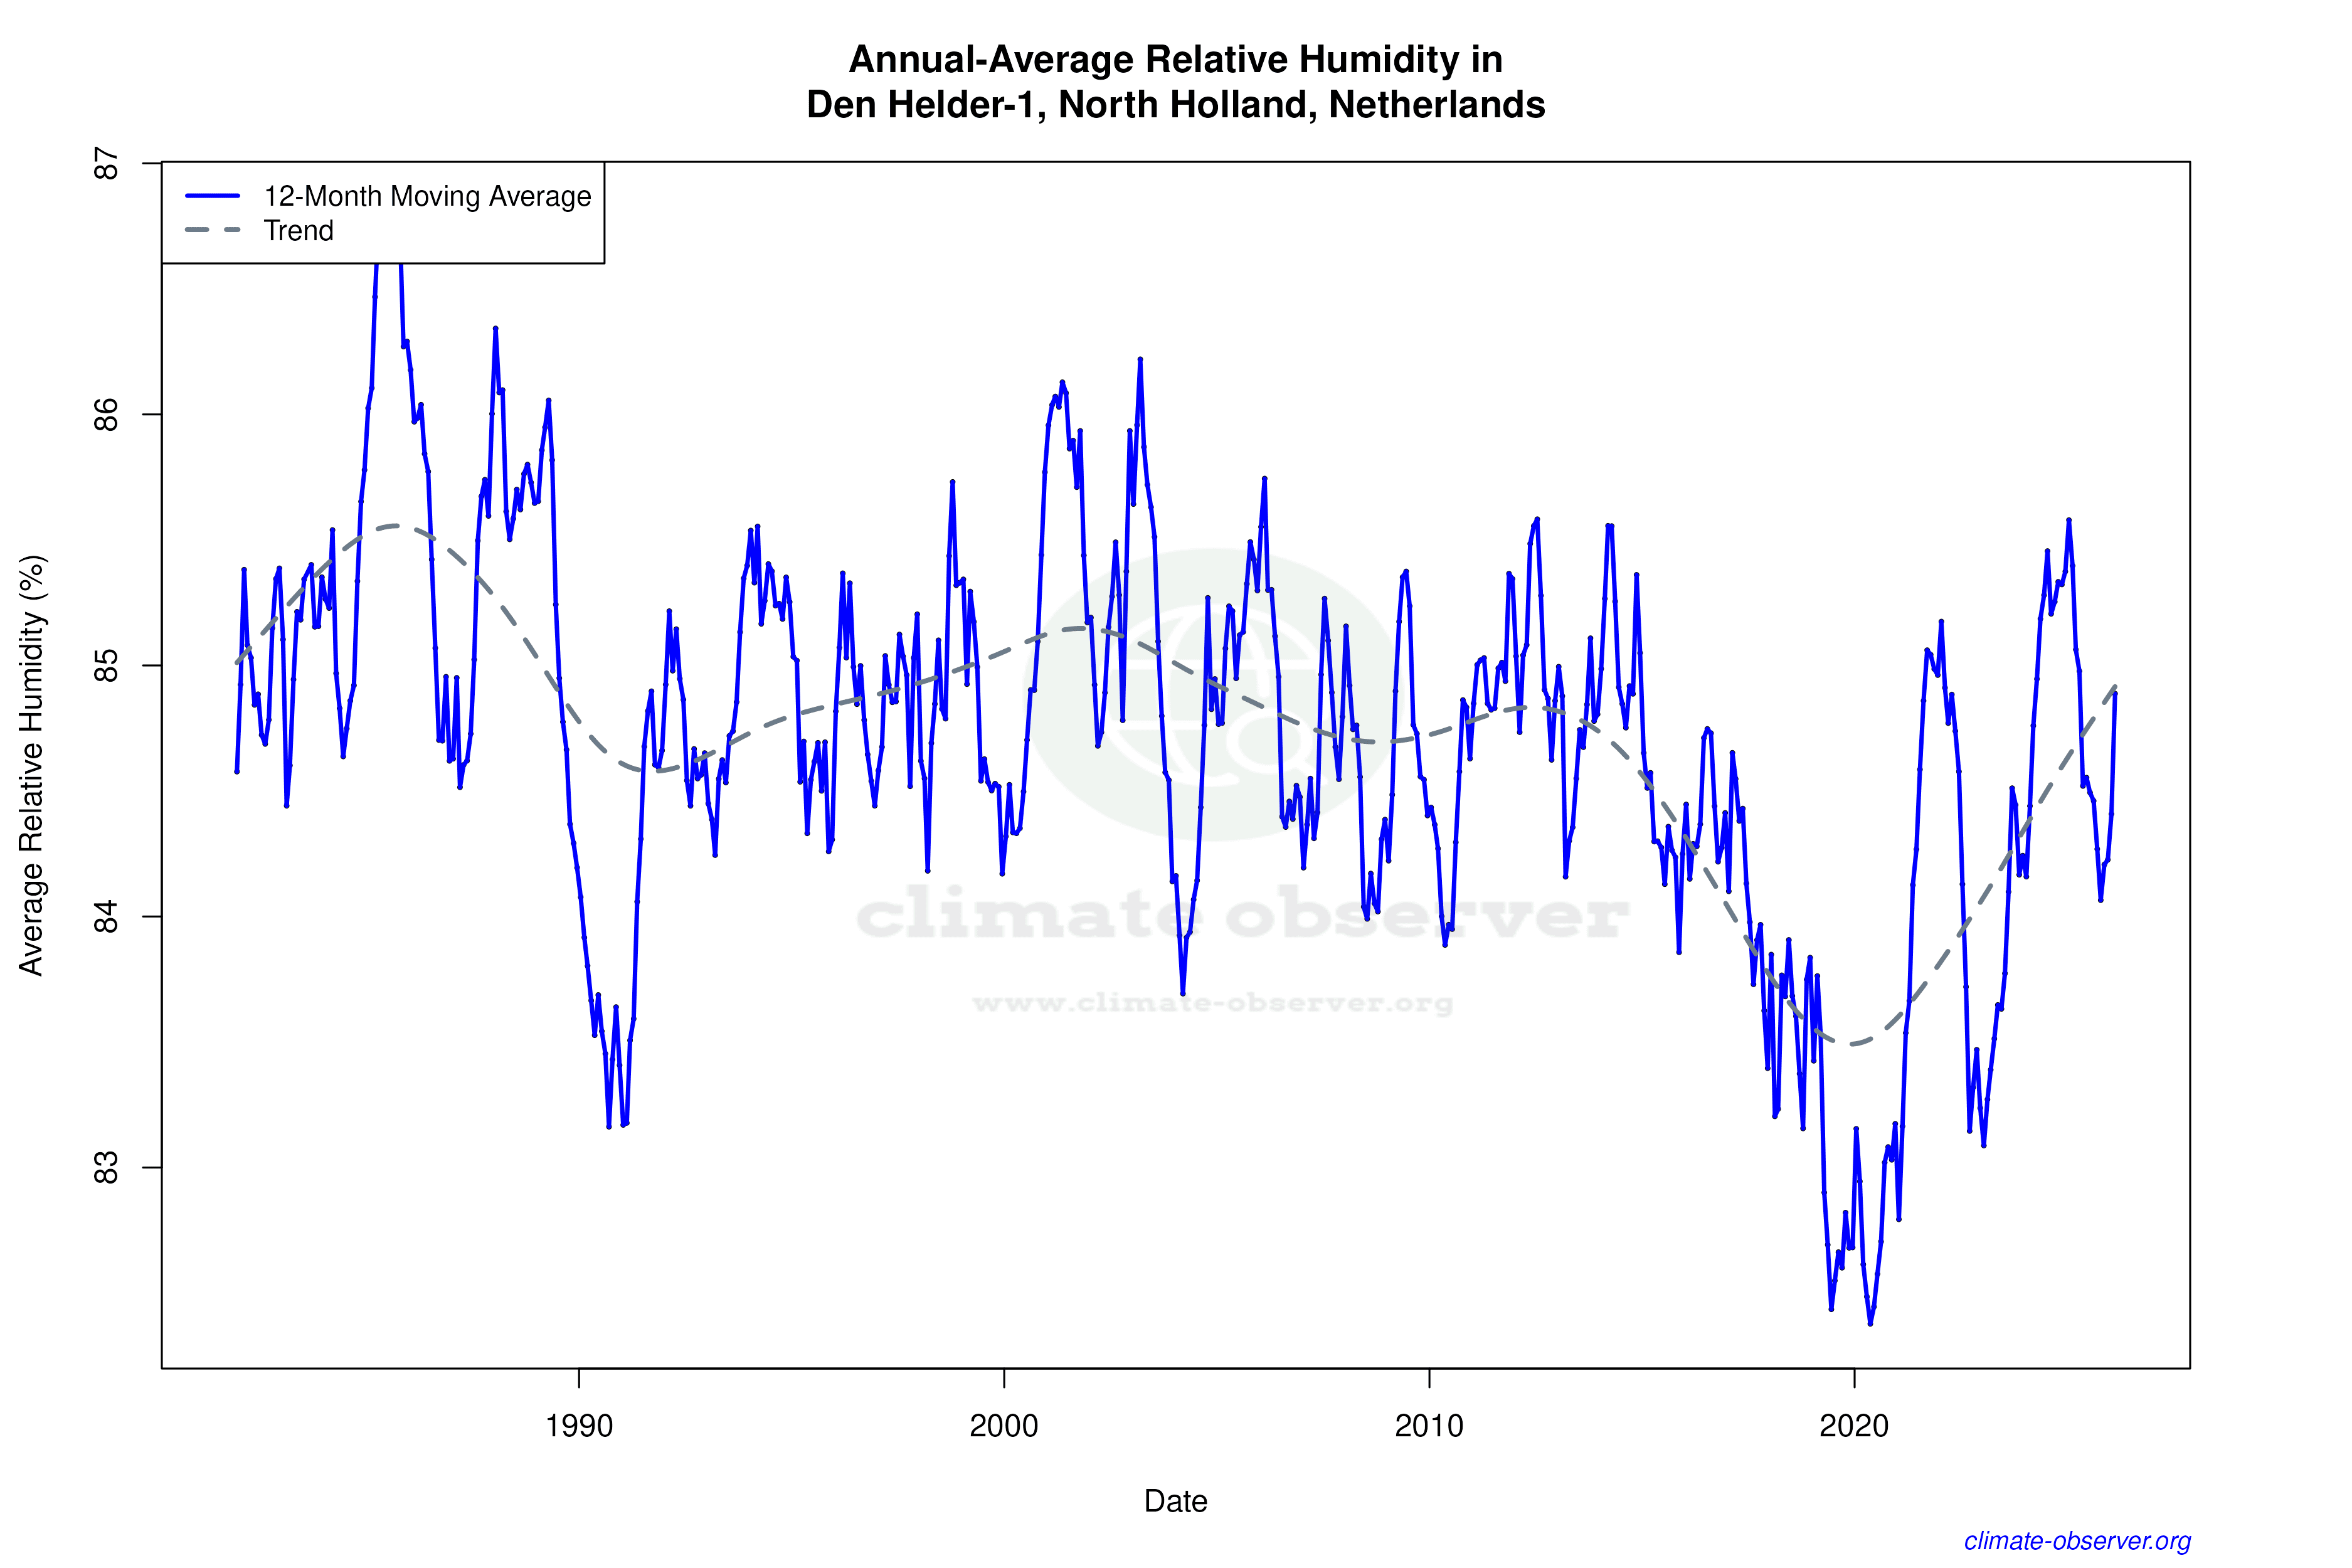

Max Temperature 12-Month MA | 1 of 6
Daily Data Points and Averages Throughout the Year


Average Max Temperature Throughout Year | 1 of 5
