Climate for Station: Bjoernoeya, Svalbard, Norway
Loading live weather...
Climate Analysis & Overview
Bjoernoeya, located in the Arctic realm of Svalbard, is experiencing a complex climate narrative marked by contrasting temperature trends and evolving precipitation patterns. While all-time highs show a 0.28°C (0.50°F) warming, recent lows indicate a 1.26°C (2.27°F) cooling over the past decade, highlighting a nuanced climatic shift.
Arctic Temperature Dynamics
Bjoernoeya, situated at latitude 74.5167°N and longitude 19.0167°E, falls under the Köppen climate classification of ET, or tundra climate, characterised by cold temperatures and limited vegetation. The island's geographical position in the Arctic Ocean subjects it to polar influences, where the interplay of oceanic and atmospheric currents creates a unique thermal environment. The all-time temperature trend indicates a warming of 0.28°C (0.50°F) for highs, suggesting a gradual rise in peak temperatures. Conversely, a notable cooling of 1.26°C (2.27°F) in lows over the last decade signifies a complex thermal oscillation, potentially influenced by shifting sea ice patterns and ocean currents.
Precipitation Patterns: A Shift Towards Evenness
The Precipitation Concentration Index (PCI) for Bjoernoeya has decreased from a baseline of 10.80 to a current value of 9.55. This change suggests that precipitation is now more evenly distributed throughout the year, as opposed to being concentrated in fewer, intense events. In the context of climate adaptation, this marginal shift towards more evenly distributed precipitation could influence local hydrology and ecosystem dynamics, potentially affecting water availability and vegetation growth.
Temperature Extremes and Records
Bjoernoeya's recorded temperature extremes reflect the harshness of its climate. The highest recorded temperature is 21.0°C (69.8°F), while the lowest plunges to -31.6°C (-24.9°F). These extremes underscore the island's vulnerability to both warming events and severe cold spells, which can have profound impacts on the local environment and biodiversity.
Regional Climate Implications
The contrasting temperature trends observed in Bjoernoeya are indicative of broader climatic shifts in the Arctic region. Norway's climate goals, which focus on reducing greenhouse gas emissions and enhancing resilience to climate change, provide a backdrop to these local changes. The observed warming in all-time highs aligns with global warming trends, while the recent cooling of lows may reflect localised phenomena such as increased ice cover or altered atmospheric circulation patterns. These dynamics are crucial for understanding the future trajectory of Arctic climates and their global implications.
Impacts on Local Ecosystems
The climatic changes in Bjoernoeya have significant implications for its local ecosystems. The shift towards more evenly distributed precipitation, coupled with the warming in highs, could alter the habitat conditions for Arctic flora and fauna. These changes may influence species distribution, migration patterns, and overall biodiversity, highlighting the importance of ongoing monitoring and research in this remote yet ecologically significant region.
Station Statistics
10-Year Trend
High: +0.81 °F/decade
Low: -1.08 °F/decade
Rain: -0.001 in/decade
25-Year Trend
High: +0.81 °F/decade
Low: +0.79 °F/decade
Rain: +0.001 in/decade
50-Year Trend
High: +1.11 °F/decade
Low: +1.42 °F/decade
Rain: +0.003 in/decade
All-Time Trend
High: +0.51 °F/decade
Low: +0.45 °F/decade
Rain: +0.001 in/decade
Percentage Above-Average Days
Last 12 Months: 68.8%
This Year: 31.5%
Precipitation Concentration Index (PCI) ℹ️
Last 12 Months: 11.2
Historical Average: 11.0
Percentile Rank of Last 12 Months ℹ️
High: 96th percentile
Low: 91st percentile
Rain: 85th percentile
Change in Variance ℹ️
High: -23.4%
Low: -30.7%
Intraday: -32.7%
Data Coverage
74.5%
First Year of Data
1910
Station Location
Historical Weather Records
| Max High | Avg High | Min High | Max Avg | Avg Avg | Min Avg | Max Low | Avg Low | Min Low | Max Precipitation | Avg Precipitation | Max Snow | Avg Snow | |
|---|---|---|---|---|---|---|---|---|---|---|---|---|---|
| Record | 69.80 °F | — | -16.96 °F | 63.14 °F | — | -18.04 °F | 54.68 °F | — | -24.88 °F | 1.59 in | — | — | — |
| January | 41.54 °F | 25.69 °F | -11.38 °F | 39.74 °F | 22.35 °F | -14.08 °F | 38.48 °F | 16.17 °F | -21.64 °F | 0.93 in | 0.05 in | — | — |
| February | 40.82 °F | 25.46 °F | -16.96 °F | 39.02 °F | 22.01 °F | -17.32 °F | 37.22 °F | 15.24 °F | -24.34 °F | 0.81 in | 0.05 in | — | — |
| March | 43.16 °F | 25.27 °F | -15.34 °F | 37.76 °F | 21.99 °F | -18.04 °F | 37.04 °F | 14.68 °F | -24.88 °F | 1.27 in | 0.04 in | — | — |
| April | 46.58 °F | 28.19 °F | -1.12 °F | 41.72 °F | 25.15 °F | -6.34 °F | 39.00 °F | 18.85 °F | -14.08 °F | 0.70 in | 0.03 in | — | — |
| May | 59.00 °F | 33.72 °F | 8.60 °F | 49.82 °F | 31.32 °F | 11.84 °F | 45.14 °F | 27.57 °F | 0.14 °F | 1.59 in | 0.03 in | — | — |
| June | 66.20 °F | 39.47 °F | 25.34 °F | 53.96 °F | 36.83 °F | 24.44 °F | 52.70 °F | 33.49 °F | 16.88 °F | 0.82 in | 0.03 in | — | — |
| July | 69.80 °F | 44.43 °F | 31.10 °F | 62.24 °F | 41.22 °F | 29.66 °F | 53.78 °F | 37.65 °F | 23.54 °F | 1.21 in | 0.03 in | — | — |
| August | 67.64 °F | 44.60 °F | 33.44 °F | 63.14 °F | 41.83 °F | 32.00 °F | 54.68 °F | 38.36 °F | 27.68 °F | 1.24 in | 0.04 in | — | — |
| September | 59.90 °F | 40.92 °F | 24.26 °F | 54.68 °F | 38.71 °F | 27.14 °F | 50.90 °F | 35.37 °F | 13.28 °F | 1.23 in | 0.06 in | — | — |
| October | 52.88 °F | 35.45 °F | 11.48 °F | 47.48 °F | 32.91 °F | 10.58 °F | 45.50 °F | 29.12 °F | -1.30 °F | 0.91 in | 0.05 in | — | — |
| November | 47.12 °F | 31.00 °F | 0.14 °F | 42.62 °F | 28.17 °F | -5.08 °F | 39.56 °F | 23.56 °F | -13.18 °F | 1.06 in | 0.05 in | — | — |
| December | 43.52 °F | 27.49 °F | -11.92 °F | 39.56 °F | 23.60 °F | -14.44 °F | 41.54 °F | 18.82 °F | -18.58 °F | 0.97 in | 0.05 in | — | — |
Data Visualisations
Remove WatermarksCurrent Year Climate Trends vs Historical


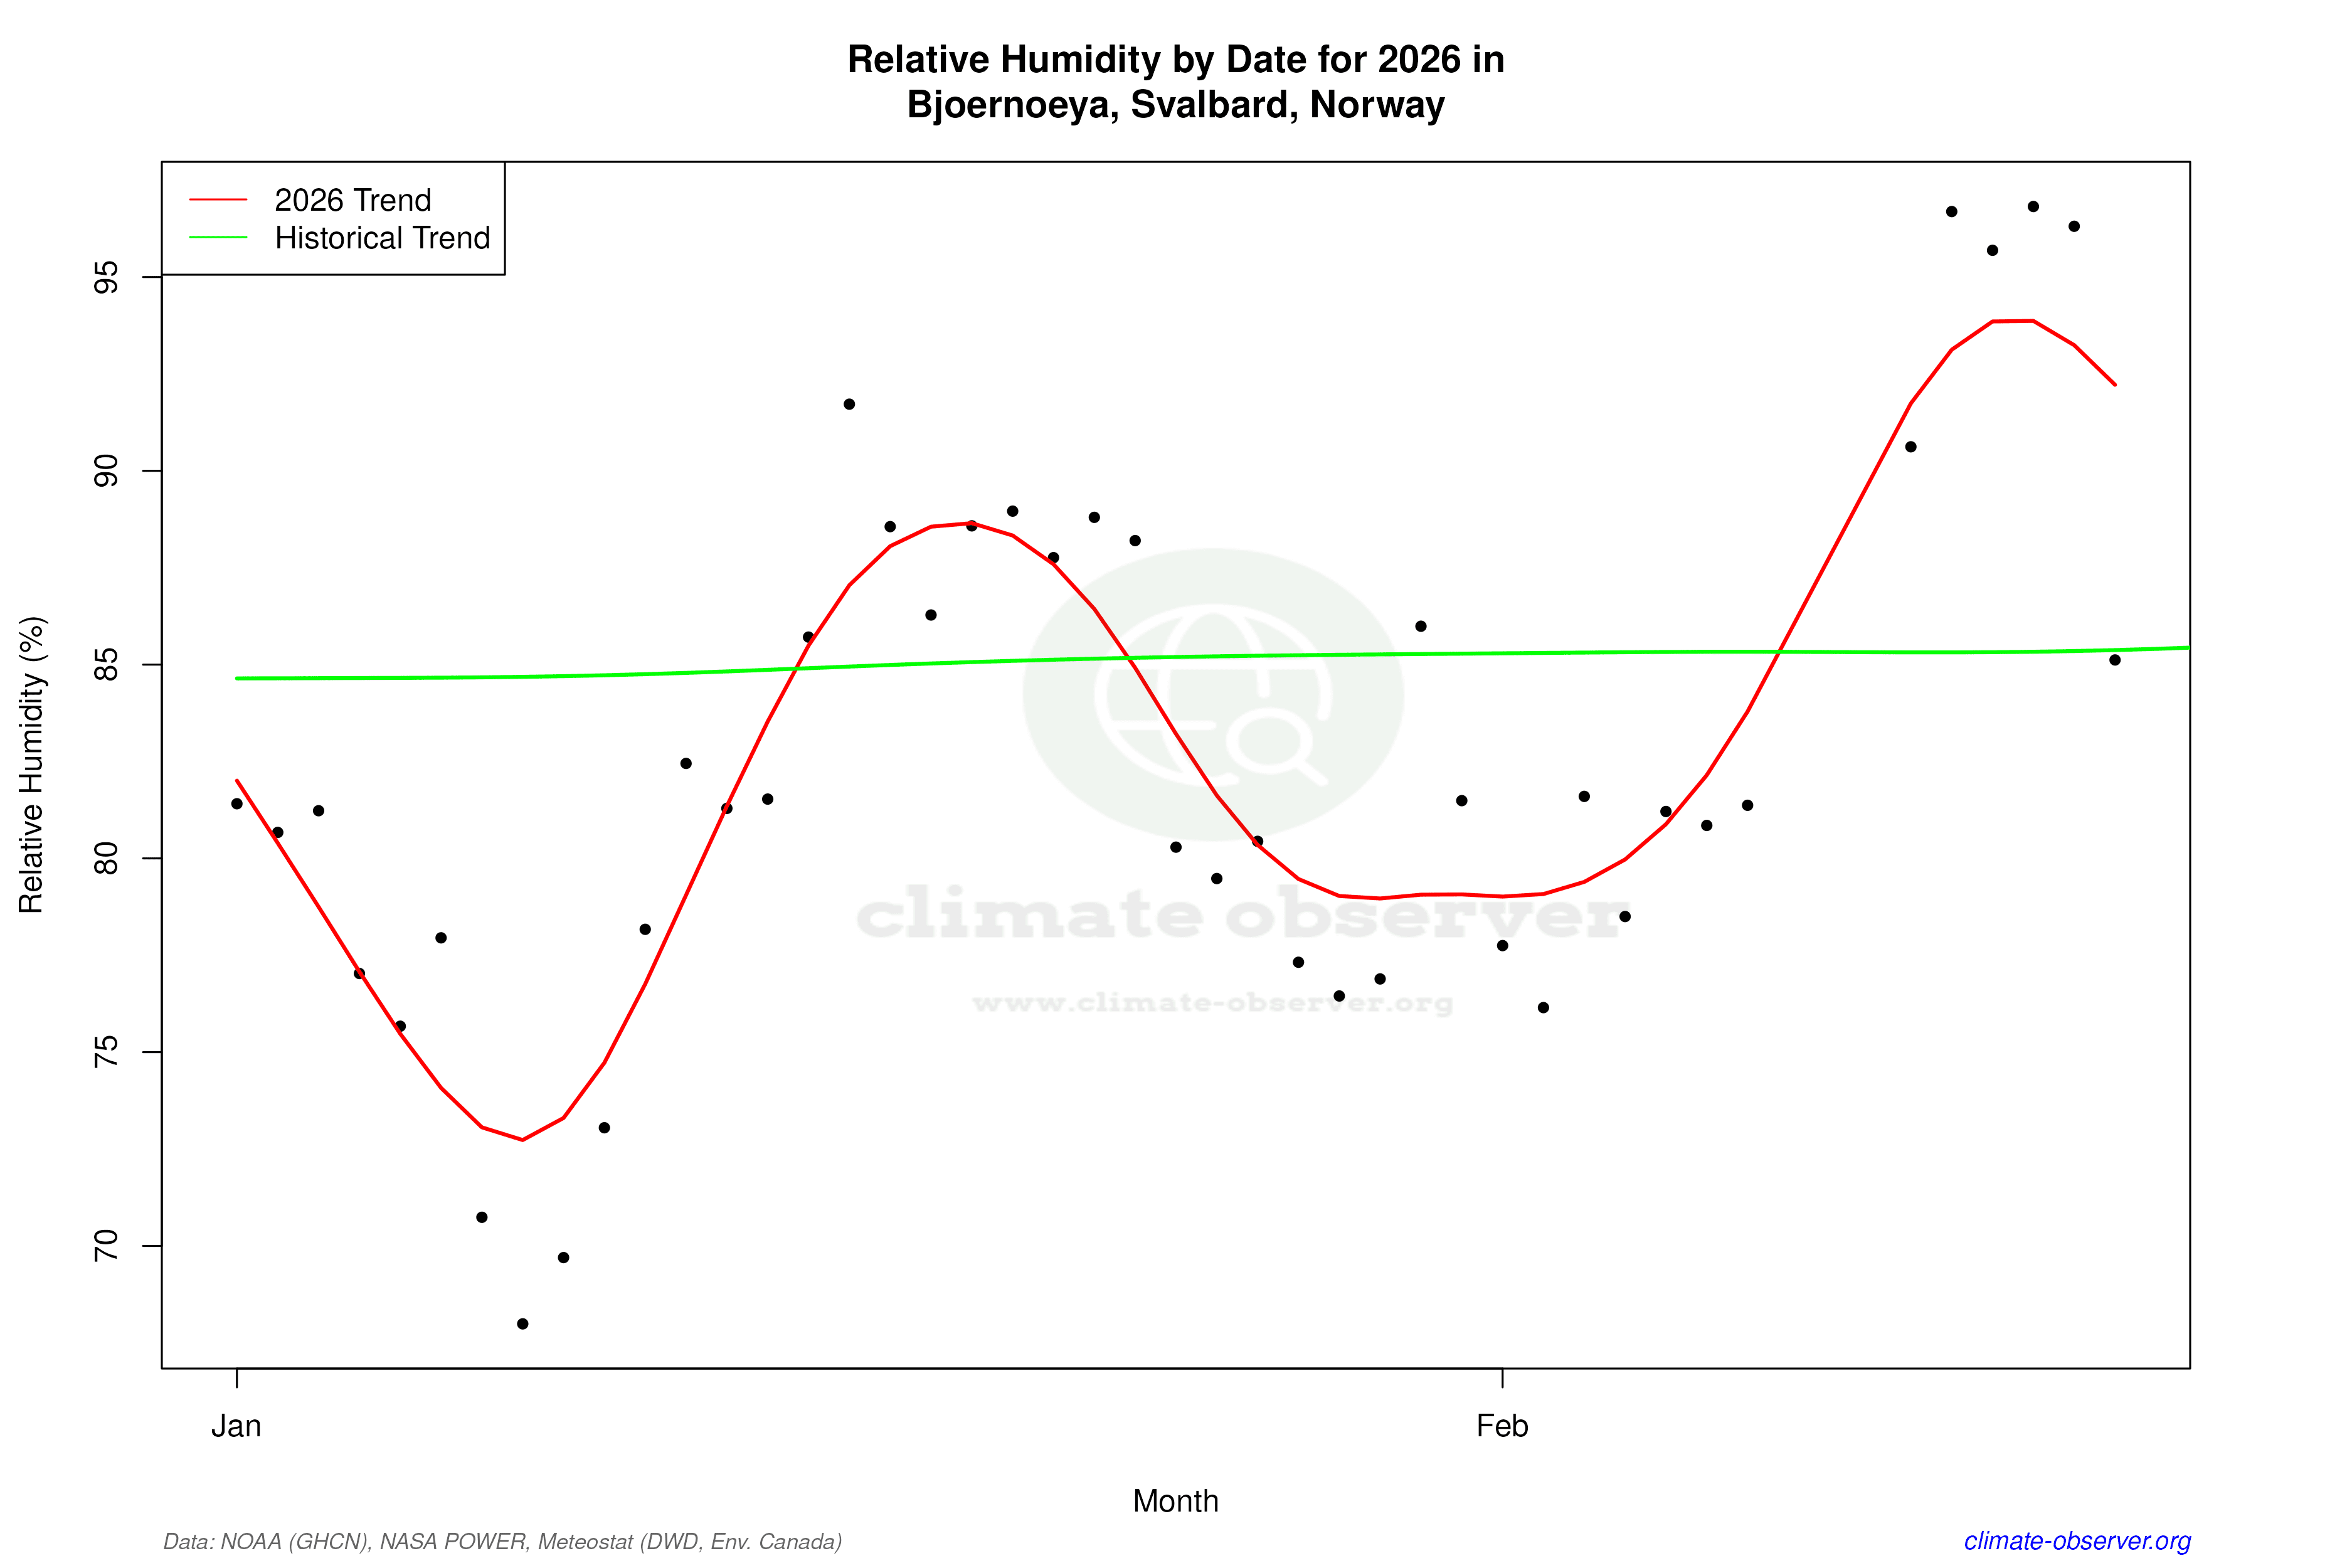

Max Temperature this Year | 1 of 6
Climate 12-Month Moving Averages


Max Temperature 12-Month MA | 1 of 6
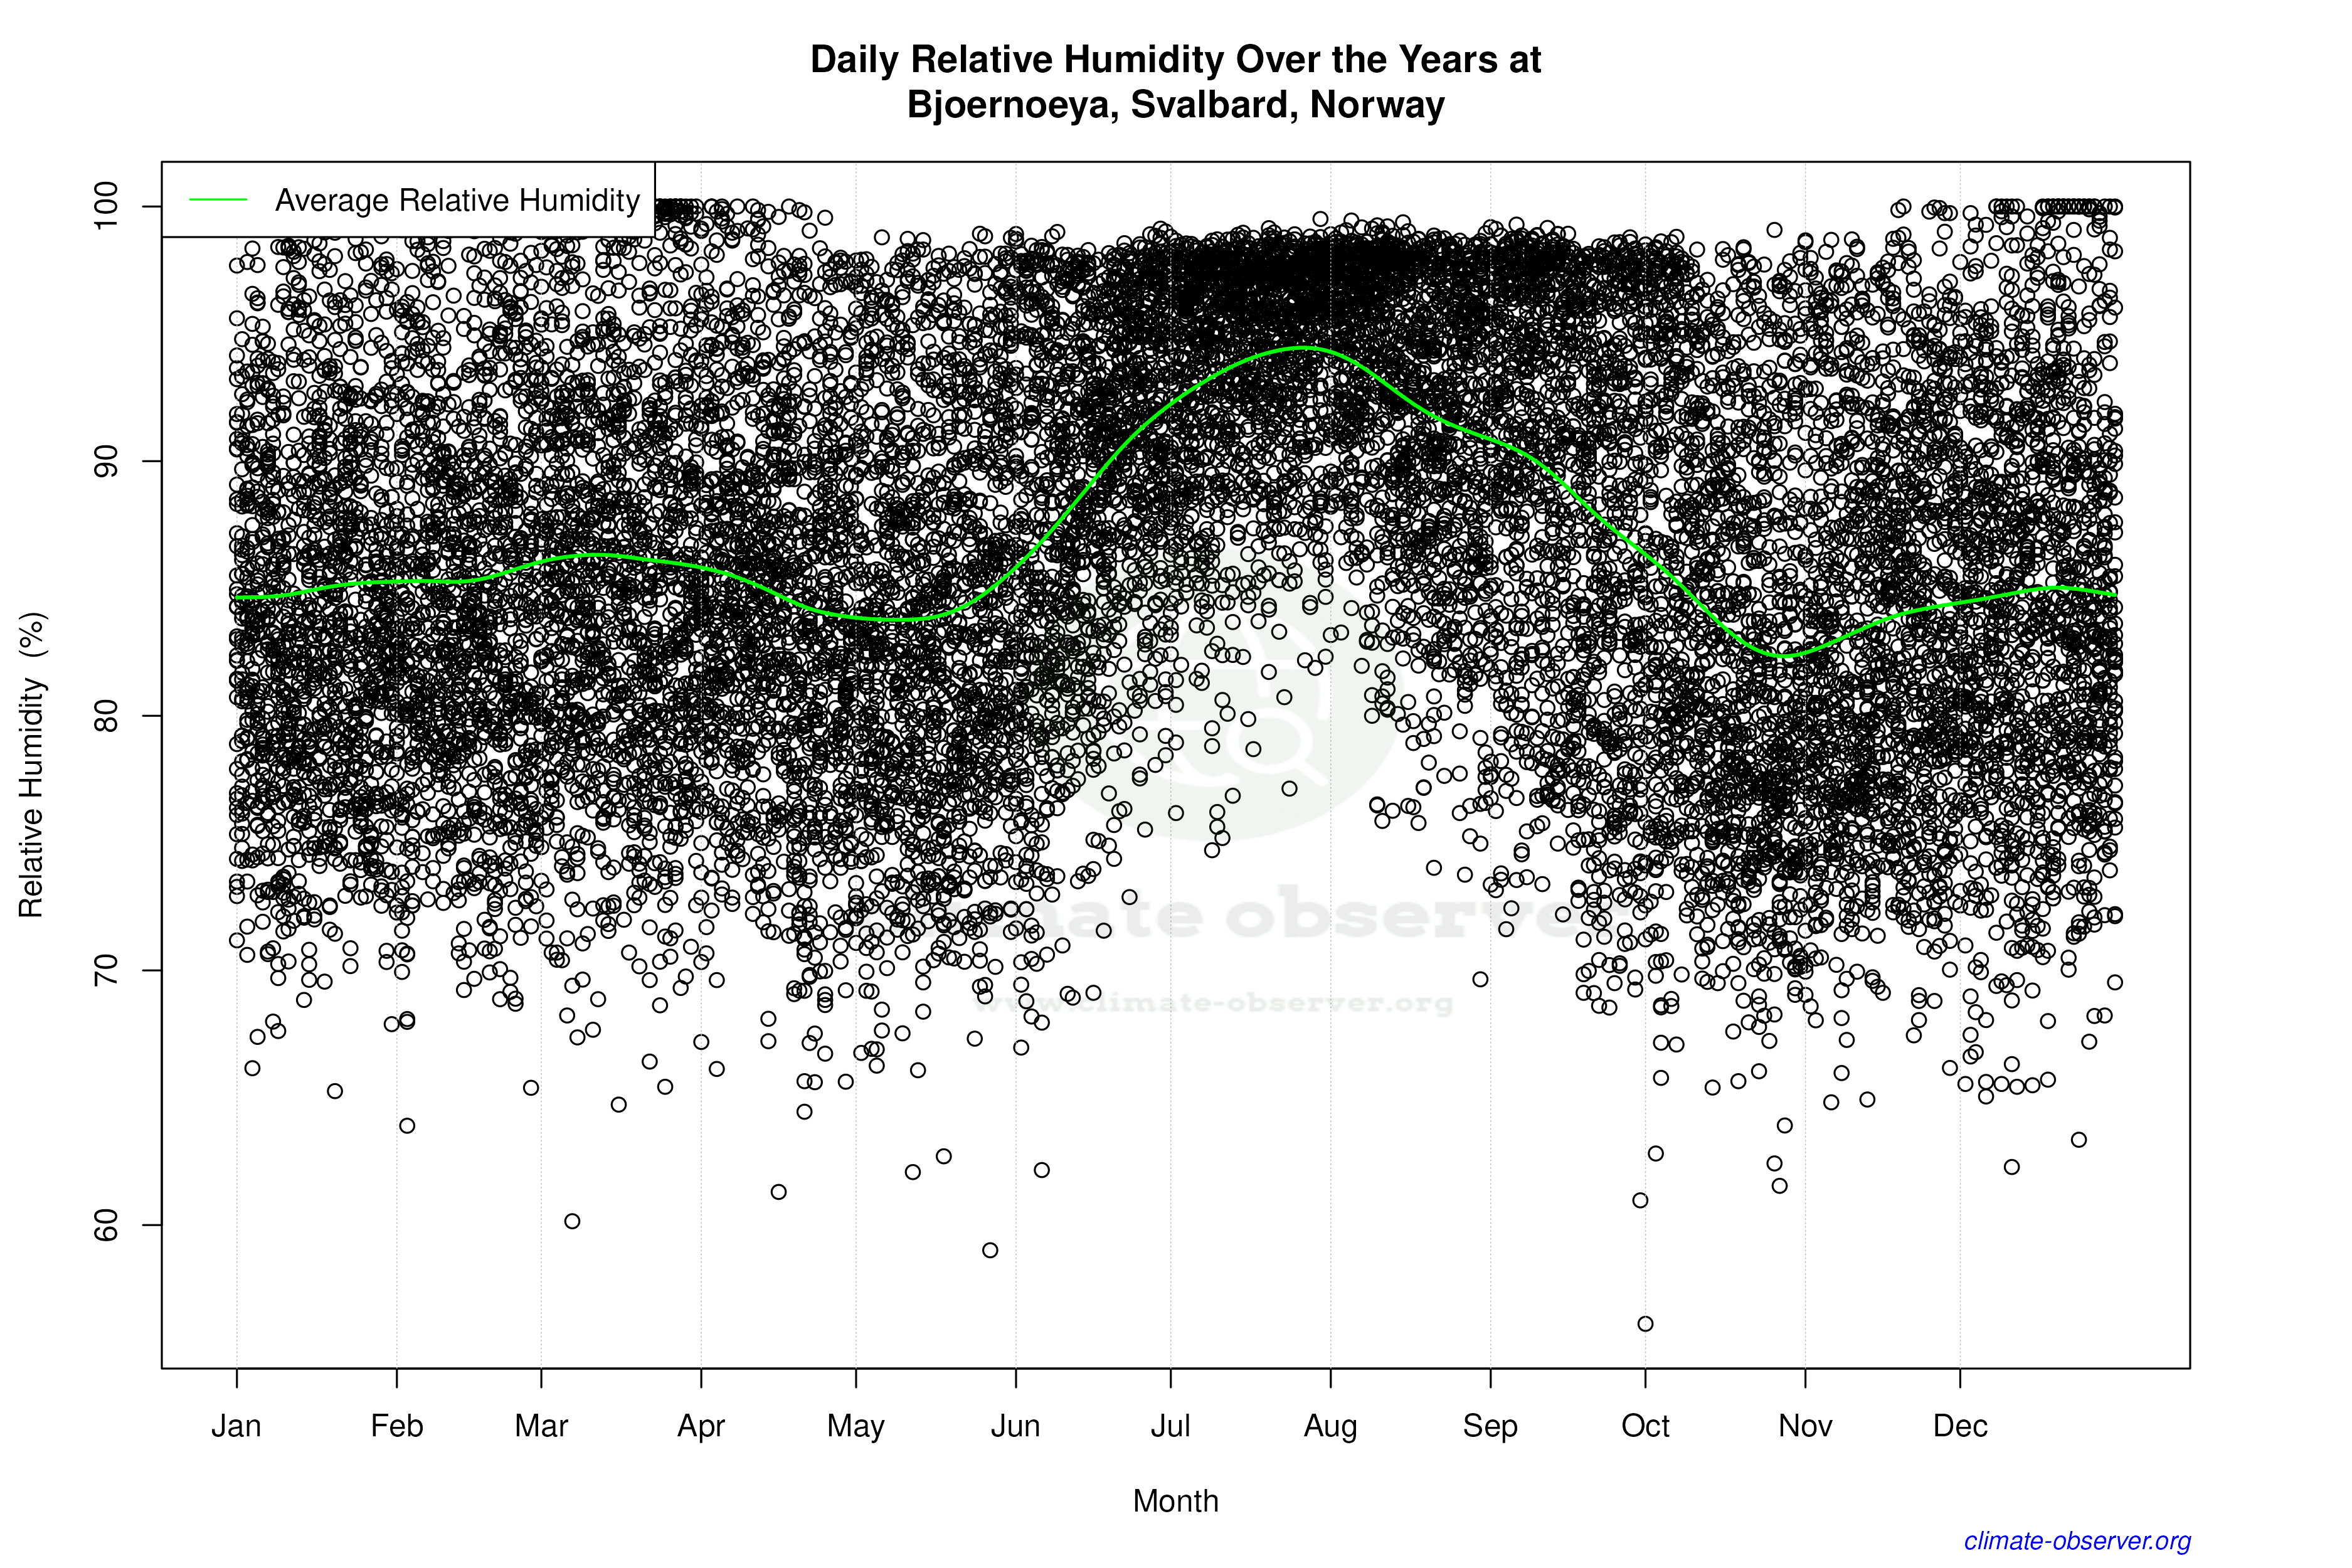
Daily Data Points and Averages Throughout the Year


Average Max Temperature Throughout Year | 1 of 5