Climate for Station: Hopen, Svalbard, Norway
Loading live weather...
Climate Analysis & Overview
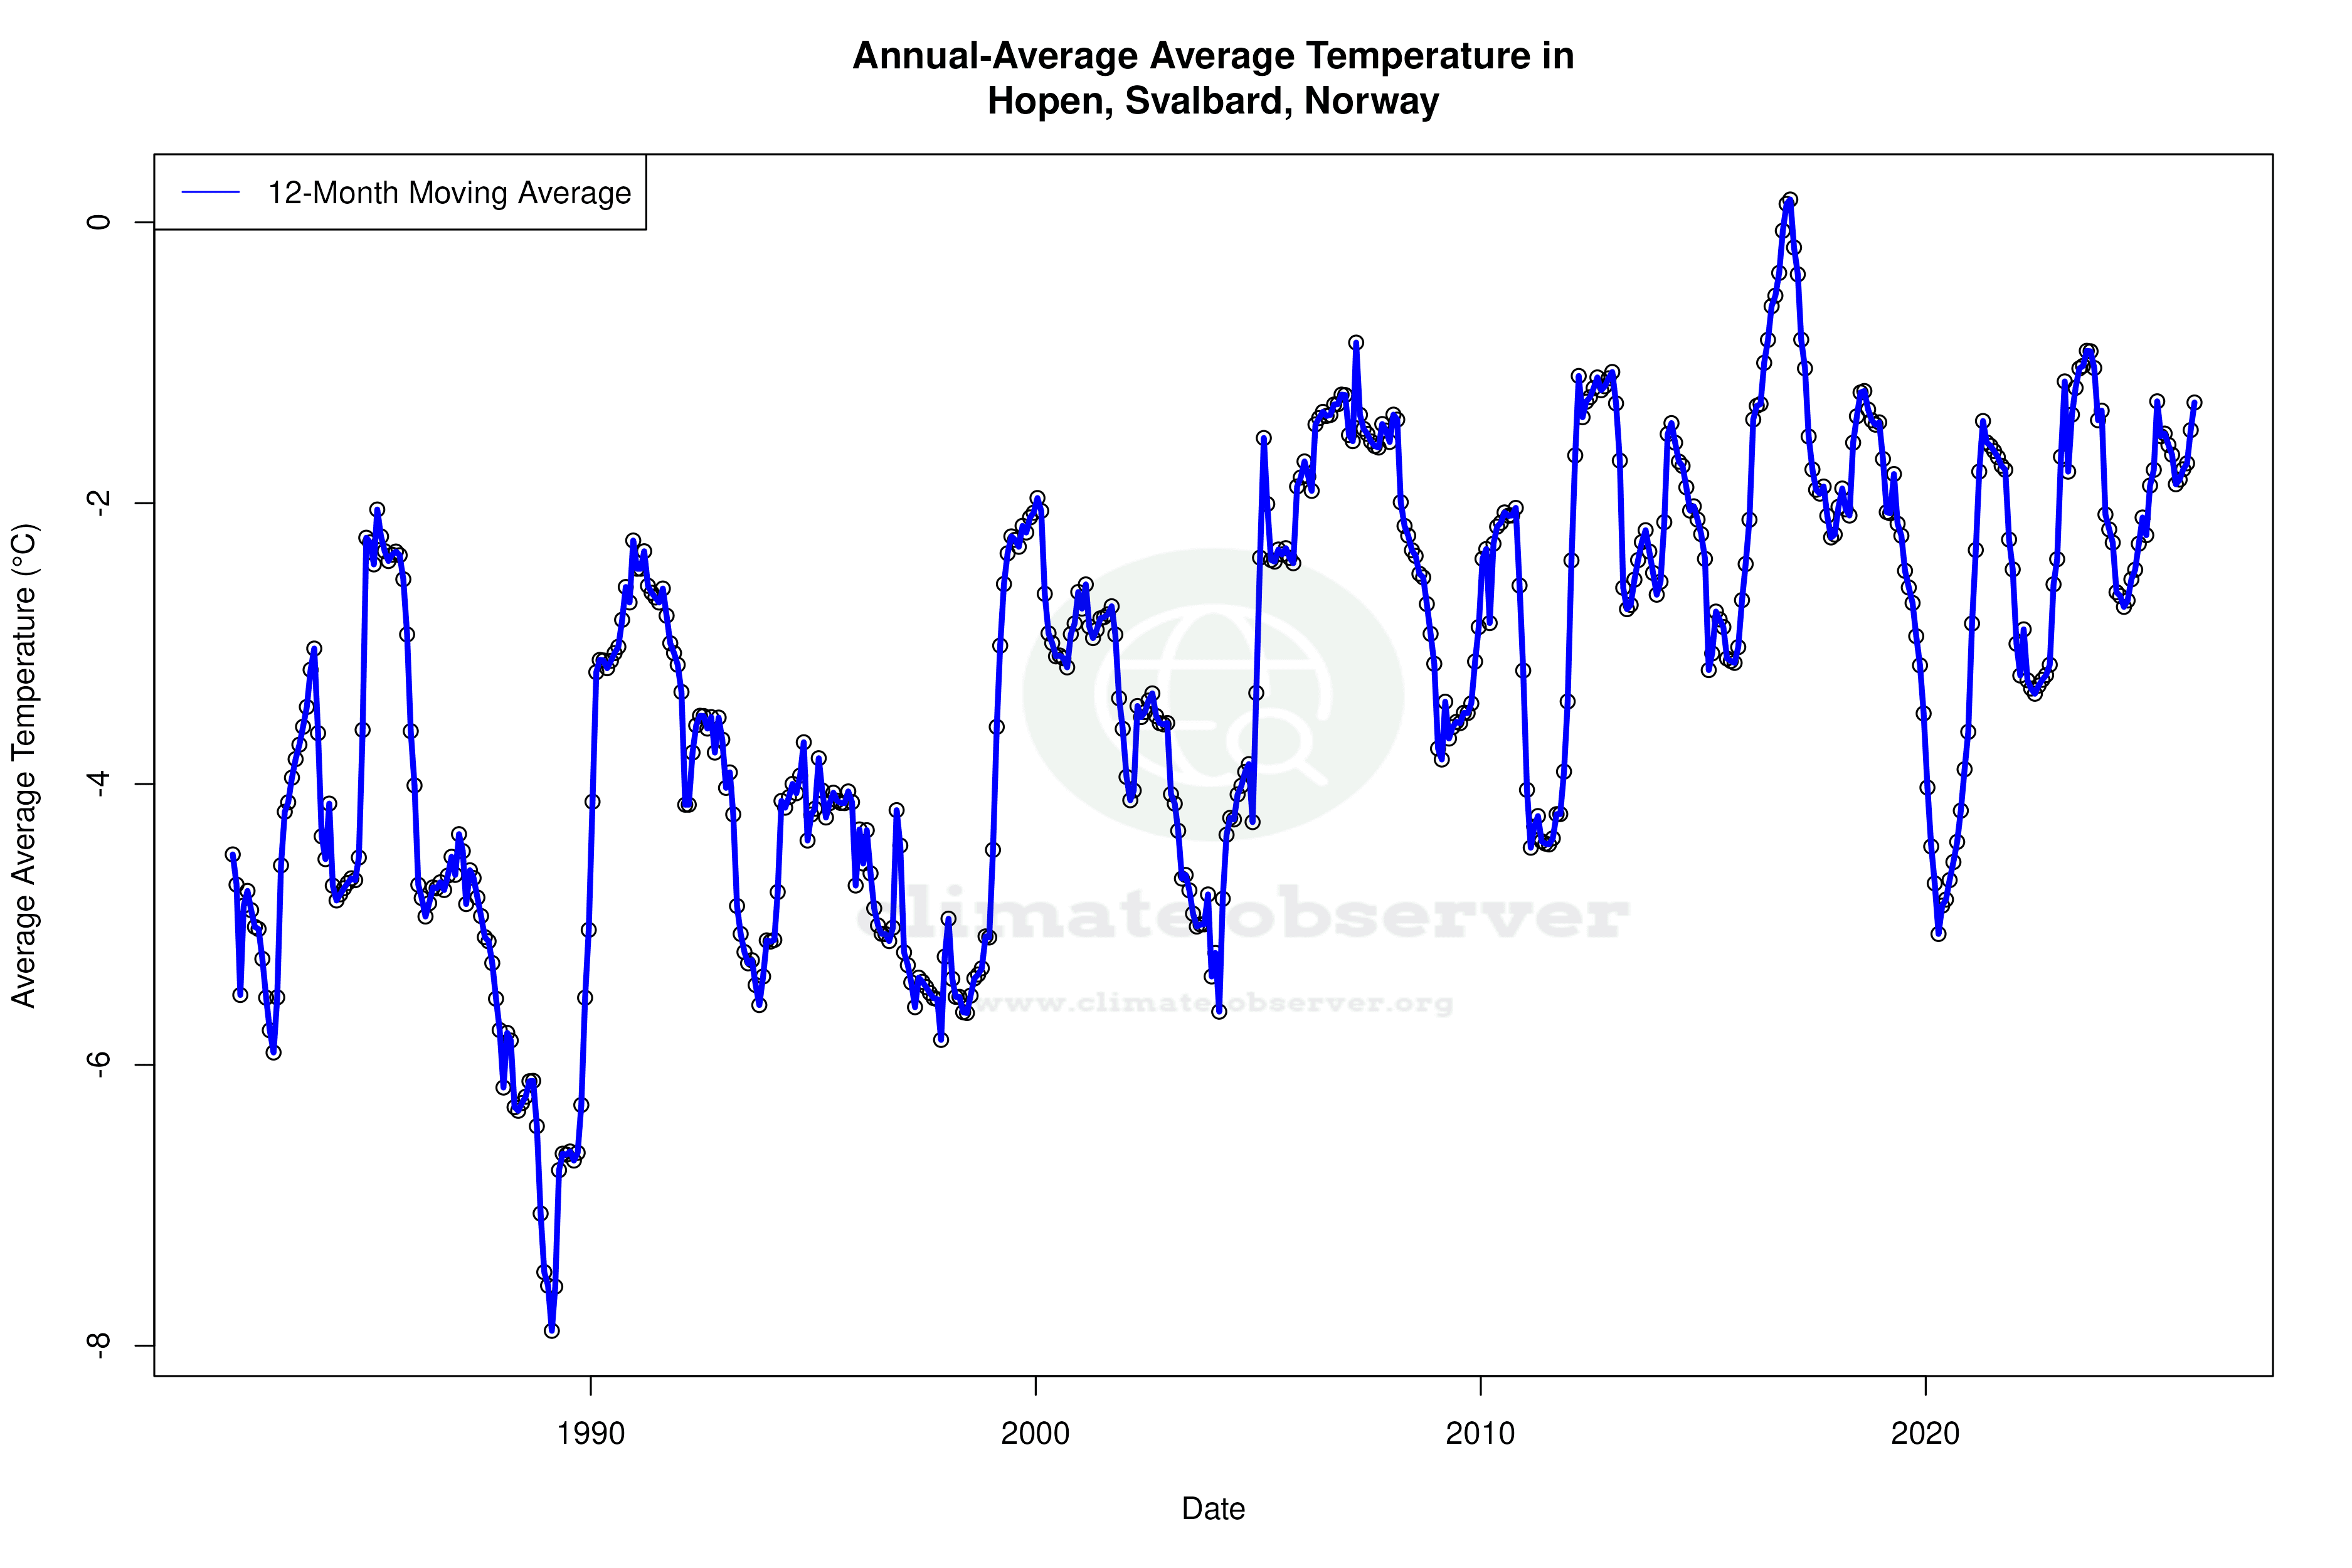
The climate profile for Hopen, situated in the remote Svalbard archipelago, reveals a complex interplay of warming and cooling trends over different timescales. While long-term data indicates a gradual warming, recent decades have seen a cooling trend. Precipitation patterns have become more evenly distributed, suggesting subtle shifts in local weather dynamics.
Arctic Climate Dynamics
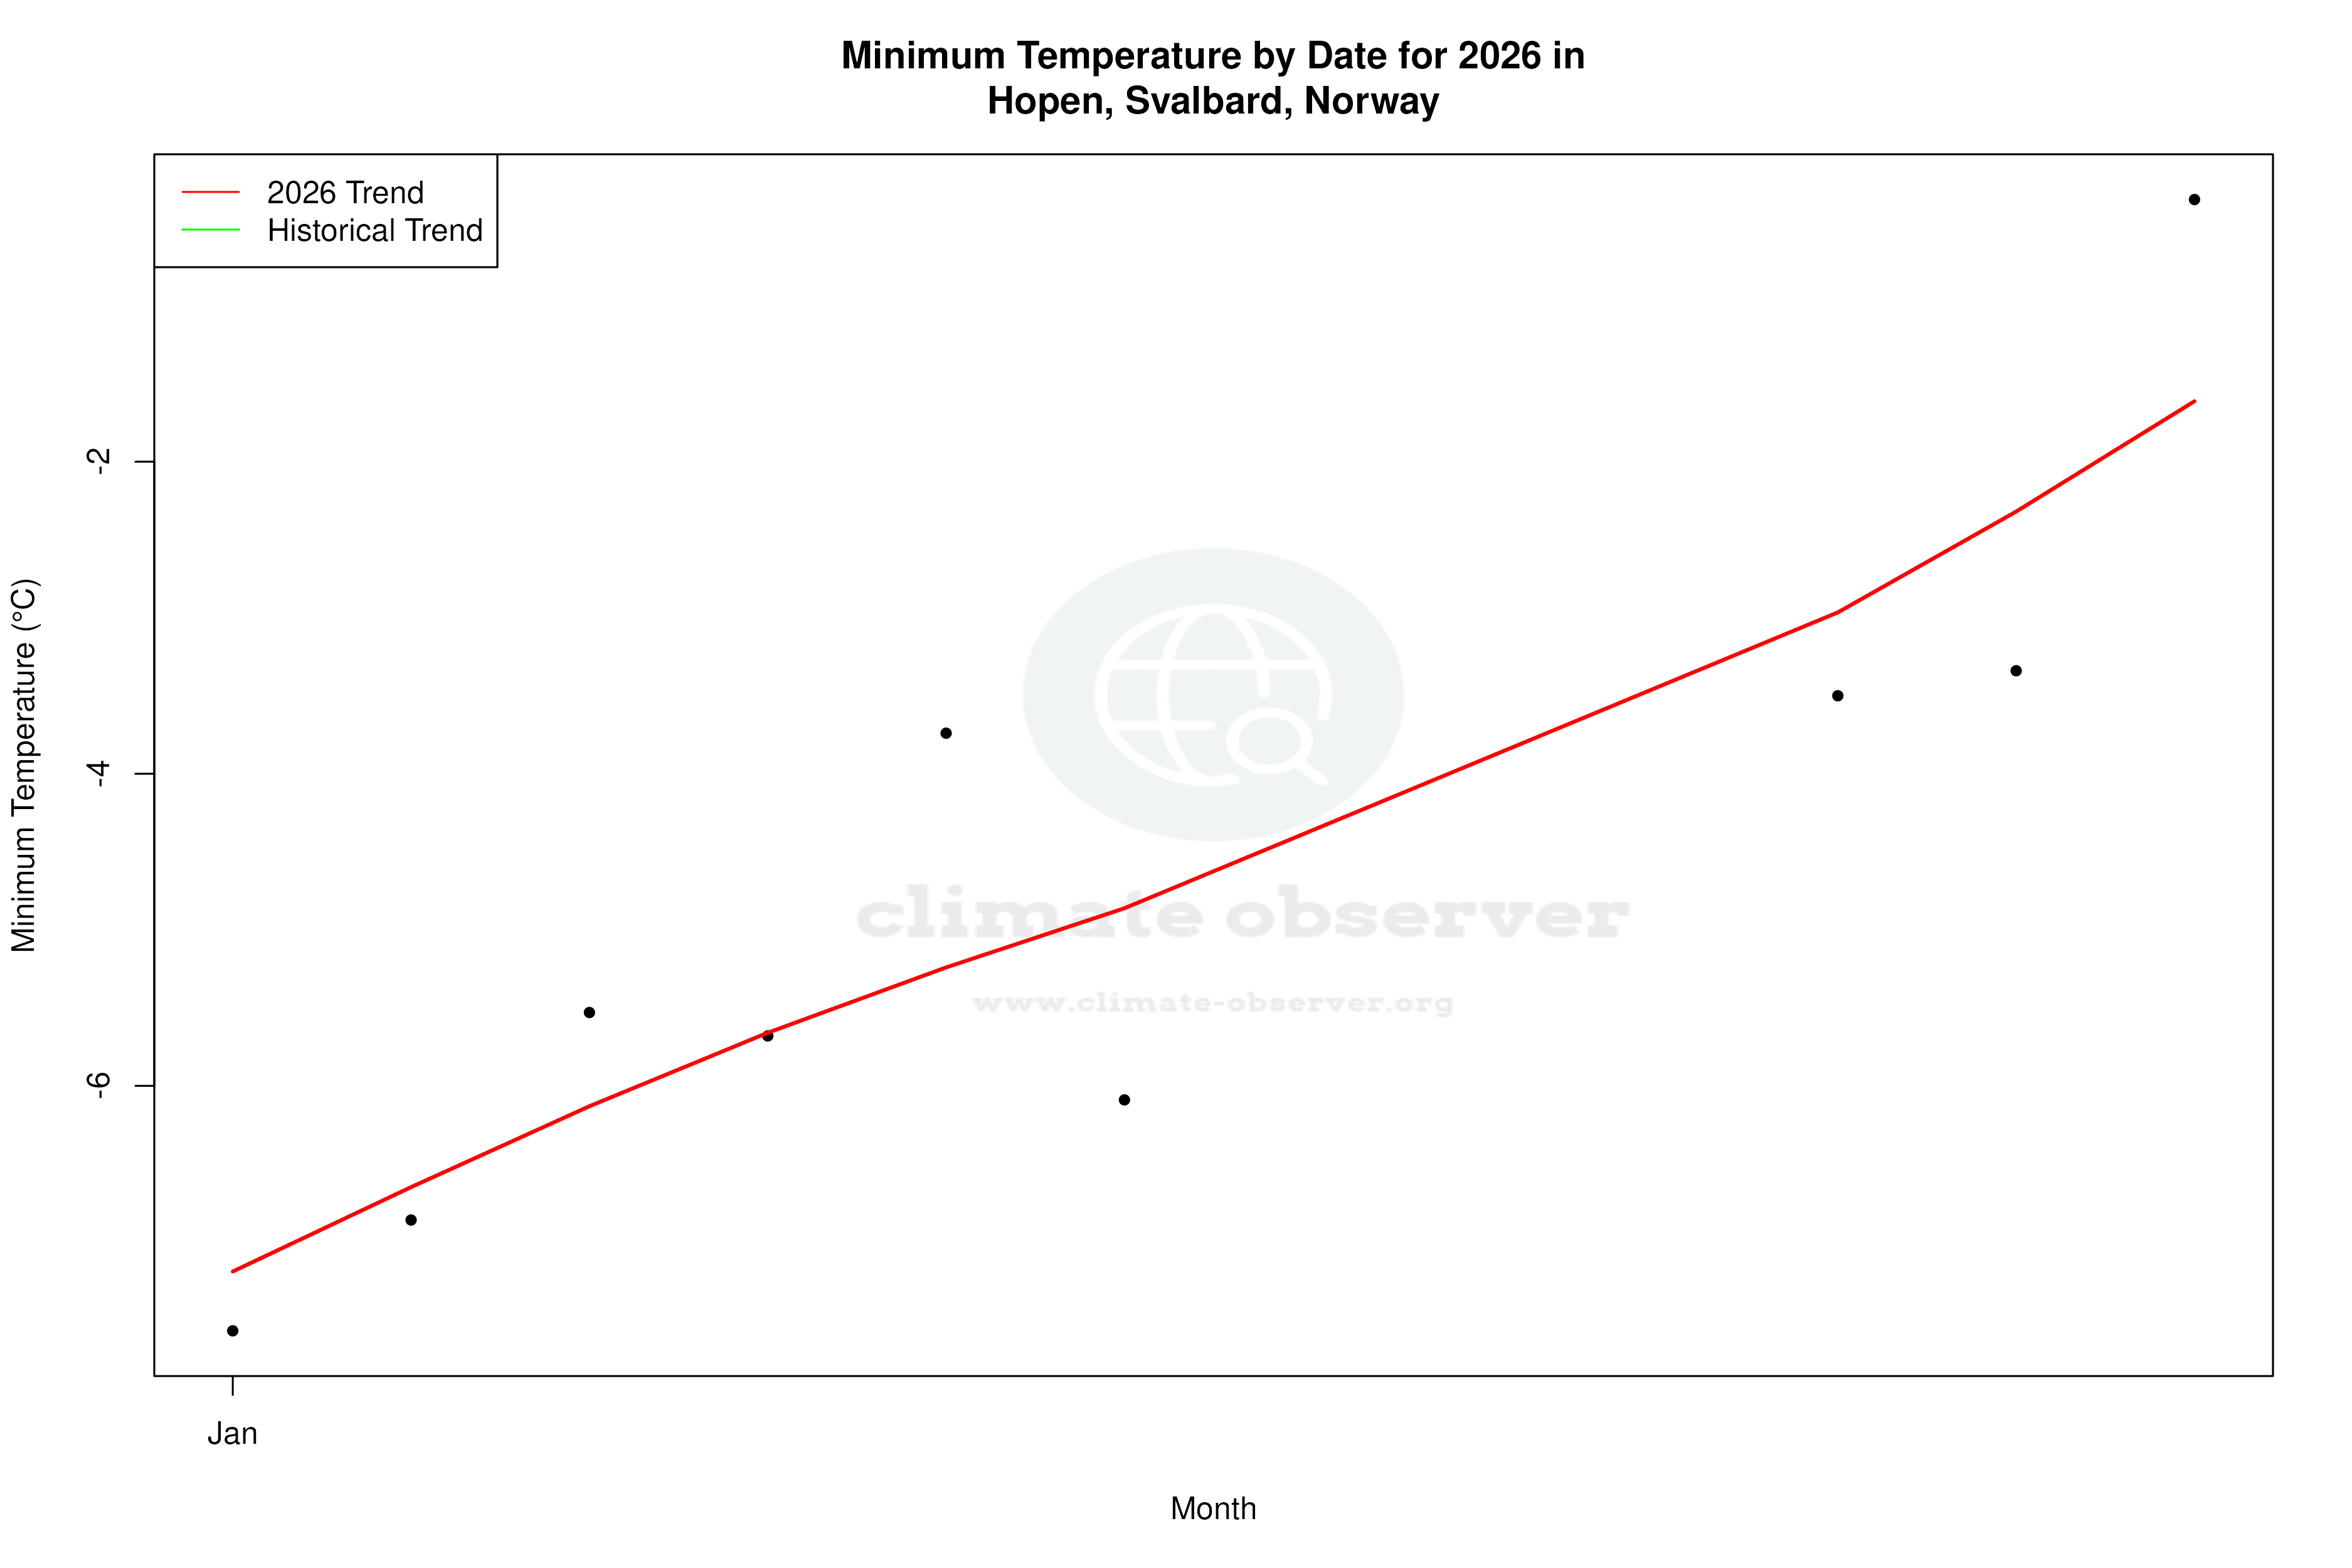
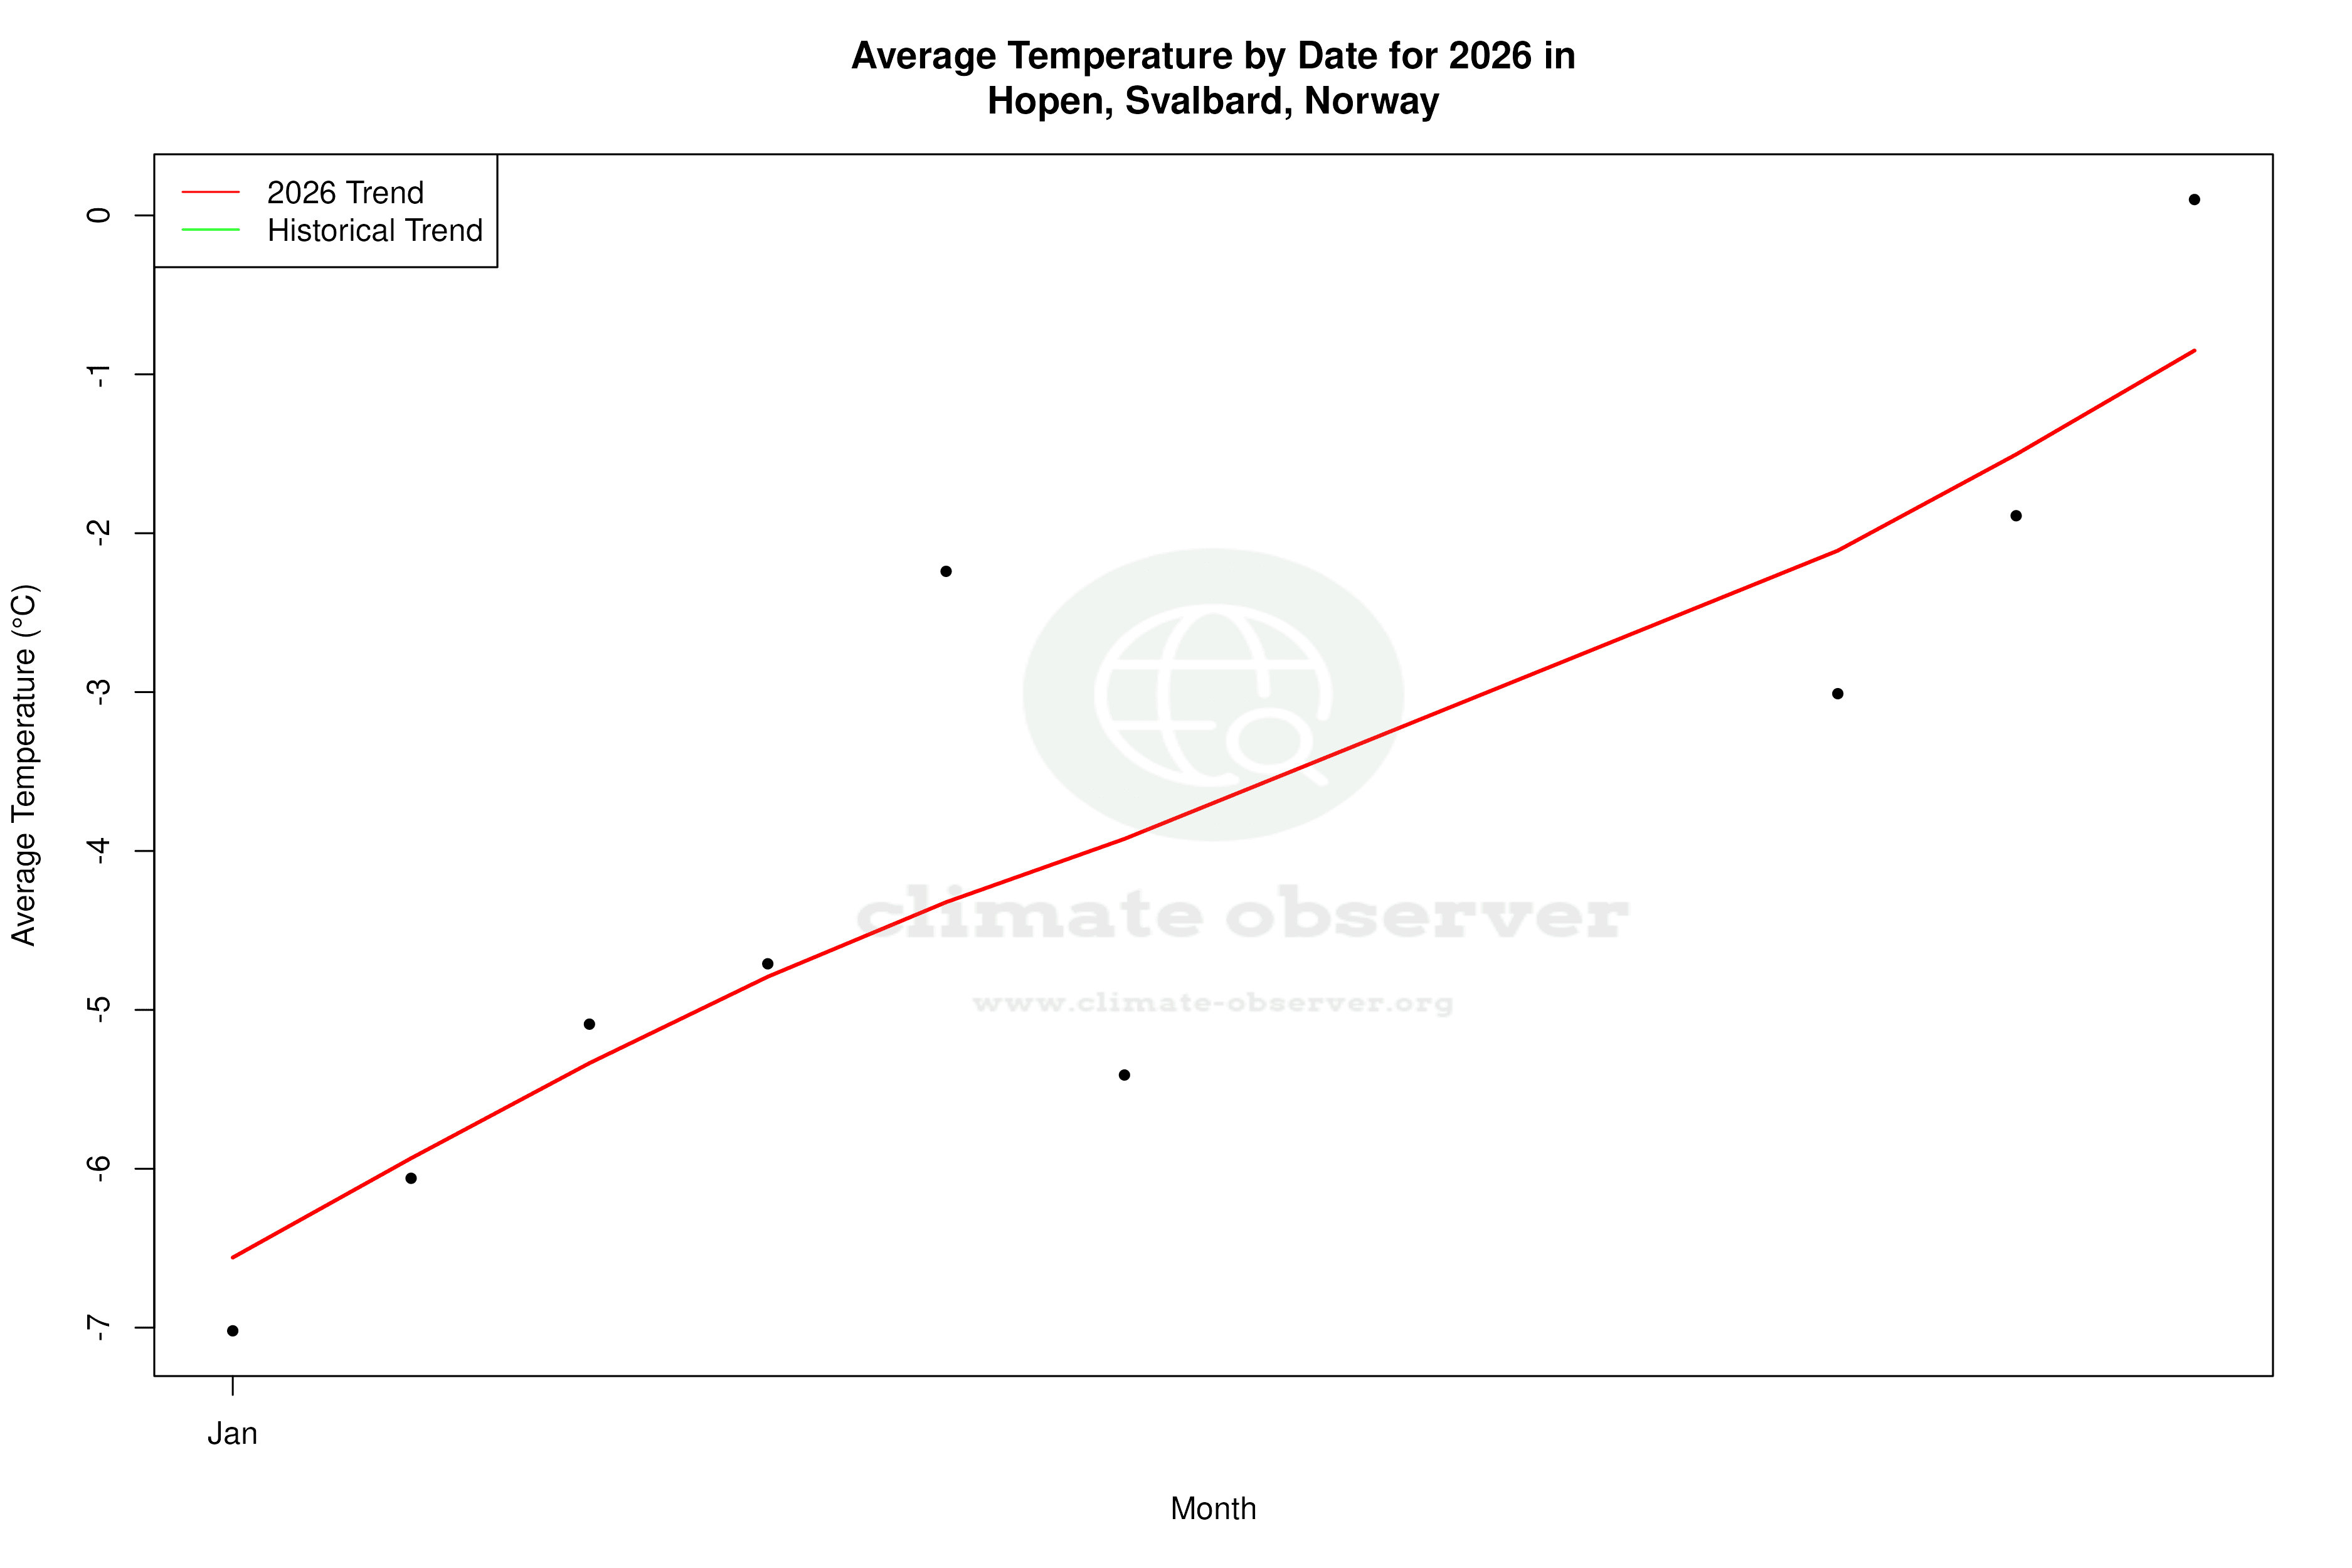
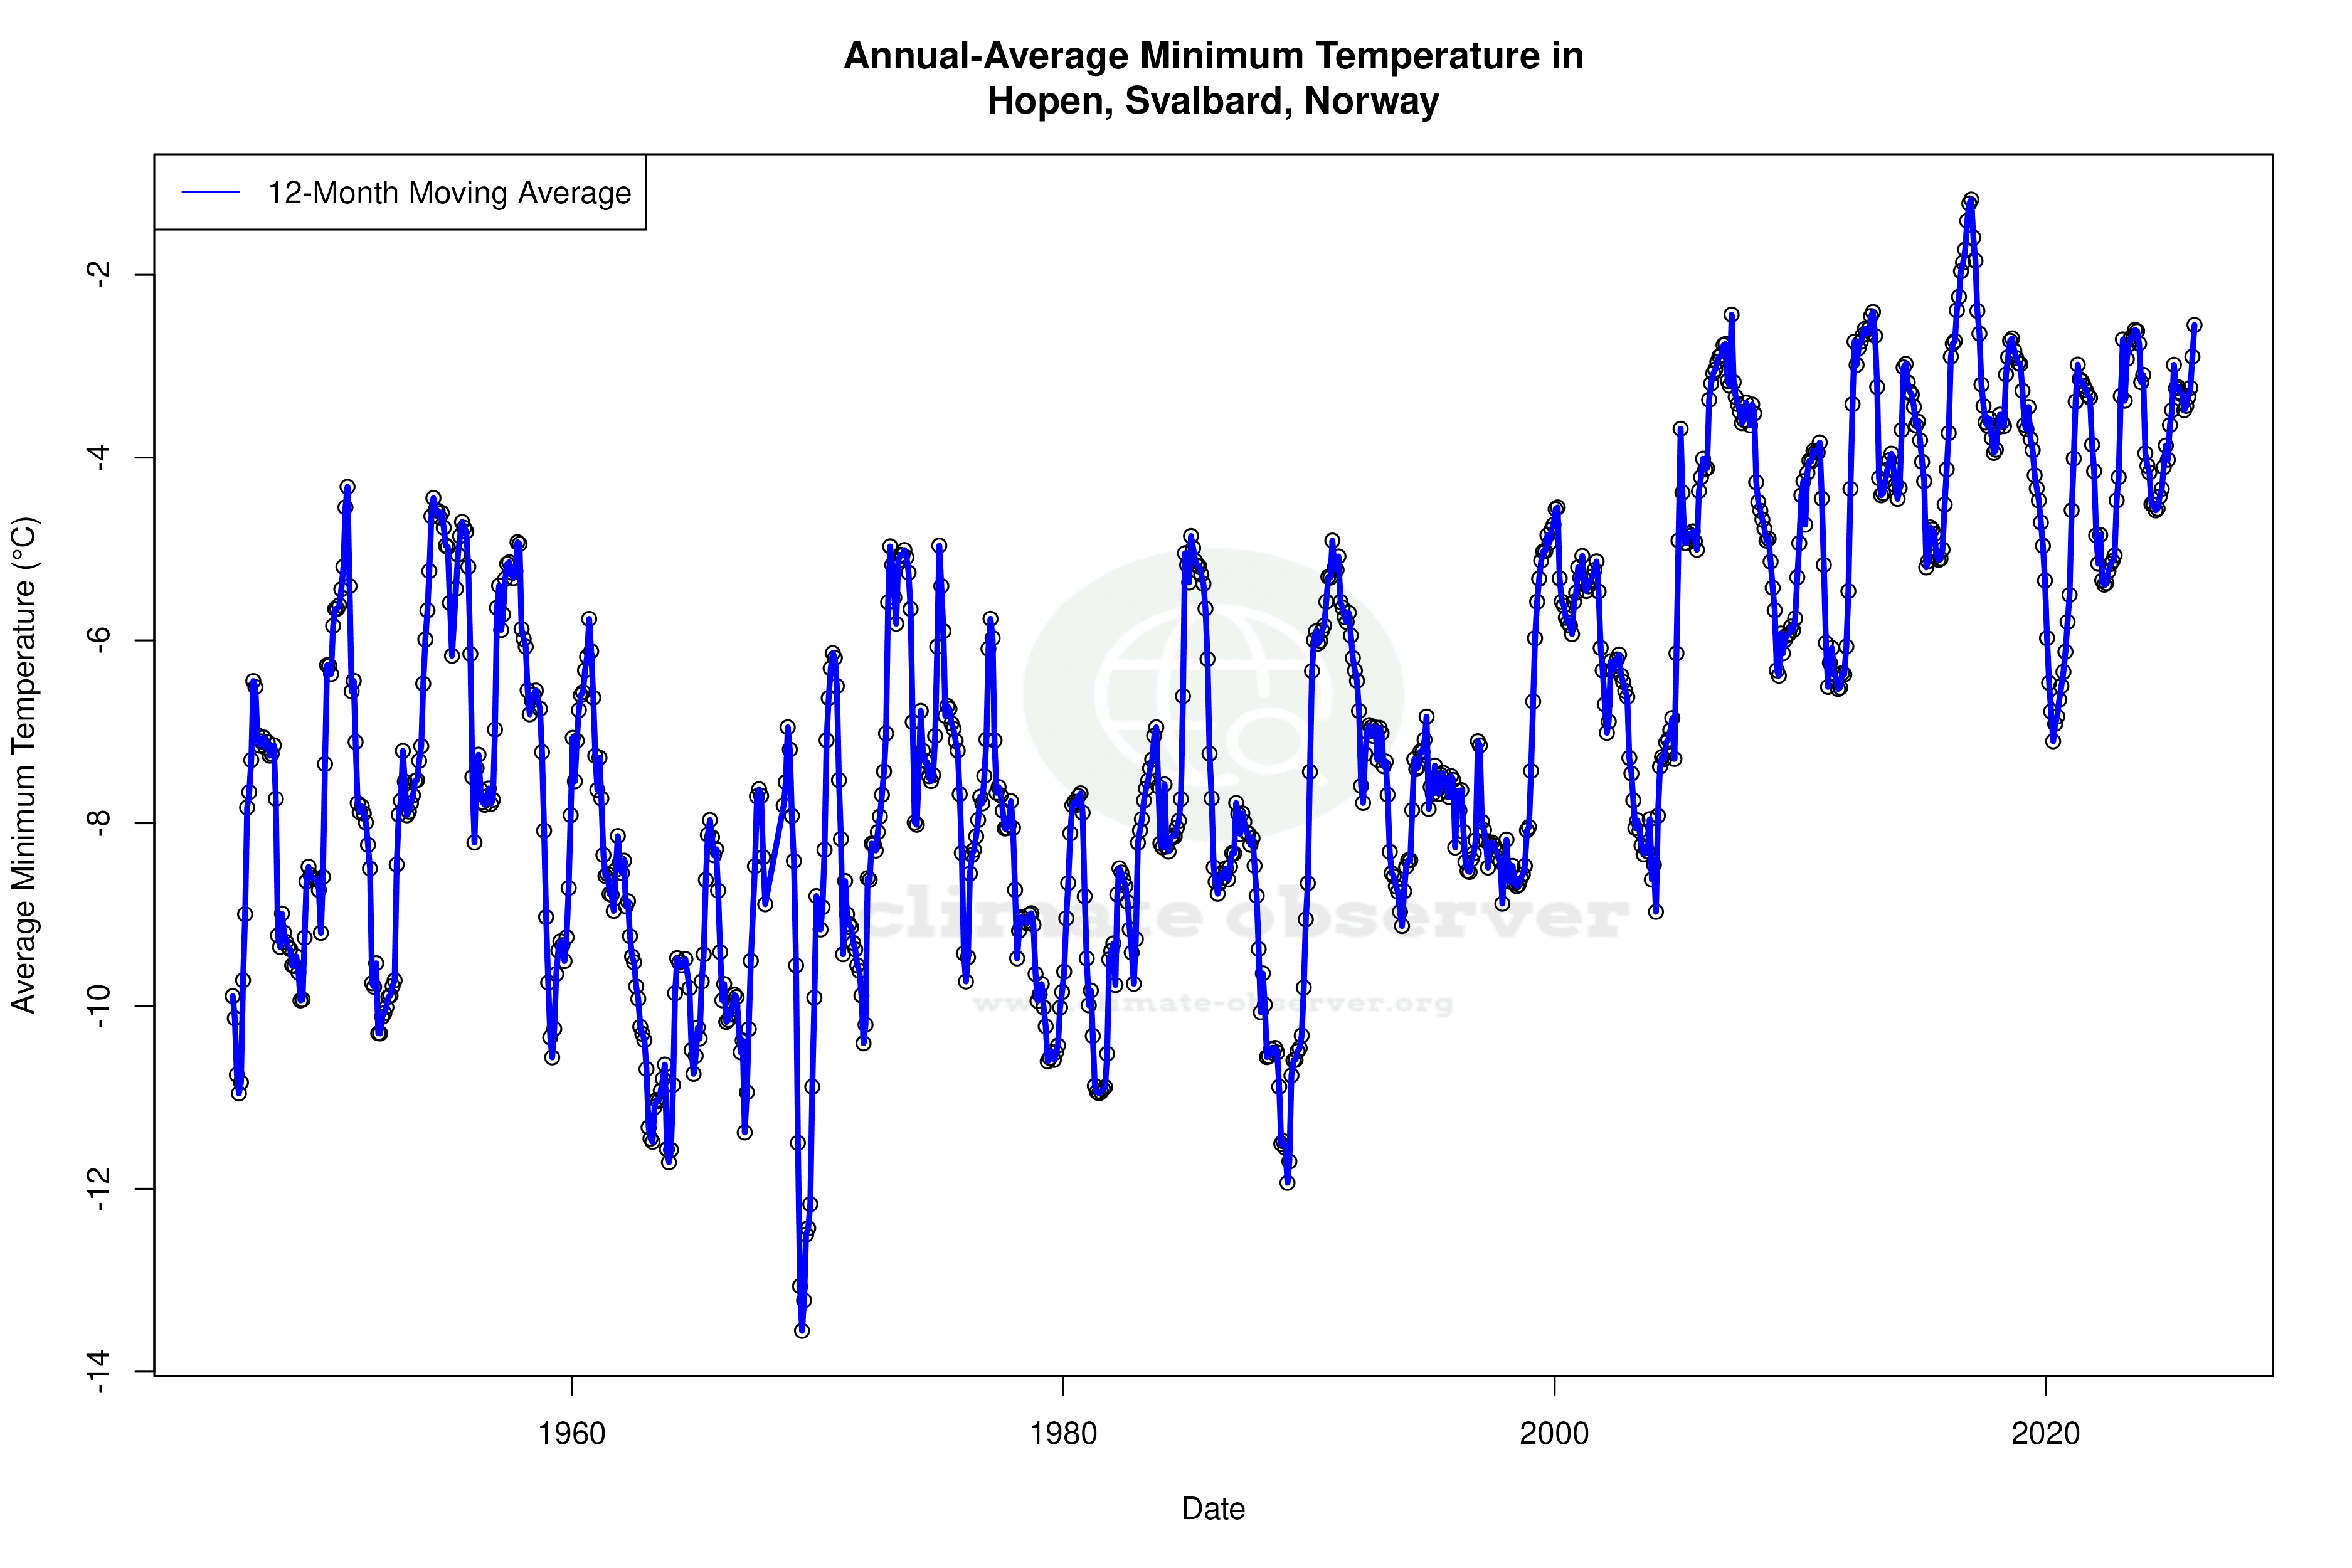
Hopen, located at 76.5°N, 25.0667°E, falls under the Tundra climate classification (ET) of the Köppen system, characterised by long, cold winters and short, cool summers. The island's geographical position in the Barents Sea subjects it to maritime influences, which moderate temperatures compared to continental areas at similar latitudes. The all-time temperature trends show a warming of 0.43°C (0.77°F) for highs and 0.63°C (1.13°F) for lows, suggesting a gradual rise in average temperatures over the station's history. However, the past decade tells a different story, with a cooling trend of -0.53°C (-0.95°F) for highs and -0.90°C (-1.61°F) for lows, indicating recent variability in temperature patterns.
Temperature Extremes and Records
Hopen's climate extremes are marked by a record high of 14.1°C (57.4°F) and a record low of -36.9°C (-34.4°F). These figures illustrate the significant temperature range the island experiences, influenced by both polar air masses and occasional milder maritime air. The recent cooling trend over the last decade contrasts with the all-time warming trend, highlighting the complex and often unpredictable nature of Arctic climate dynamics.
Precipitation Patterns and Distribution
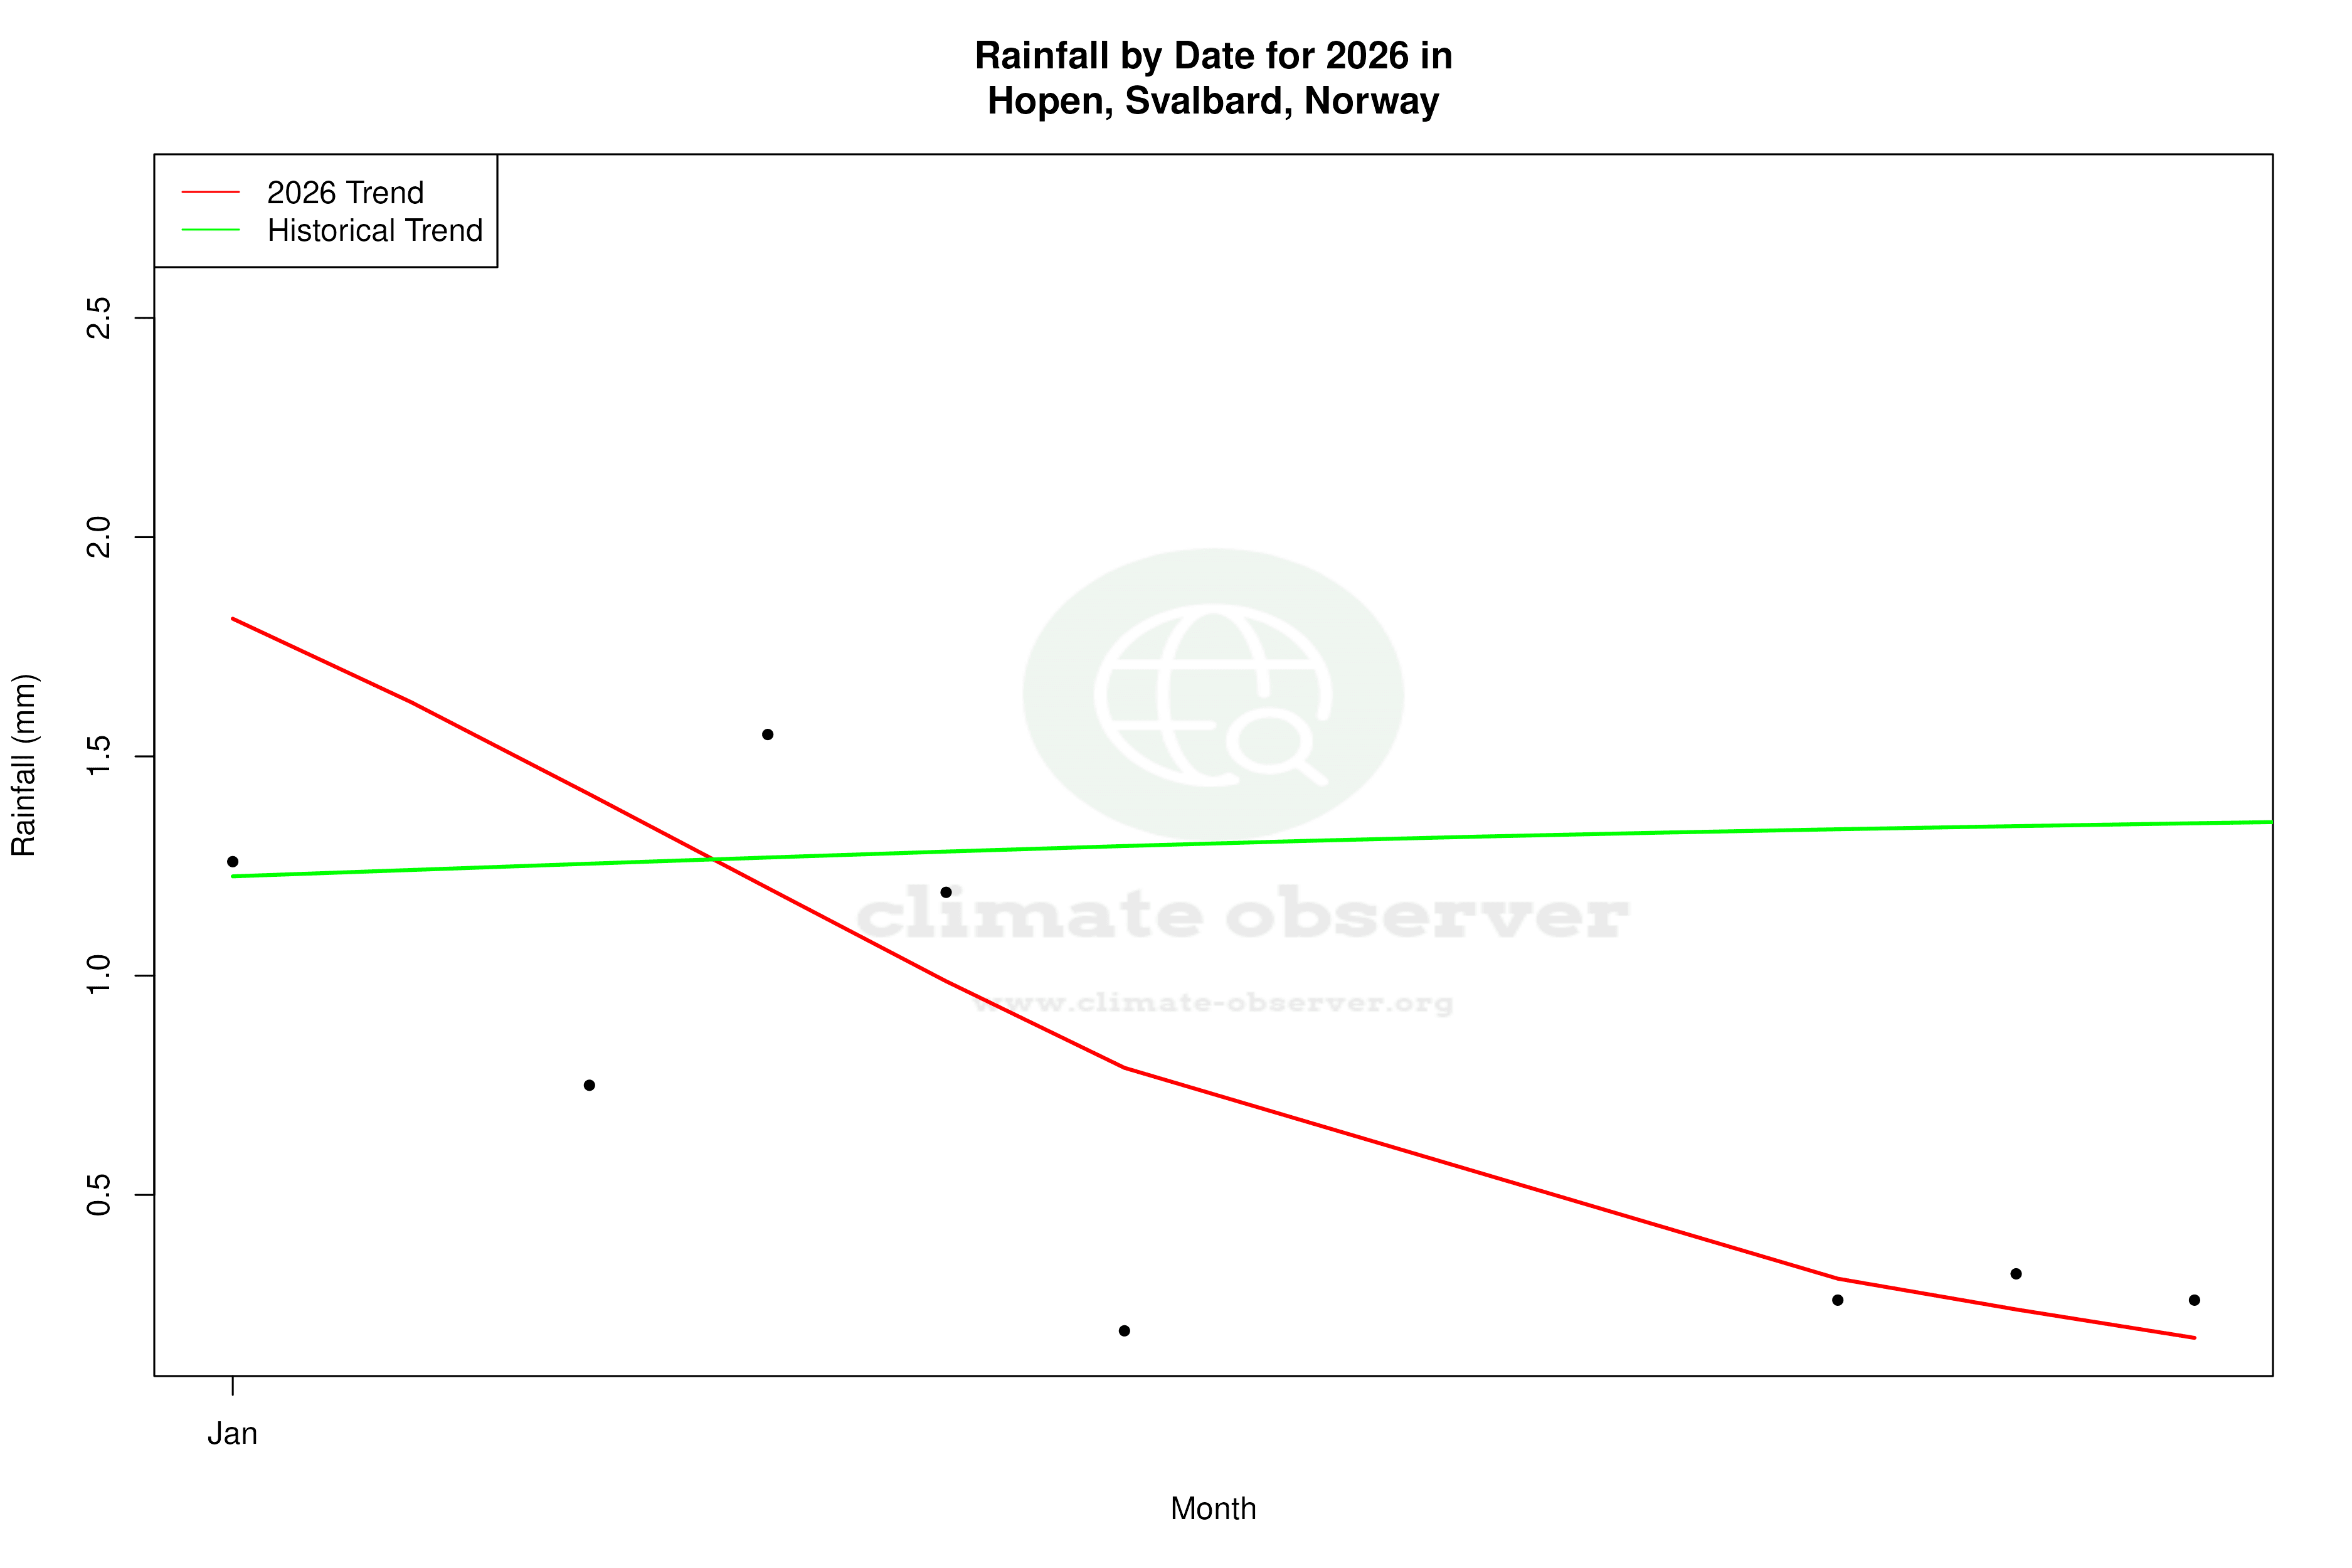
The Precipitation Concentration Index (PCI) for Hopen has decreased from a baseline of 11.03 to a current value of 9.25, indicating a more even distribution of precipitation events. In layman's terms, this means that rainfall and snowfall are becoming less concentrated in intense events and more spread out over time. This subtle shift could be indicative of broader changes in atmospheric circulation patterns, potentially linked to regional climate goals aimed at understanding and mitigating climate change impacts in the Arctic.
Regional Thermal Oscillations
The juxtaposition of long-term warming with recent cooling trends in Hopen underscores the region's thermal oscillations. Such variability is not uncommon in the Arctic, where sea ice extent, ocean currents, and atmospheric conditions interact in complex ways. The recent cooling trend could be a temporary fluctuation within a longer-term warming trajectory, or it might signal a more persistent shift in local climate patterns. Understanding these oscillations is crucial for predicting future climate scenarios and informing policy decisions.
Implications for Climate Research
Hopen's climate data provides valuable insights into the broader Arctic climate system. The combination of warming and cooling trends, alongside changes in precipitation distribution, offers a microcosm of the challenges faced in understanding and predicting climate change in polar regions. As Norway continues to pursue its climate goals, such as reducing greenhouse gas emissions and enhancing climate resilience, the data from Hopen will be instrumental in shaping effective strategies.
Station Statistics
10-Year Trend
High: -0.30 °F/decade
Low: -0.40 °F/decade
Rain: -0.022 in/decade
25-Year Trend
High: +1.27 °F/decade
Low: +1.94 °F/decade
Rain: -0.006 in/decade
50-Year Trend
High: +1.63 °F/decade
Low: +2.31 °F/decade
Rain: +0.001 in/decade
All-Time Trend
High: +0.79 °F/decade
Low: +1.14 °F/decade
Rain: +0.003 in/decade
Percentage Above-Average Days
Last 12 Months: 78.4%
This Year: 23.5%
Precipitation Concentration Index (PCI) ℹ️
Last 12 Months: 9.3
Historical Average: 10.0
Percentile Rank of Last 12 Months ℹ️
High: 93rd percentile
Low: 95th percentile
Rain: 36th percentile
Change in Variance ℹ️
High: -37.7%
Low: -41.6%
Intraday: -53.4%
Data Coverage
88.2%
First Year of Data
1945
Station Location
Historical Weather Records
| Max High | Avg High | Min High | Max Avg | Avg Avg | Min Avg | Max Low | Avg Low | Min Low | Max Precipitation | Avg Precipitation | Max Snow | Avg Snow | |
|---|---|---|---|---|---|---|---|---|---|---|---|---|---|
| Record | 57.38 °F | — | -25.60 °F | 53.06 °F | — | -26.70 °F | 46.76 °F | — | -34.42 °F | 1.84 in | — | — | — |
| January | 40.10 °F | 17.38 °F | -24.52 °F | 37.58 °F | 17.00 °F | -19.12 °F | 35.96 °F | 6.73 °F | -31.90 °F | 0.63 in | 0.05 in | — | — |
| February | 40.64 °F | 17.99 °F | -23.80 °F | 36.68 °F | 16.58 °F | -26.70 °F | 35.06 °F | 6.52 °F | -30.28 °F | 0.73 in | 0.05 in | — | — |
| March | 39.02 °F | 16.57 °F | -25.60 °F | 36.14 °F | 15.56 °F | -24.54 °F | 34.70 °F | 5.30 °F | -34.42 °F | 0.59 in | 0.05 in | — | — |
| April | 44.42 °F | 20.18 °F | -11.92 °F | 35.60 °F | 18.67 °F | -13.61 °F | 35.78 °F | 10.09 °F | -22.36 °F | 0.87 in | 0.04 in | — | — |
| May | 48.56 °F | 28.56 °F | 2.48 °F | 38.12 °F | 26.86 °F | 6.01 °F | 36.86 °F | 21.88 °F | -7.96 °F | 1.84 in | 0.03 in | — | — |
| June | 54.14 °F | 35.14 °F | 19.76 °F | 43.34 °F | 32.81 °F | 21.96 °F | 41.36 °F | 30.00 °F | 14.18 °F | 1.00 in | 0.04 in | — | — |
| July | 54.32 °F | 39.98 °F | 30.20 °F | 46.22 °F | 36.97 °F | 29.84 °F | 44.60 °F | 34.12 °F | 24.26 °F | 0.93 in | 0.05 in | — | — |
| August | 57.38 °F | 40.37 °F | 27.68 °F | 53.06 °F | 38.48 °F | 30.63 °F | 46.76 °F | 35.27 °F | 24.08 °F | 1.64 in | 0.05 in | — | — |
| September | 53.42 °F | 37.21 °F | 15.26 °F | 46.22 °F | 36.31 °F | 26.26 °F | 43.16 °F | 32.70 °F | 10.40 °F | 1.48 in | 0.07 in | — | — |
| October | 51.44 °F | 31.37 °F | 0.50 °F | 43.34 °F | 30.46 °F | 0.37 °F | 42.62 °F | 25.31 °F | -15.52 °F | 1.16 in | 0.07 in | — | — |
| November | 46.94 °F | 25.15 °F | -17.50 °F | 41.00 °F | 24.50 °F | -4.40 °F | 39.02 °F | 16.92 °F | -25.06 °F | 0.85 in | 0.06 in | — | — |
| December | 41.90 °F | 20.20 °F | -24.88 °F | 38.30 °F | 19.52 °F | -20.74 °F | 36.68 °F | 10.53 °F | -32.08 °F | 0.95 in | 0.06 in | — | — |
Data Visualisations
Remove WatermarksCurrent Year Climate Trends vs Historical
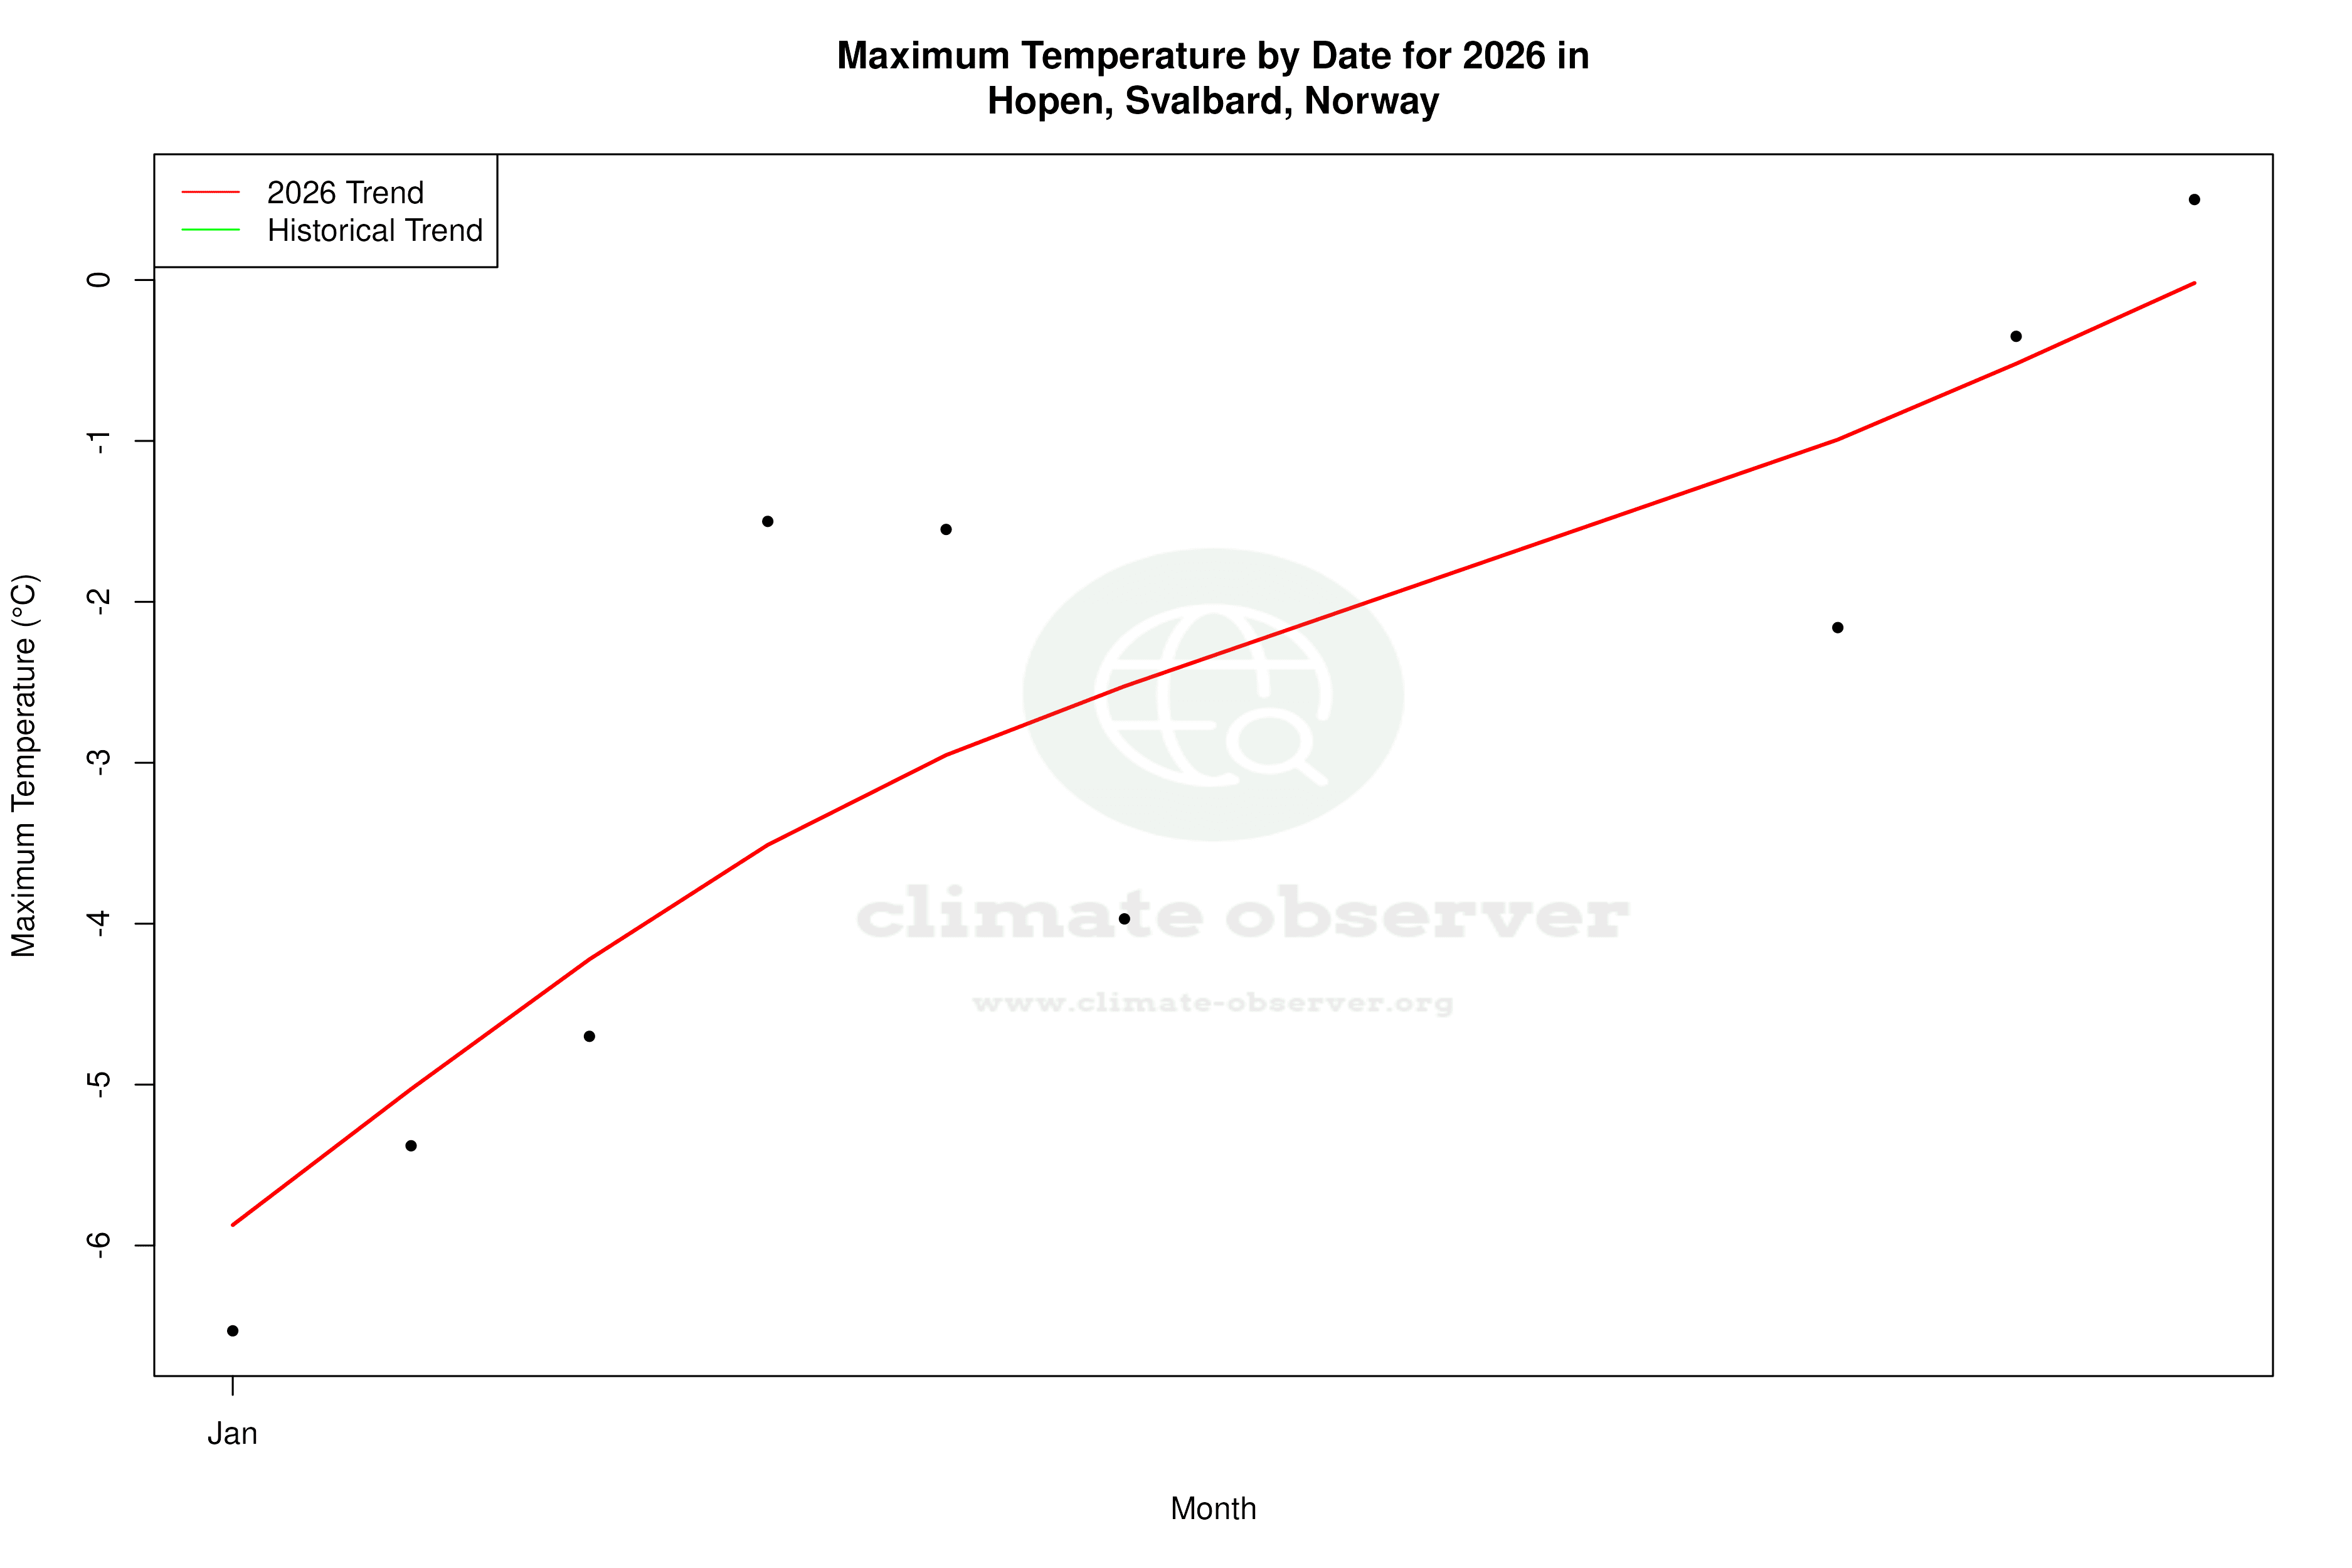


Max Temperature this Year | 1 of 6
Climate 12-Month Moving Averages
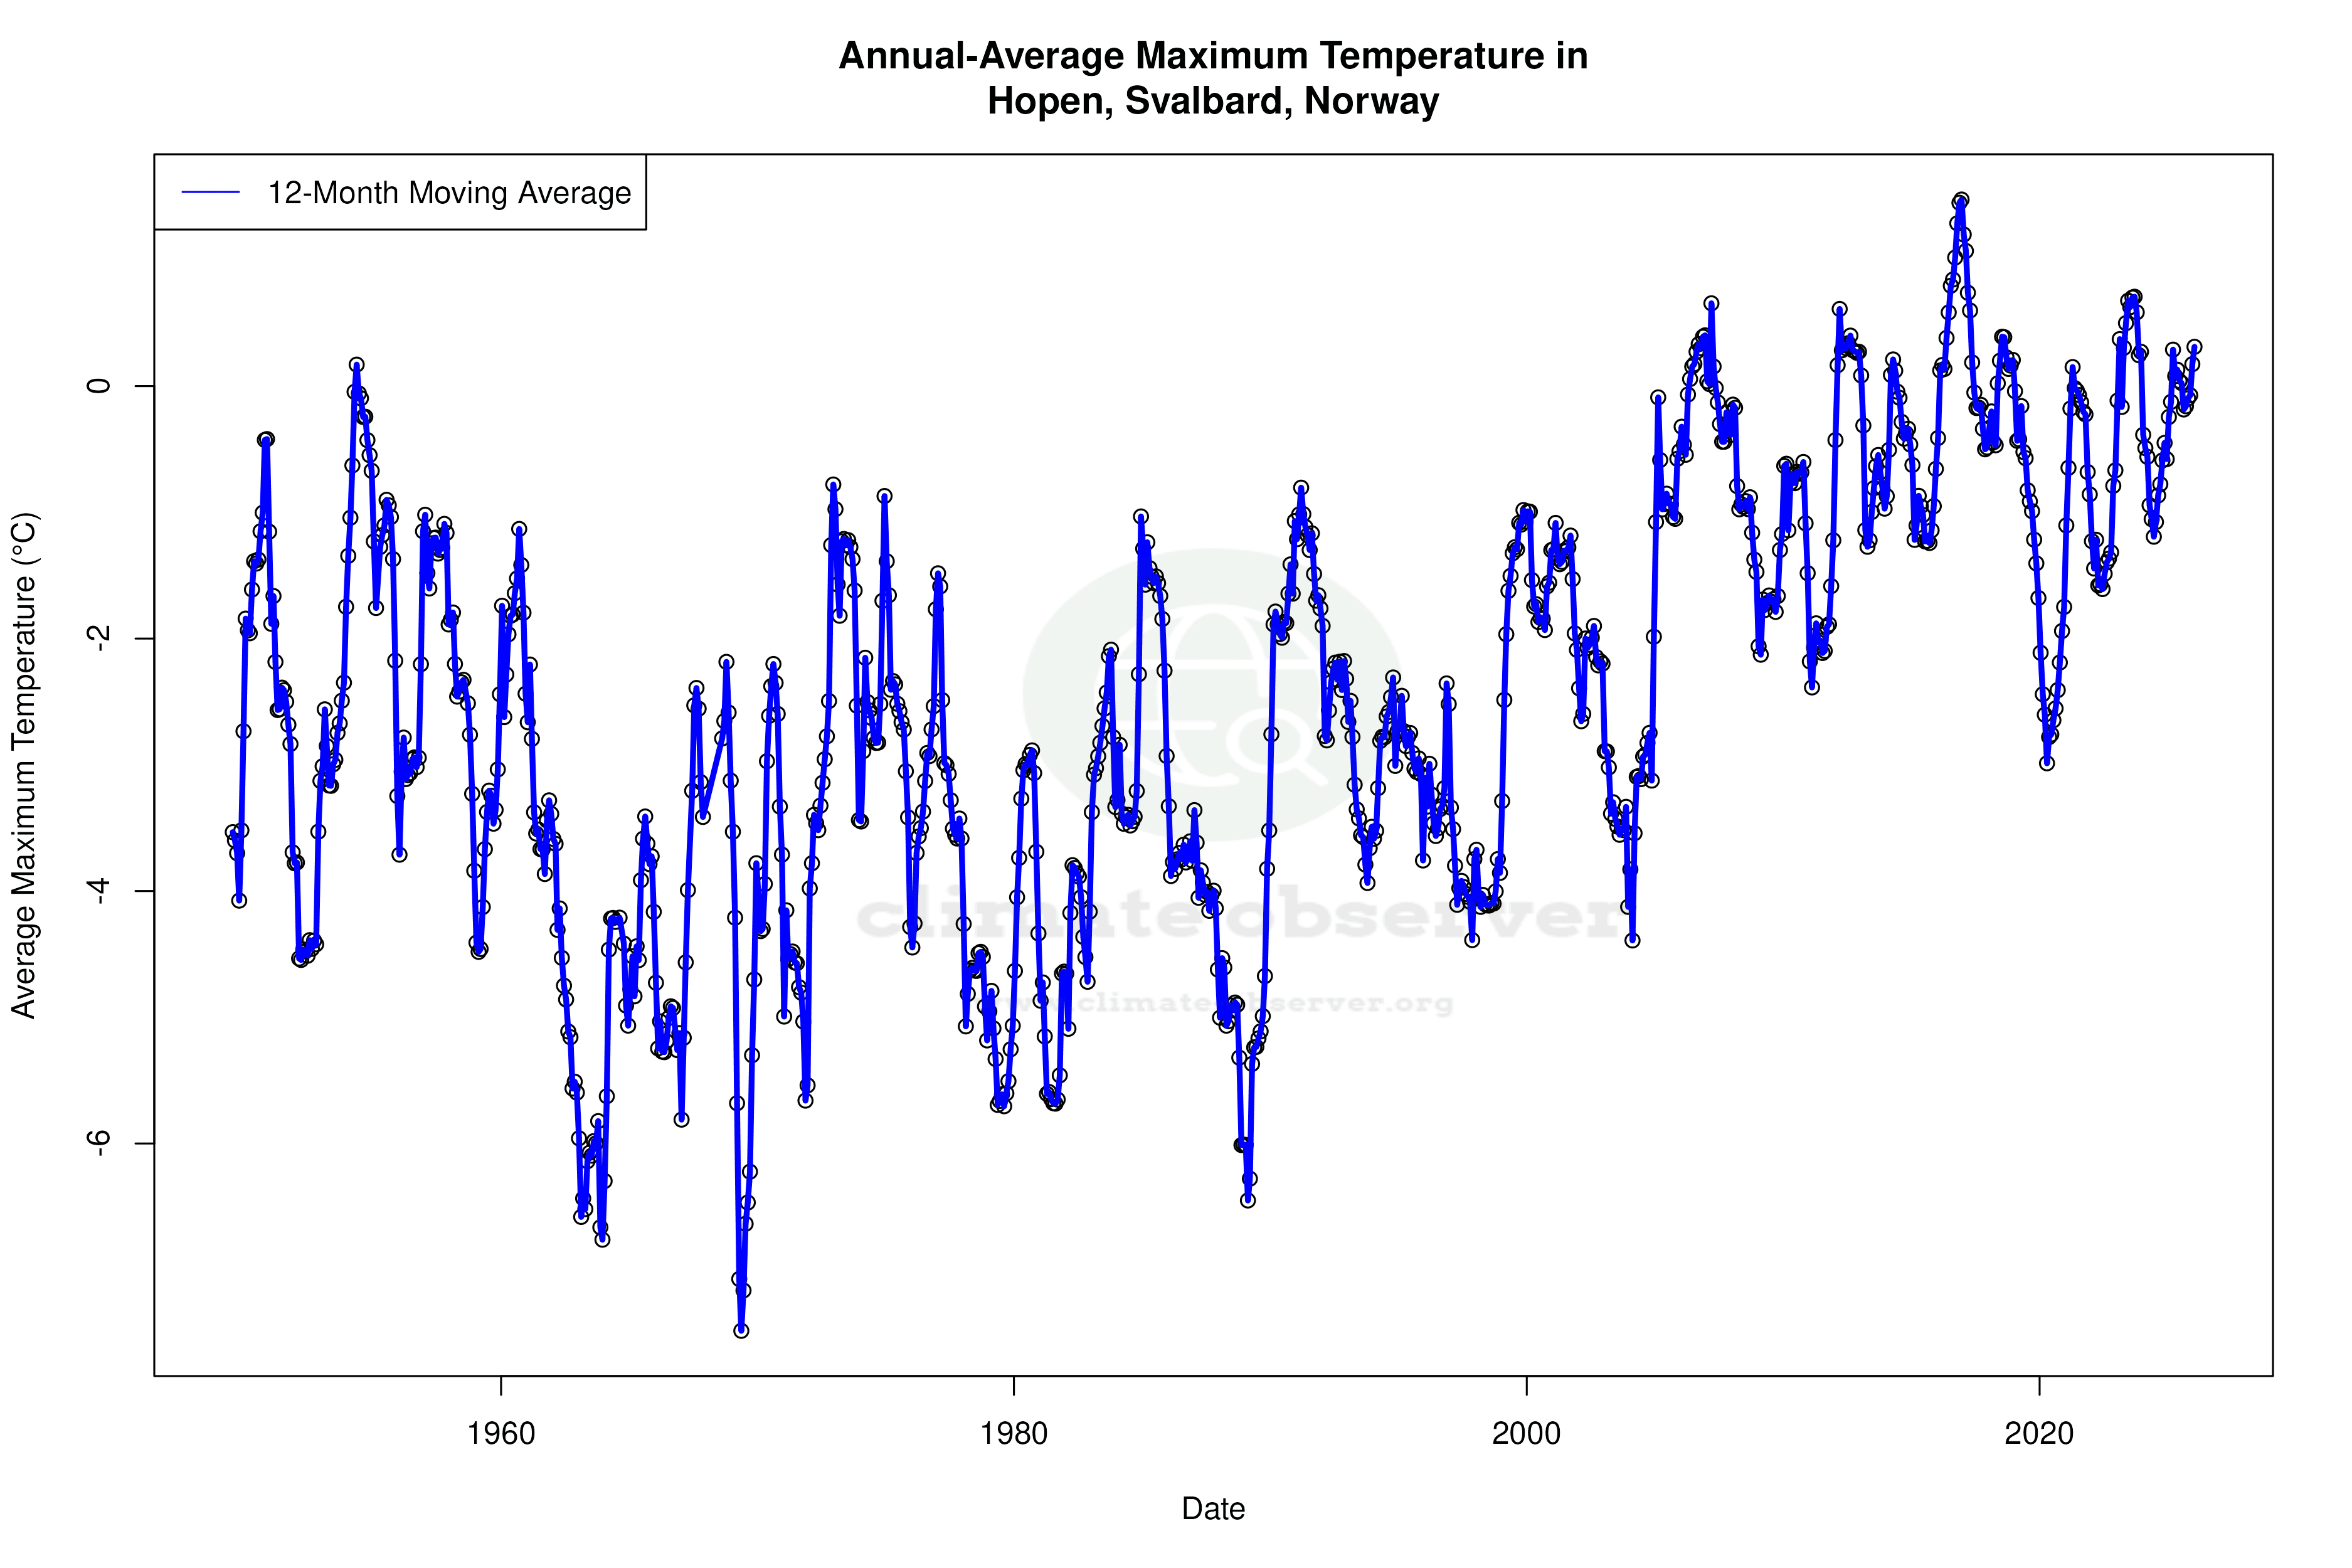


Max Temperature 12-Month MA | 1 of 6
Daily Data Points and Averages Throughout the Year
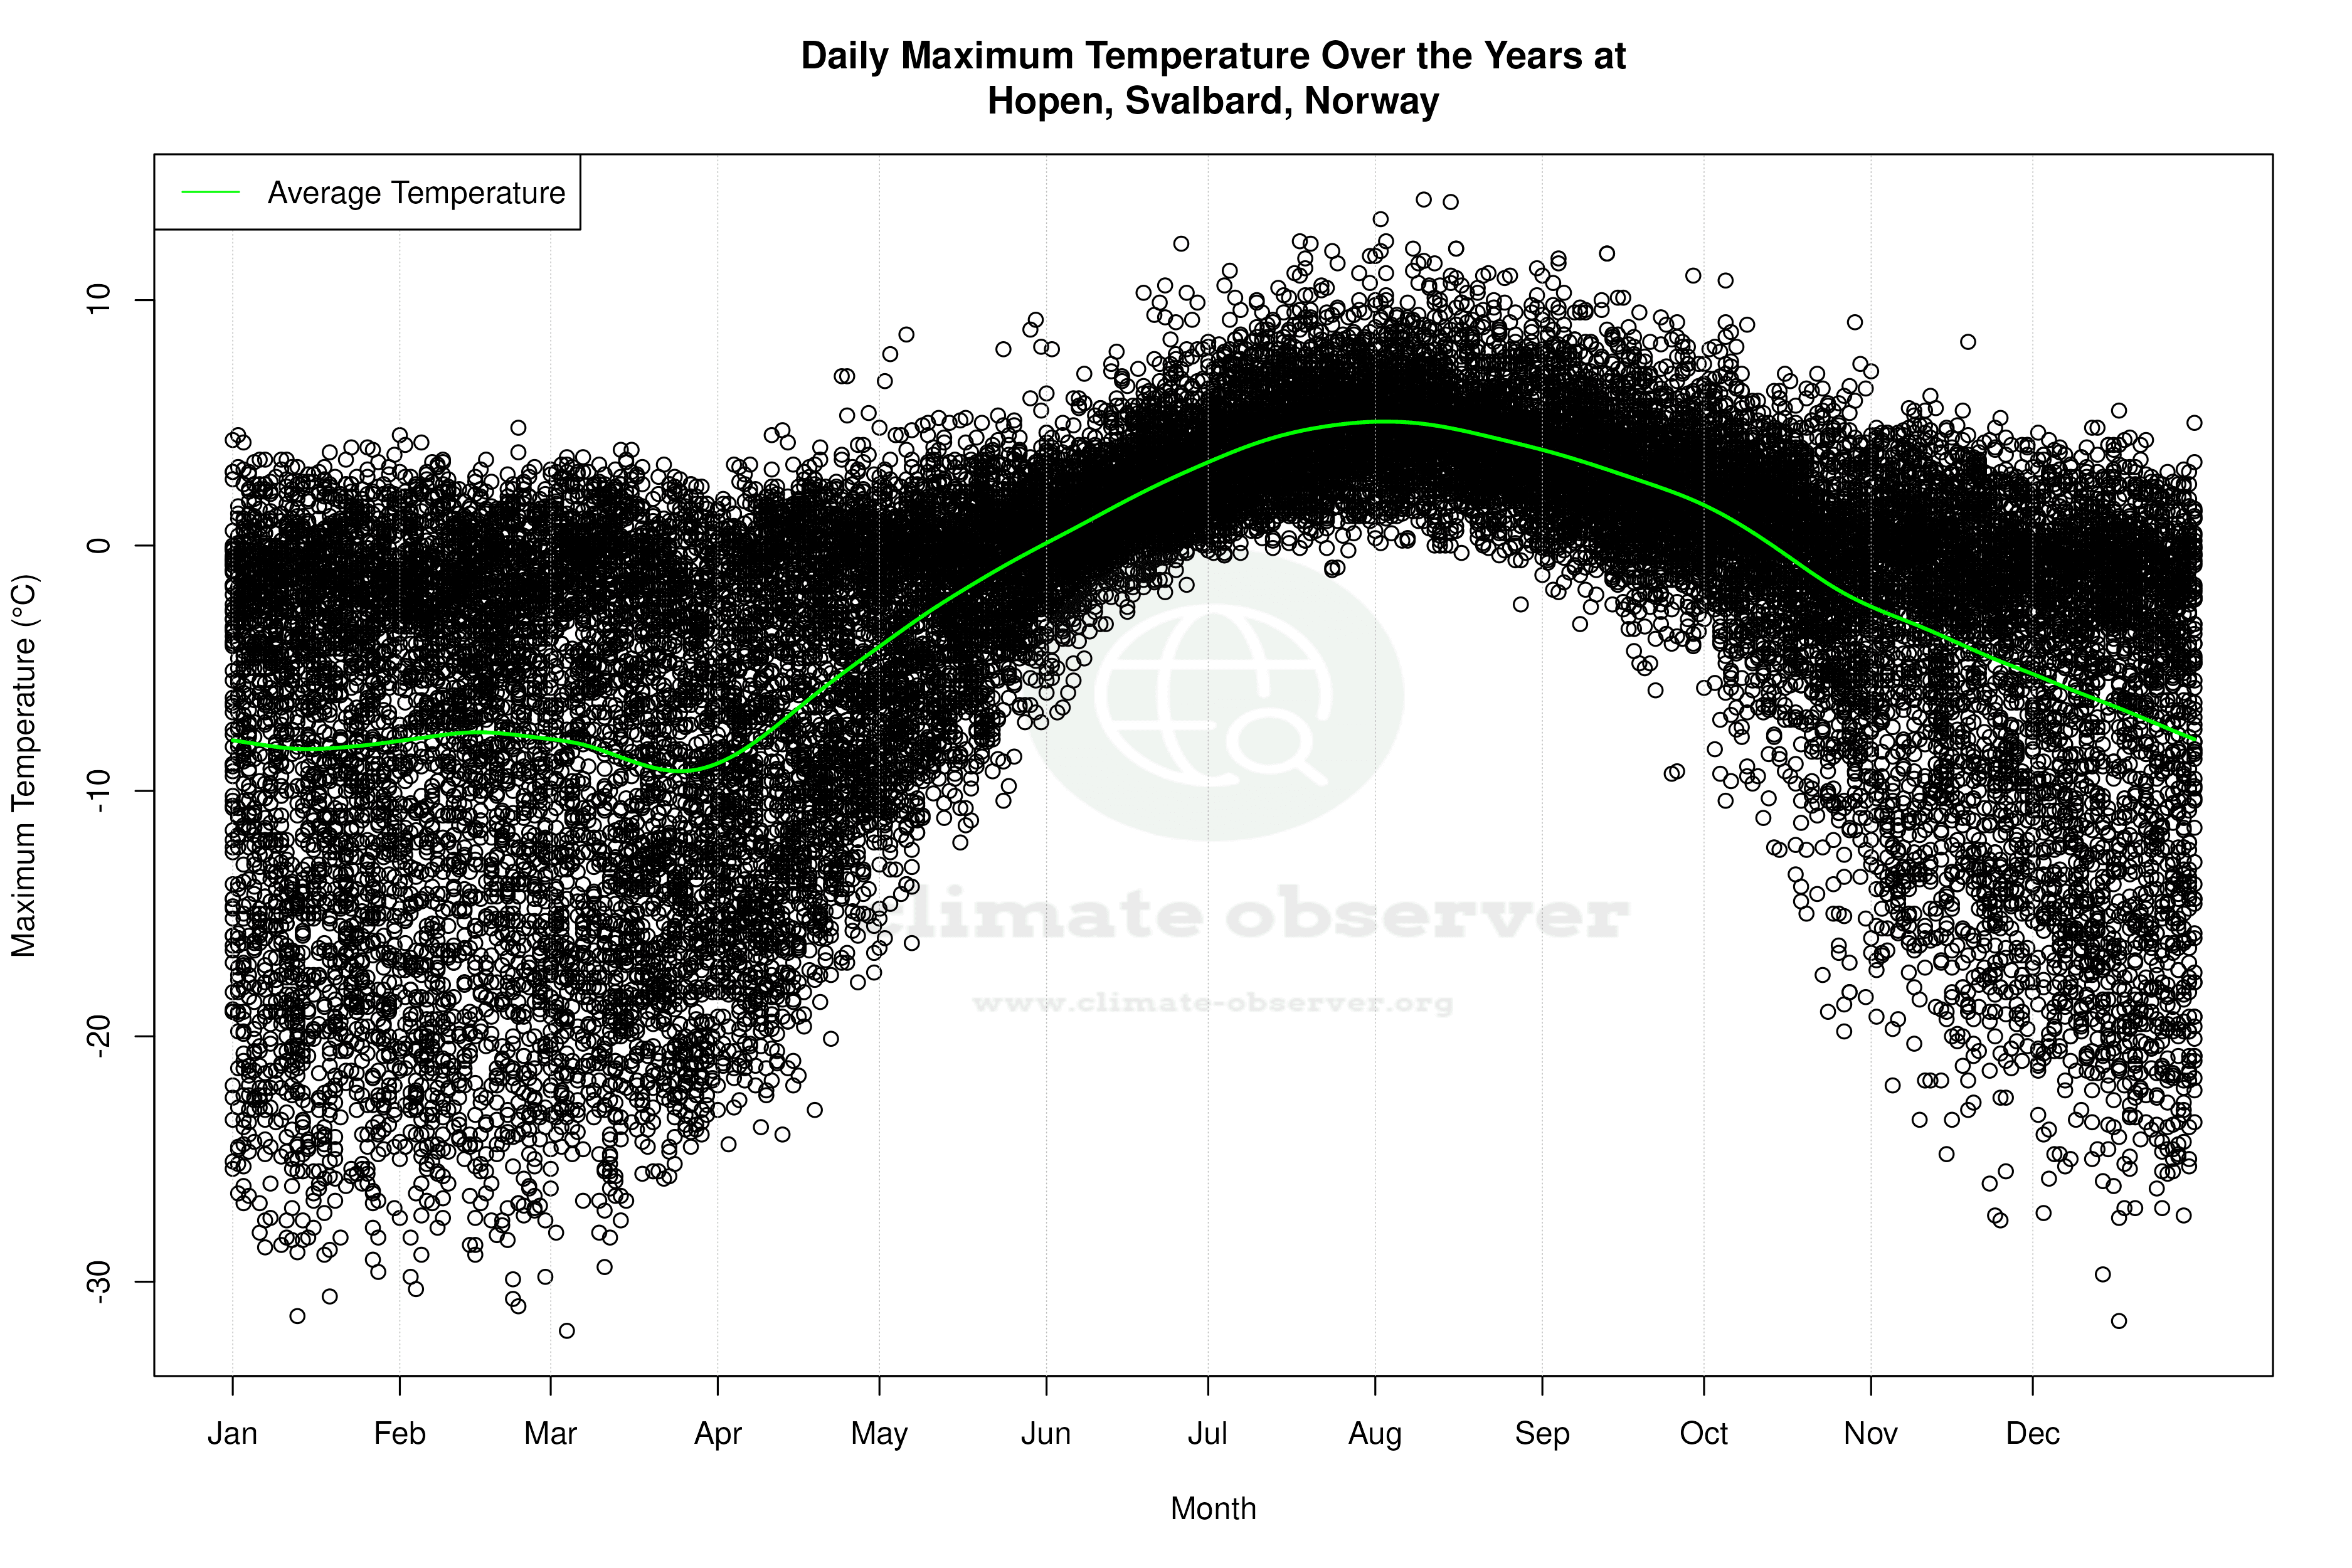
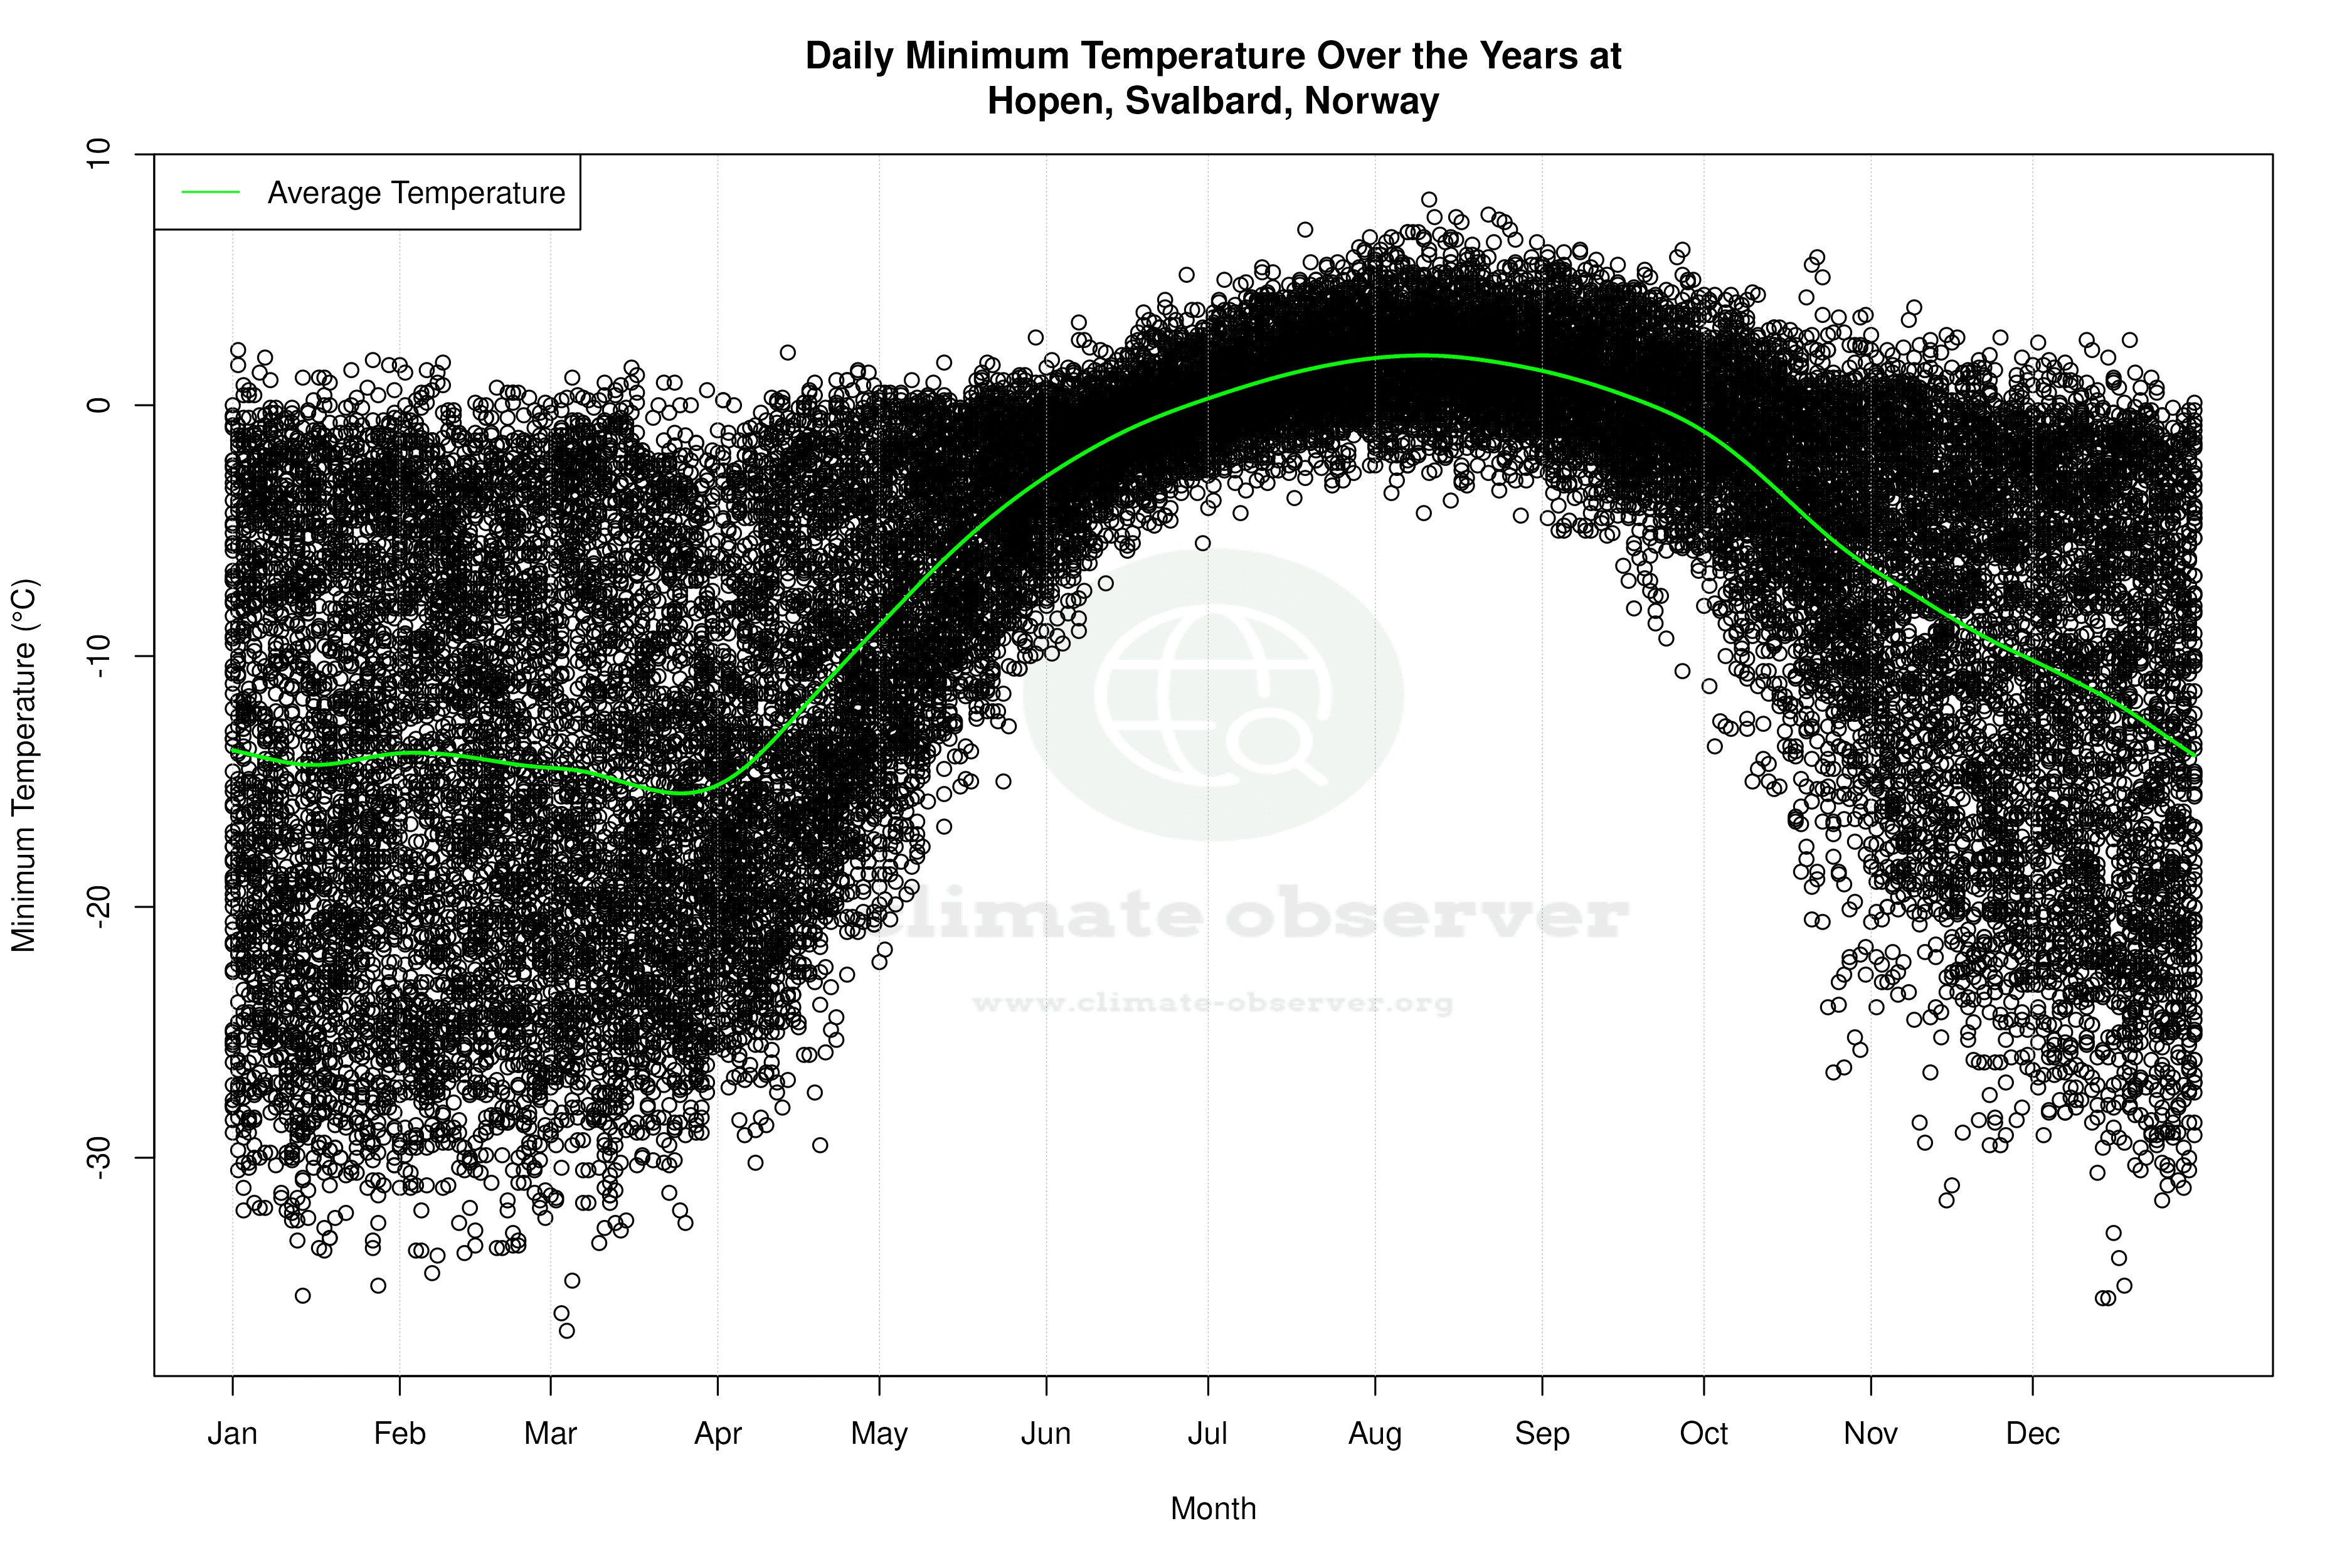
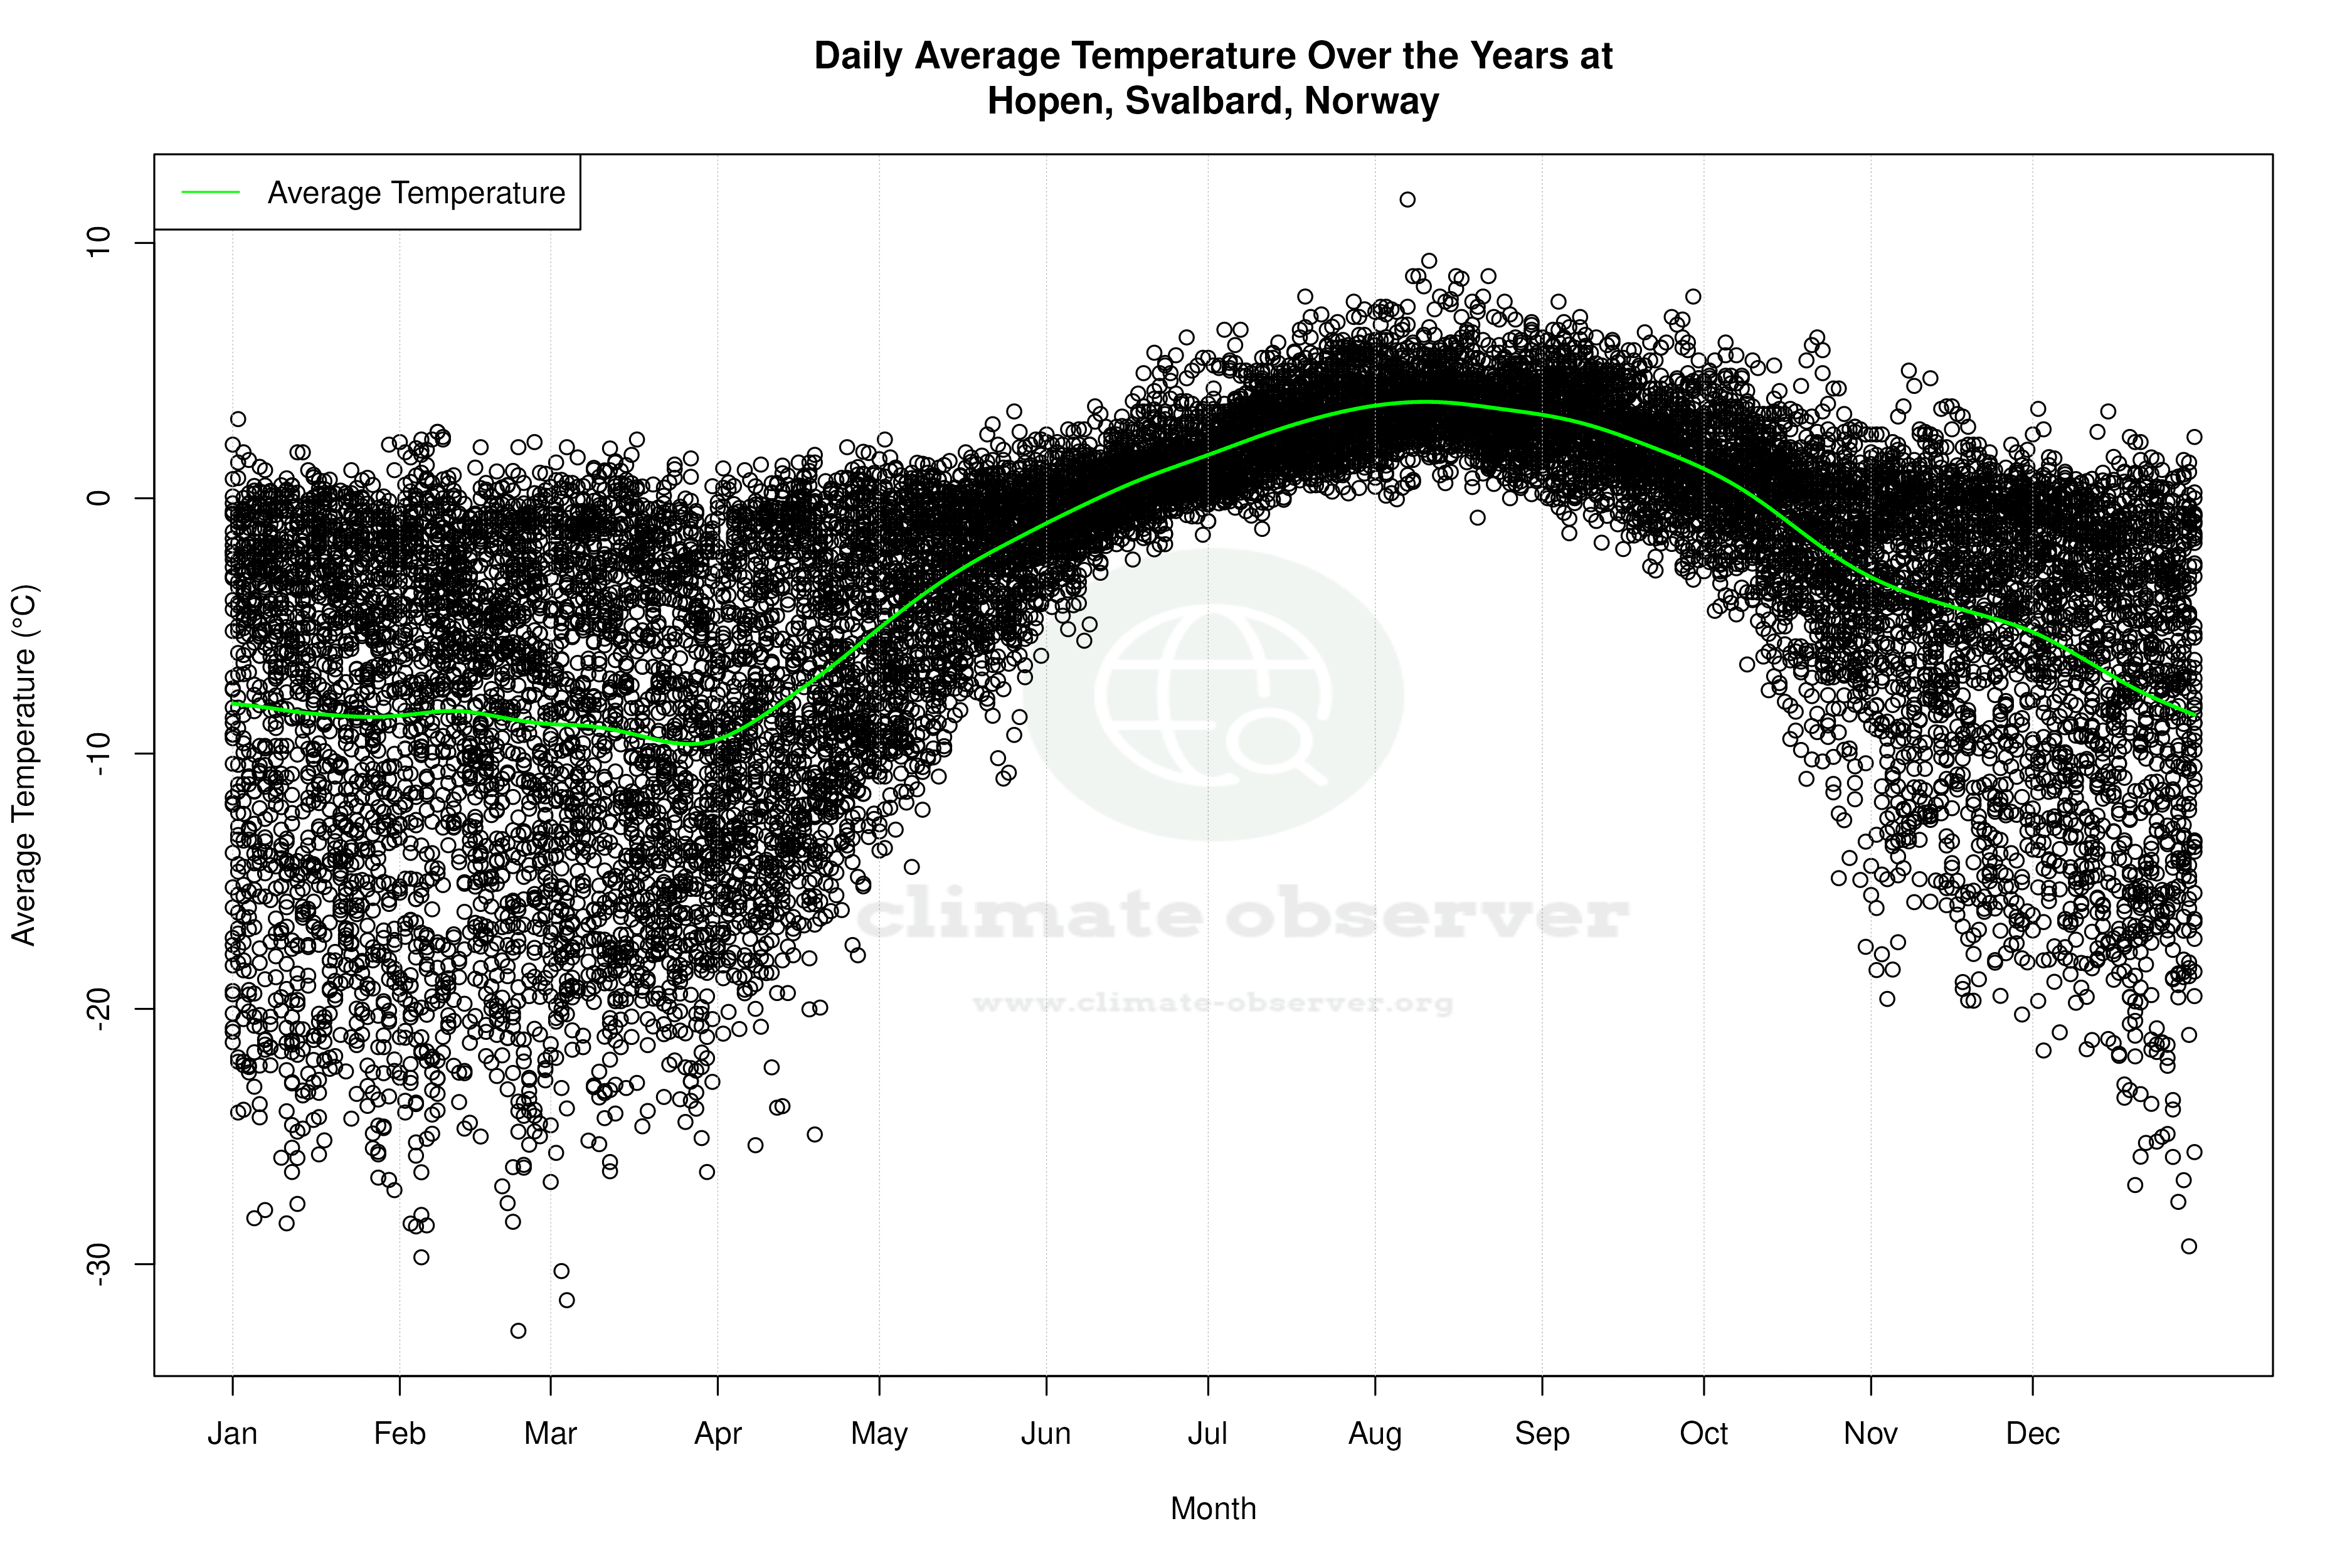


Average Max Temperature Throughout Year | 1 of 5