Climate for Station: Bardufoss, Troms og Finnmark, Norway
Loading live weather...
Climate Analysis & Overview
Bardufoss, situated within the Arctic Circle, is experiencing a warming trend, with notable increases in both high and low temperatures over the past decade. While the all-time temperature trends show a more modest rise, the recent decade indicates a more pronounced warming. Precipitation patterns have become more evenly distributed, suggesting a shift in local weather dynamics.
Arctic Climate Dynamics
Bardufoss, located at 69.0589°N, 18.5403°E, is characterised by a subarctic climate (Dfc) under the Köppen classification. This region experiences long, cold winters and short, mild summers. The local geography, with its proximity to the Norwegian Sea and surrounding mountainous terrain, plays a significant role in shaping its climate. The mountains act as barriers, influencing wind patterns and precipitation distribution.
Temperature Trends: A Decade of Change
Over the last decade, Bardufoss has seen a warming trend, with high temperatures increasing by 0.9999°C (1.80°F) and low temperatures rising by 1.19°C (2.14°F). These figures reflect a significant shift compared to the all-time trends, where high temperatures have risen by a more modest 0.21°C (0.38°F) and low temperatures by 0.16°C (0.29°F). This recent decade's warming is more pronounced, indicating potential impacts from global climate change and regional weather patterns.
Record Extremes: The Temperature Spectrum
Bardufoss has recorded extreme temperatures, with a maximum of 33.5°C (92.3°F) and a minimum of -38.1°C (-36.6°F). These records highlight the substantial temperature range experienced in this subarctic region. Such extremes are crucial for understanding the resilience and adaptability of local ecosystems and communities.
Precipitation Patterns: A Shift Towards Even Distribution
The Precipitation Concentration Index (PCI) for Bardufoss has decreased from a baseline of 11.3 to a current value of 10.4. This shift indicates that precipitation is now more evenly distributed throughout the year, rather than being concentrated in fewer, intense events. Such a change can have implications for water resource management and agriculture, potentially reducing the risk of flooding and improving water availability for local flora and fauna.
Regional Climate Goals and Implications
Norway's commitment to reducing greenhouse gas emissions and enhancing climate resilience is critical for regions like Bardufoss. The observed warming trends and shifts in precipitation patterns underscore the importance of these goals. Recent weather events, such as unseasonably warm winters or intense summer heatwaves, serve as reminders of the challenges posed by climate change. Understanding these localised changes is essential for developing effective adaptation strategies and ensuring sustainable development in the region.
Station Statistics
10-Year Trend
High: +2.02 °F/decade
Low: +2.53 °F/decade
Rain: +0.002 in/decade
25-Year Trend
High: +0.76 °F/decade
Low: -0.67 °F/decade
Rain: -0.000 in/decade
50-Year Trend
High: +0.78 °F/decade
Low: +0.62 °F/decade
Rain: +0.002 in/decade
All-Time Trend
High: +0.38 °F/decade
Low: +0.29 °F/decade
Rain: +0.001 in/decade
Percentage Above-Average Days
Last 12 Months: 58.4%
This Year: 71.7%
Precipitation Concentration Index (PCI) ℹ️
Last 12 Months: 11.4
Historical Average: 12.0
Percentile Rank of Last 12 Months ℹ️
High: 99th percentile
Low: 94th percentile
Rain: 98th percentile
Change in Variance ℹ️
High: +13.3%
Low: +12.6%
Intraday: +37.5%
Data Coverage
74.8%
First Year of Data
1946
Station Location
Historical Weather Records
| Max High | Avg High | Min High | Max Avg | Avg Avg | Min Avg | Max Low | Avg Low | Min Low | Max Precipitation | Avg Precipitation | Max Snow | Avg Snow | |
|---|---|---|---|---|---|---|---|---|---|---|---|---|---|
| Record | 92.30 °F | — | -26.14 °F | — | — | — | 70.88 °F | — | -36.58 °F | 2.39 in | — | — | — |
| January | 49.82 °F | 22.82 °F | -23.80 °F | — | — | — | 40.64 °F | 6.42 °F | -33.16 °F | 1.50 in | 0.08 in | — | — |
| February | 49.10 °F | 24.49 °F | -17.68 °F | — | — | — | 44.78 °F | 8.00 °F | -30.64 °F | 2.11 in | 0.08 in | — | — |
| March | 53.42 °F | 32.23 °F | 6.44 °F | — | — | — | 42.26 °F | 14.12 °F | -25.06 °F | 1.98 in | 0.07 in | — | — |
| April | 63.50 °F | 39.92 °F | 22.64 °F | — | — | — | 45.86 °F | 23.81 °F | -14.80 °F | 0.95 in | 0.05 in | — | — |
| May | 81.86 °F | 49.13 °F | 31.82 °F | — | — | — | 57.20 °F | 34.49 °F | 11.84 °F | 1.45 in | 0.04 in | — | — |
| June | 88.52 °F | 58.79 °F | 37.04 °F | — | — | — | 63.68 °F | 43.78 °F | 28.40 °F | 1.21 in | 0.06 in | — | — |
| July | 92.30 °F | 64.54 °F | 43.88 °F | — | — | — | 69.44 °F | 48.73 °F | 33.08 °F | 2.39 in | 0.07 in | — | — |
| August | 89.96 °F | 61.52 °F | 43.34 °F | — | — | — | 70.88 °F | 45.70 °F | 24.80 °F | 1.67 in | 0.08 in | — | — |
| September | 76.64 °F | 52.49 °F | 31.82 °F | — | — | — | 61.34 °F | 37.89 °F | 9.68 °F | 1.19 in | 0.09 in | — | — |
| October | 68.00 °F | 40.12 °F | 0.68 °F | — | — | — | 51.80 °F | 27.85 °F | -13.90 °F | 1.87 in | 0.09 in | — | — |
| November | 54.68 °F | 29.72 °F | -15.34 °F | — | — | — | 47.30 °F | 16.05 °F | -21.64 °F | 1.64 in | 0.08 in | — | — |
| December | 50.18 °F | 25.24 °F | -26.14 °F | — | — | — | 42.26 °F | 9.36 °F | -36.58 °F | 1.56 in | 0.09 in | — | — |
Data Visualisations
Remove WatermarksCurrent Year Climate Trends vs Historical


Max Temperature this Year | 1 of 6
Climate 12-Month Moving Averages


Max Temperature 12-Month MA | 1 of 6
Daily Data Points and Averages Throughout the Year

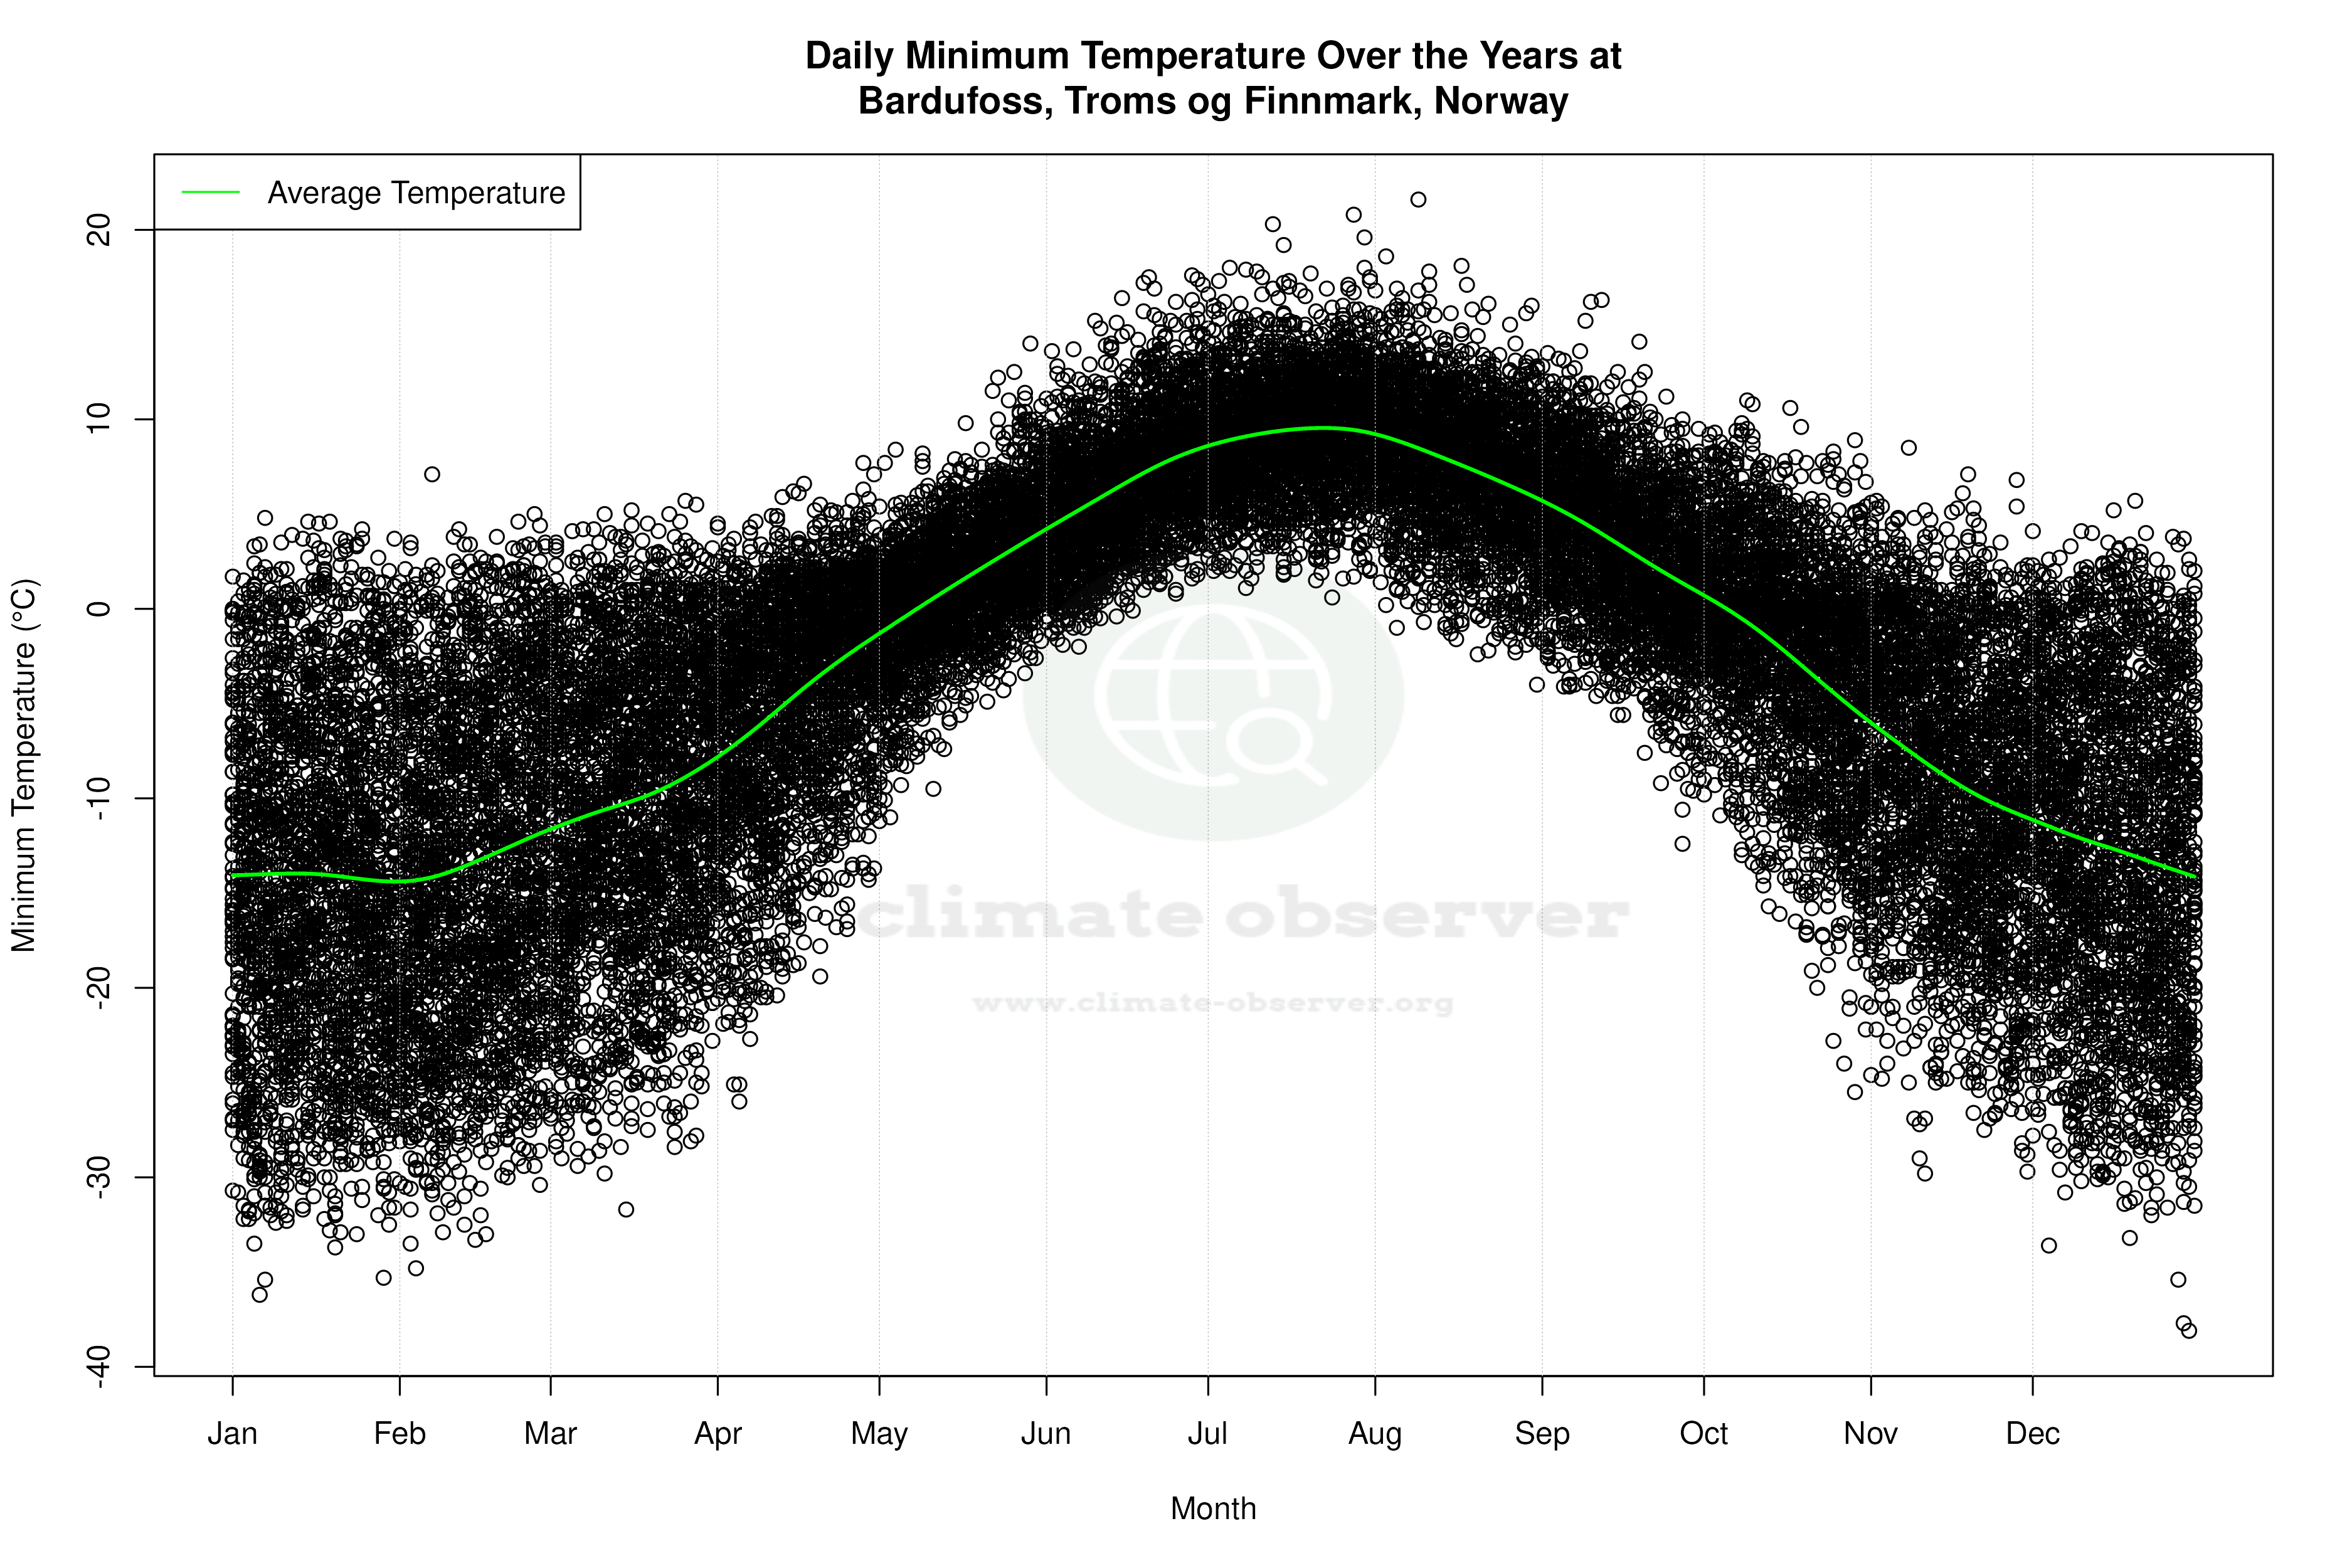


Average Max Temperature Throughout Year | 1 of 5
