Climate for Station: Gardermoen Sor, Viken, Norway
Loading live weather...
Climate Analysis & Overview
Gardermoen Sør, located in the heart of Norway, is experiencing a warming trend, with both high and low temperatures rising over the past decade. The region's precipitation patterns have become more evenly distributed, reflecting a shift in the local climate dynamics.
Köppen Climate Context and Geography
Gardermoen Sør, situated at 60.1881°N, 11.0742°E, falls under the Dfb classification in the Köppen climate system, indicating a humid continental climate with warm summers and no dry season. This location in Ullensaker, Akershus, is influenced by its proximity to the Oslofjord and surrounding forests, which moderate temperature extremes and contribute to its precipitation patterns. The local geography, including rolling hills and valleys, plays a crucial role in shaping the microclimate experienced at this station.
Warming Trends in Temperature
The all-time temperature trends at Gardermoen Sør reveal a warming pattern, with high temperatures showing a rise of 0.11°C (0.20°F) and low temperatures increasing by 0.14°C (0.25°F). Over the past decade, this warming trend has been more pronounced, with highs increasing by 0.43°C (0.78°F) and lows by 0.40°C (0.72°F). These changes suggest an acceleration in warming, which aligns with broader regional climate goals aimed at understanding and mitigating climate change impacts.
Precipitation Patterns and PCI Insights
The Precipitation Concentration Index (PCI) at Gardermoen Sør has decreased from a baseline of 11.80 to a current value of 9.84. This decrease indicates that precipitation is now more evenly distributed throughout the year, as opposed to being concentrated in fewer, more intense events. Such a shift can have significant implications for agriculture and water management, as it may reduce the risk of flooding and improve water availability.
Temperature Extremes and Records
Gardermoen Sør has recorded a maximum temperature of 34.6°C (94.3°F) and a minimum of -35.5°C (-31.9°F). These extremes highlight the variability inherent in a continental climate, where summers can be quite warm and winters extremely cold. The station's records provide a crucial baseline for assessing future climate variability and extremes in the region.
Regional Climate Goals and Recent Events
Norway has been proactive in addressing climate change, with a focus on reducing greenhouse gas emissions and enhancing climate resilience. The warming trends observed at Gardermoen Sør underscore the importance of these efforts. Recent weather events, such as unseasonably warm winters and wetter summers, reflect the ongoing changes in the region's climate. These shifts necessitate continued monitoring and adaptation to ensure sustainable development and environmental protection.
Station Statistics
10-Year Trend
High: +0.74 °F/decade
Low: +0.97 °F/decade
Rain: -0.003 in/decade
25-Year Trend
High: +0.57 °F/decade
Low: +0.97 °F/decade
Rain: -0.002 in/decade
50-Year Trend
High: +0.86 °F/decade
Low: +1.31 °F/decade
Rain: +0.003 in/decade
All-Time Trend
High: +0.21 °F/decade
Low: +0.26 °F/decade
Rain: +0.002 in/decade
Percentage Above-Average Days
Last 12 Months: 53.6%
This Year: 62.4%
Precipitation Concentration Index (PCI) ℹ️
Last 12 Months: 9.6
Historical Average: 11.4
Percentile Rank of Last 12 Months ℹ️
High: 92nd percentile
Low: 95th percentile
Rain: 44th percentile
Change in Variance ℹ️
High: -7.4%
Low: -14.8%
Intraday: -3.1%
Data Coverage
92.8%
First Year of Data
1937
Station Location
Historical Weather Records
| Max High | Avg High | Min High | Max Avg | Avg Avg | Min Avg | Max Low | Avg Low | Min Low | Max Precipitation | Avg Precipitation | Max Snow | Avg Snow | |
|---|---|---|---|---|---|---|---|---|---|---|---|---|---|
| Record | 94.28 °F | — | -9.40 °F | 77.18 °F | — | -19.48 °F | 69.98 °F | — | -31.90 °F | 2.35 in | — | — | — |
| January | 51.98 °F | 26.93 °F | -9.40 °F | 42.26 °F | 21.76 °F | -19.48 °F | 40.82 °F | 15.90 °F | -24.34 °F | 1.40 in | 0.07 in | — | — |
| February | 56.84 °F | 29.00 °F | -8.14 °F | 45.14 °F | 22.28 °F | -18.22 °F | 41.36 °F | 15.93 °F | -31.90 °F | 1.10 in | 0.06 in | — | — |
| March | 67.10 °F | 37.96 °F | 10.22 °F | 53.96 °F | 30.00 °F | -4.54 °F | 45.14 °F | 22.65 °F | -16.96 °F | 1.26 in | 0.05 in | — | — |
| April | 75.74 °F | 48.18 °F | 25.88 °F | 61.34 °F | 38.92 °F | 19.40 °F | 53.42 °F | 31.14 °F | 5.18 °F | 1.04 in | 0.06 in | — | — |
| May | 86.18 °F | 60.05 °F | 34.52 °F | 72.68 °F | 49.99 °F | 31.28 °F | 60.08 °F | 40.40 °F | 21.20 °F | 1.70 in | 0.07 in | — | — |
| June | 92.66 °F | 67.42 °F | 48.38 °F | 75.38 °F | 57.49 °F | 40.82 °F | 66.38 °F | 48.49 °F | 27.50 °F | 1.68 in | 0.09 in | — | — |
| July | 94.28 °F | 70.60 °F | 51.08 °F | 77.18 °F | 61.10 °F | 45.50 °F | 69.98 °F | 52.42 °F | 35.42 °F | 2.35 in | 0.11 in | — | — |
| August | 90.68 °F | 68.01 °F | 47.66 °F | 76.28 °F | 58.37 °F | 44.78 °F | 67.28 °F | 50.41 °F | 29.84 °F | 2.19 in | 0.12 in | — | — |
| September | 78.26 °F | 59.04 °F | 35.96 °F | 64.94 °F | 50.51 °F | 32.18 °F | 60.80 °F | 43.75 °F | 21.20 °F | 2.31 in | 0.11 in | — | — |
| October | 68.54 °F | 47.48 °F | 23.36 °F | 58.28 °F | 40.78 °F | 10.94 °F | 54.68 °F | 35.86 °F | 3.02 °F | 1.87 in | 0.11 in | — | — |
| November | 62.42 °F | 36.42 °F | 5.54 °F | 53.78 °F | 31.83 °F | 2.12 °F | 51.08 °F | 27.20 °F | -10.48 °F | 1.81 in | 0.10 in | — | — |
| December | 52.88 °F | 29.83 °F | -8.68 °F | 48.38 °F | 24.49 °F | -14.08 °F | 44.96 °F | 19.40 °F | -18.76 °F | 1.14 in | 0.07 in | — | — |
Data Visualisations
Remove WatermarksCurrent Year Climate Trends vs Historical


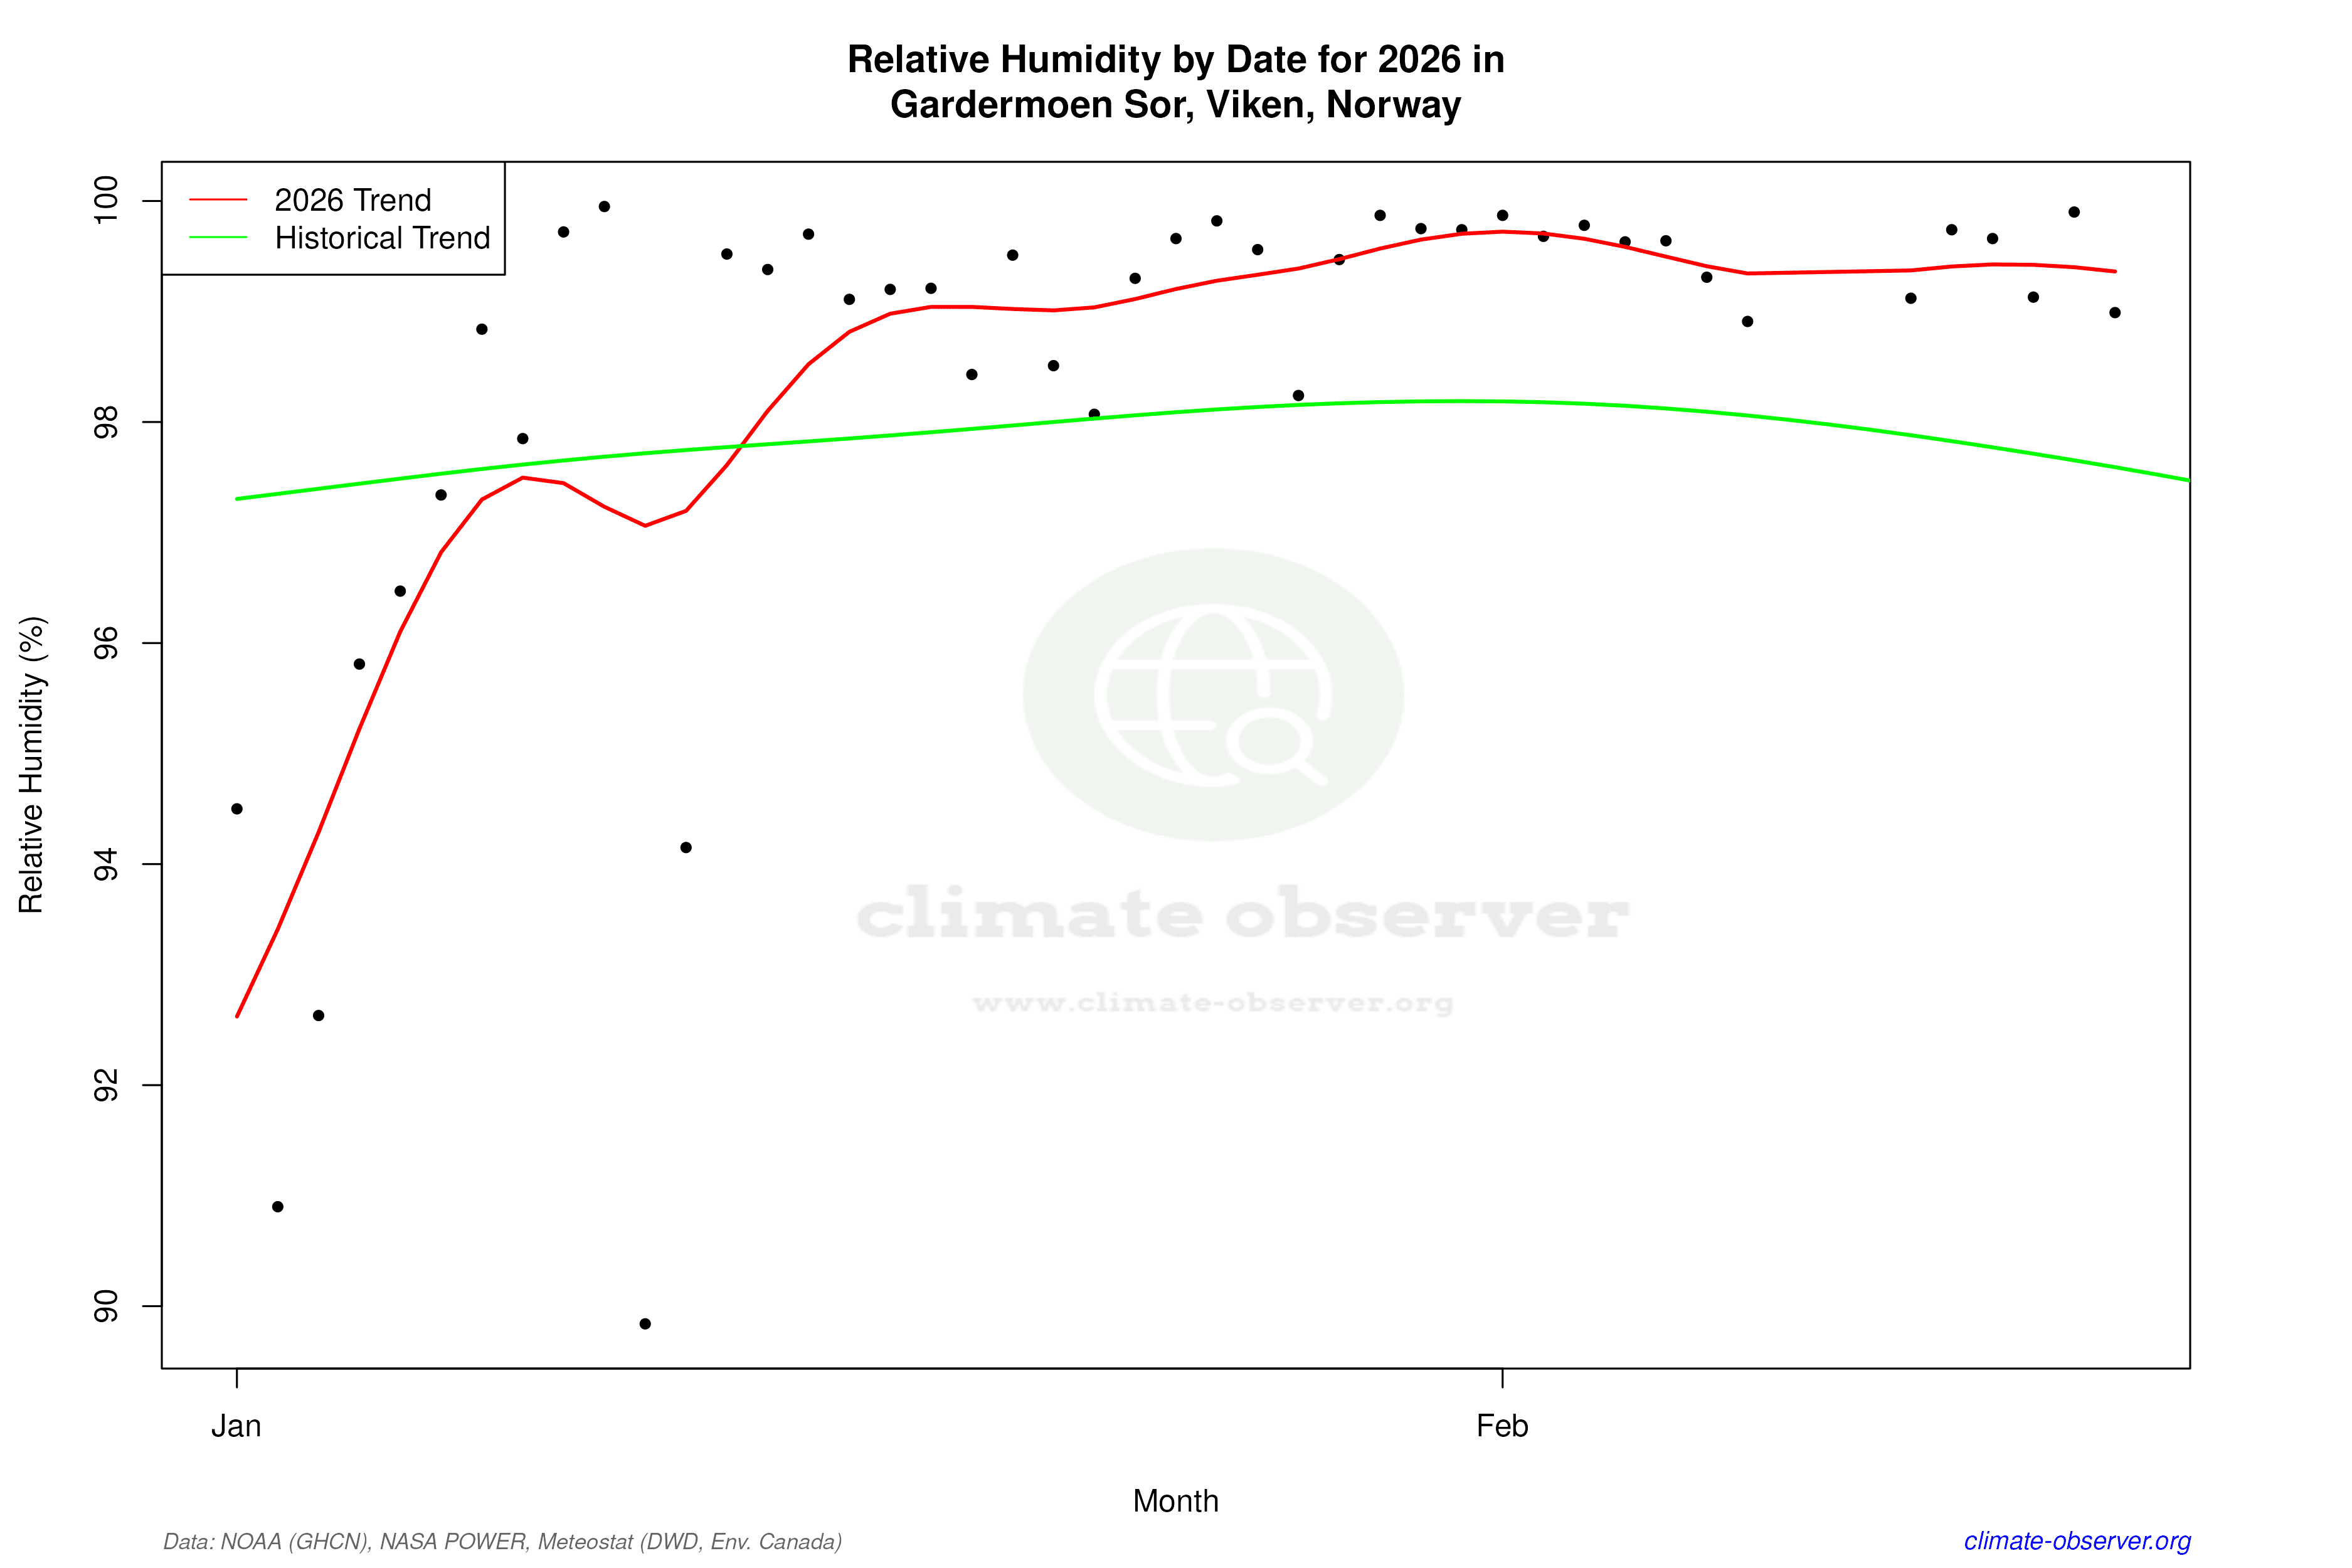

Max Temperature this Year | 1 of 6
Climate 12-Month Moving Averages


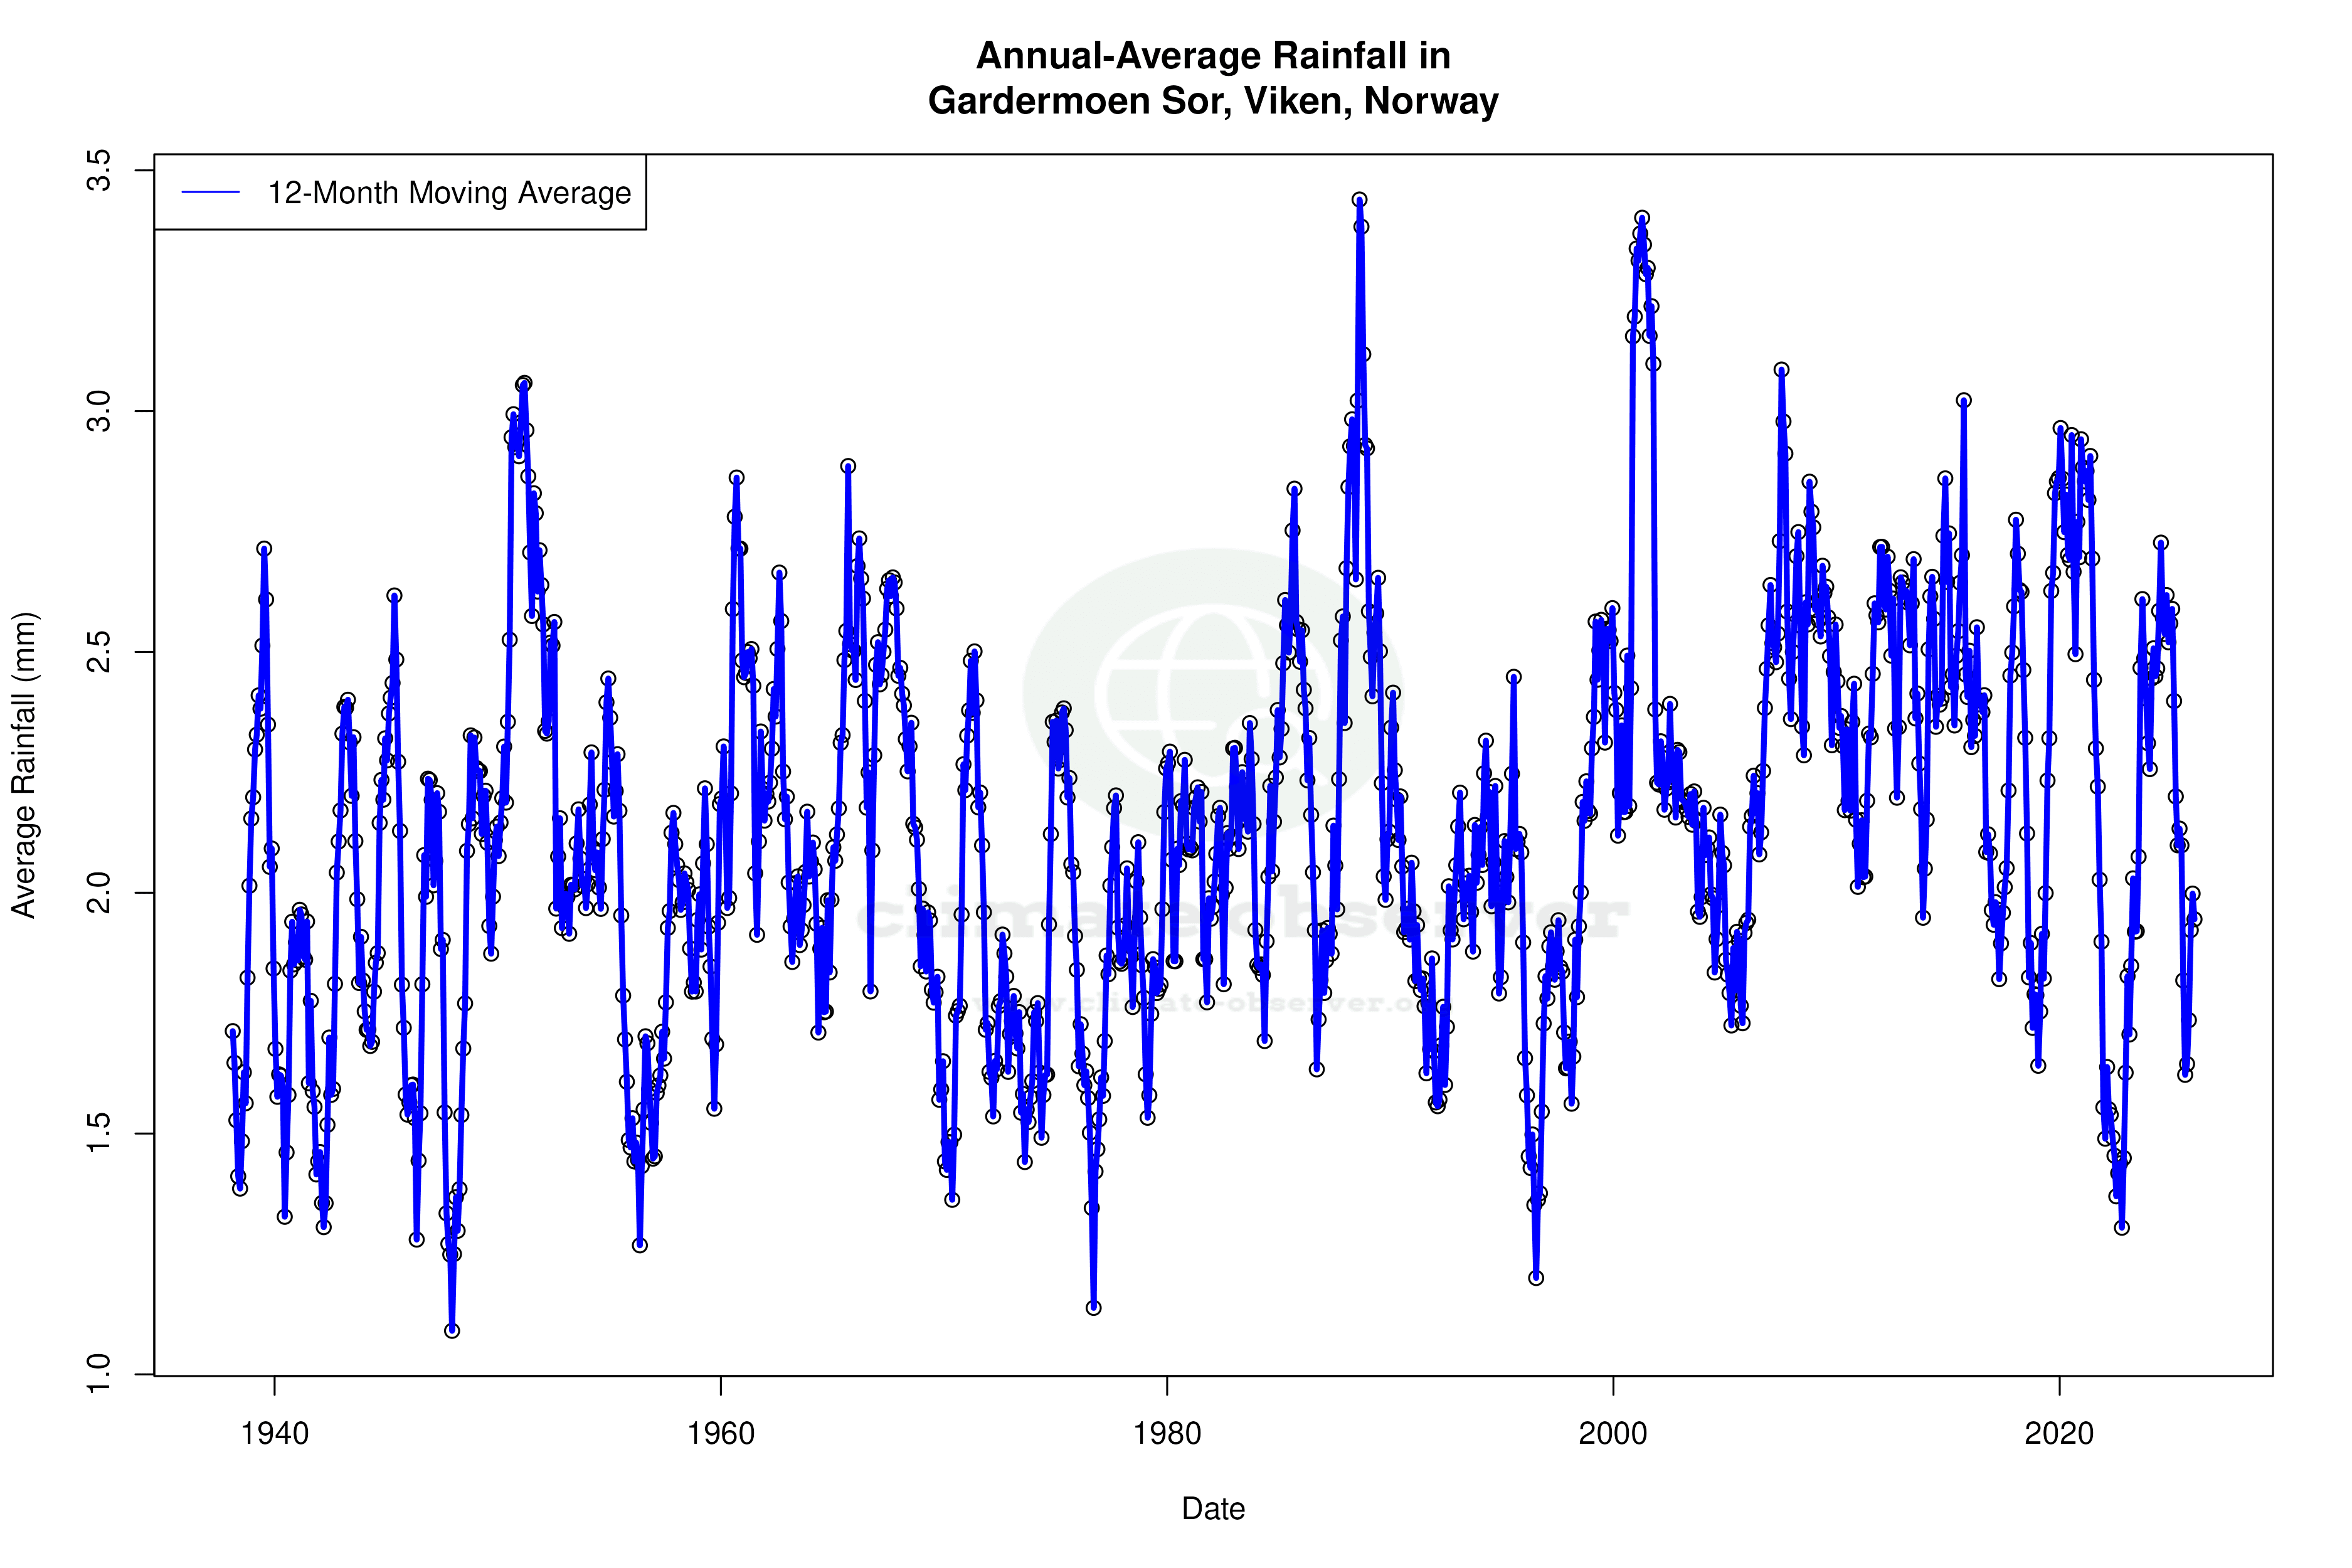
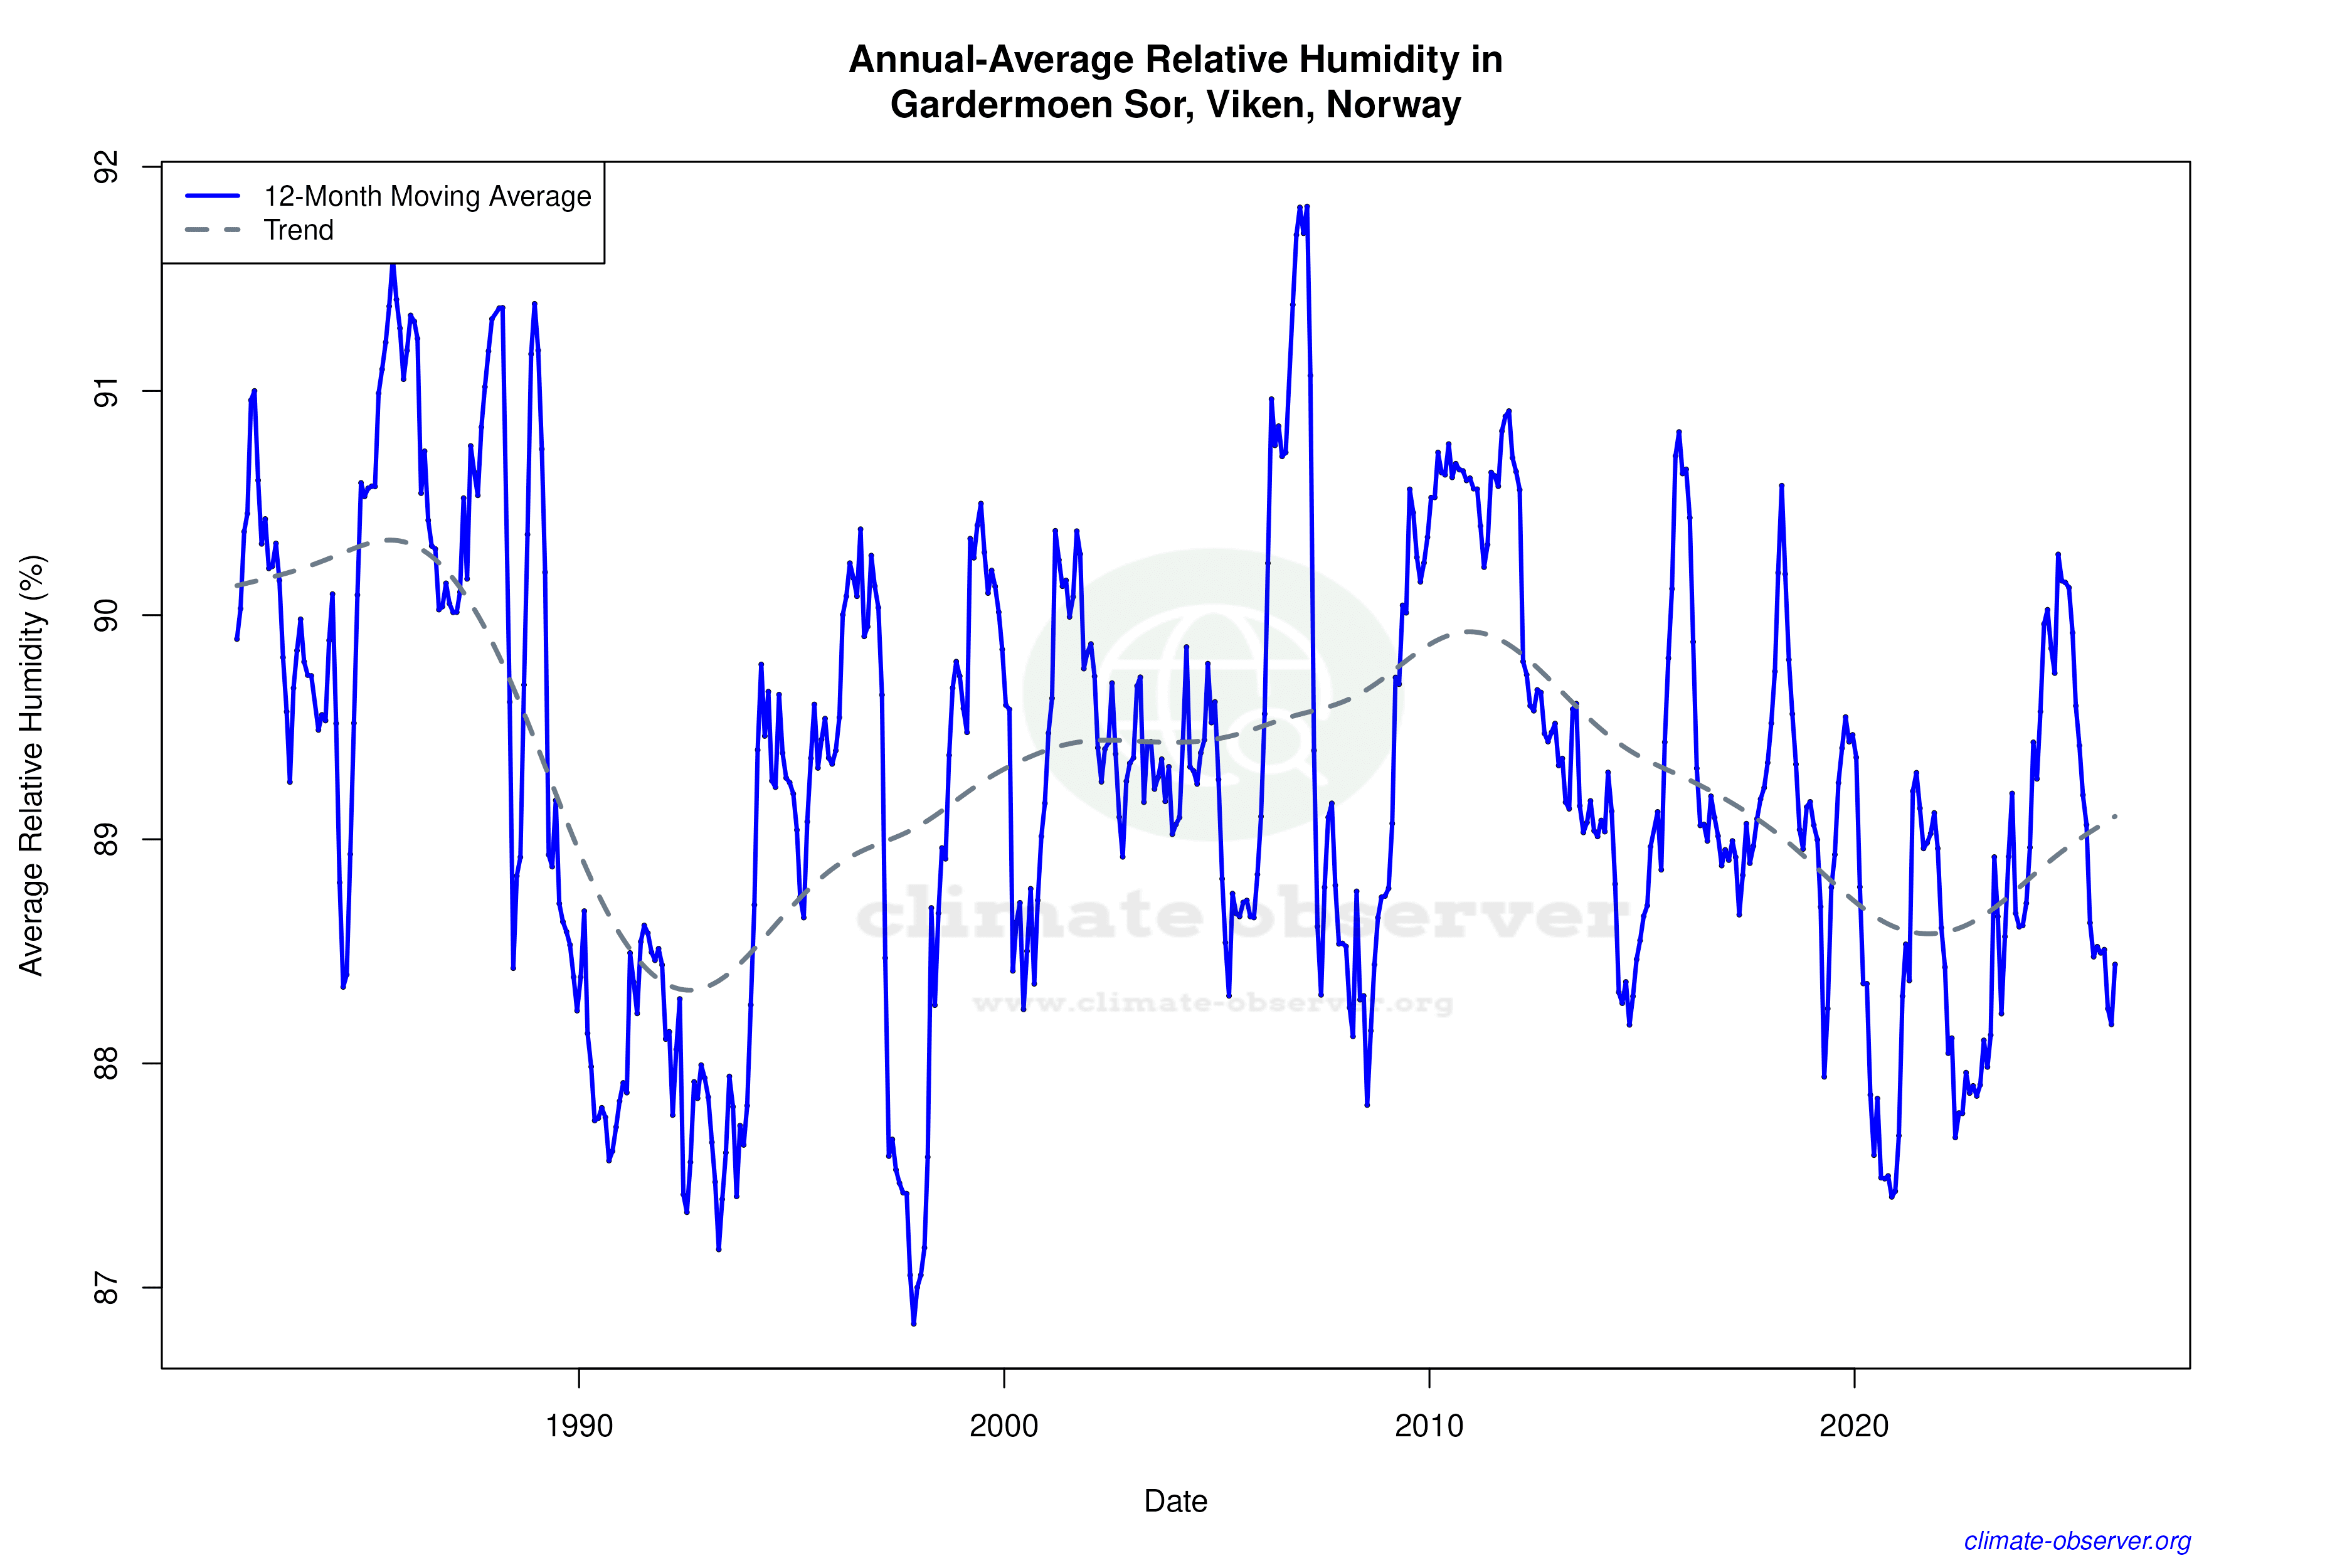

Max Temperature 12-Month MA | 1 of 6
Daily Data Points and Averages Throughout the Year


Average Max Temperature Throughout Year | 1 of 5
