Climate for Station: Sauda, Rogaland, Norway
Loading live weather...
Climate Analysis & Overview
Sauda, nestled in the rugged terrains of Norway, is experiencing a nuanced climate evolution. While the all-time temperature trends indicate a warming for lows by 0.27°C (0.49°F), the recent decade shows a contrasting cooling trend for lows by 0.46°C (0.83°F). Meanwhile, the Precipitation Concentration Index suggests a shift towards more evenly distributed rainfall.
Climate Classification and Geographic Influence
Sauda is classified under the Köppen climate system as Dfb, indicating a humid continental climate with no dry season and a warm summer. The region's geography, characterised by its proximity to fjords and mountainous landscapes, plays a significant role in shaping its climate patterns. The elevation and topography contribute to significant temperature variations and precipitation distribution, making the area prone to both warm summer days and cold winter nights.
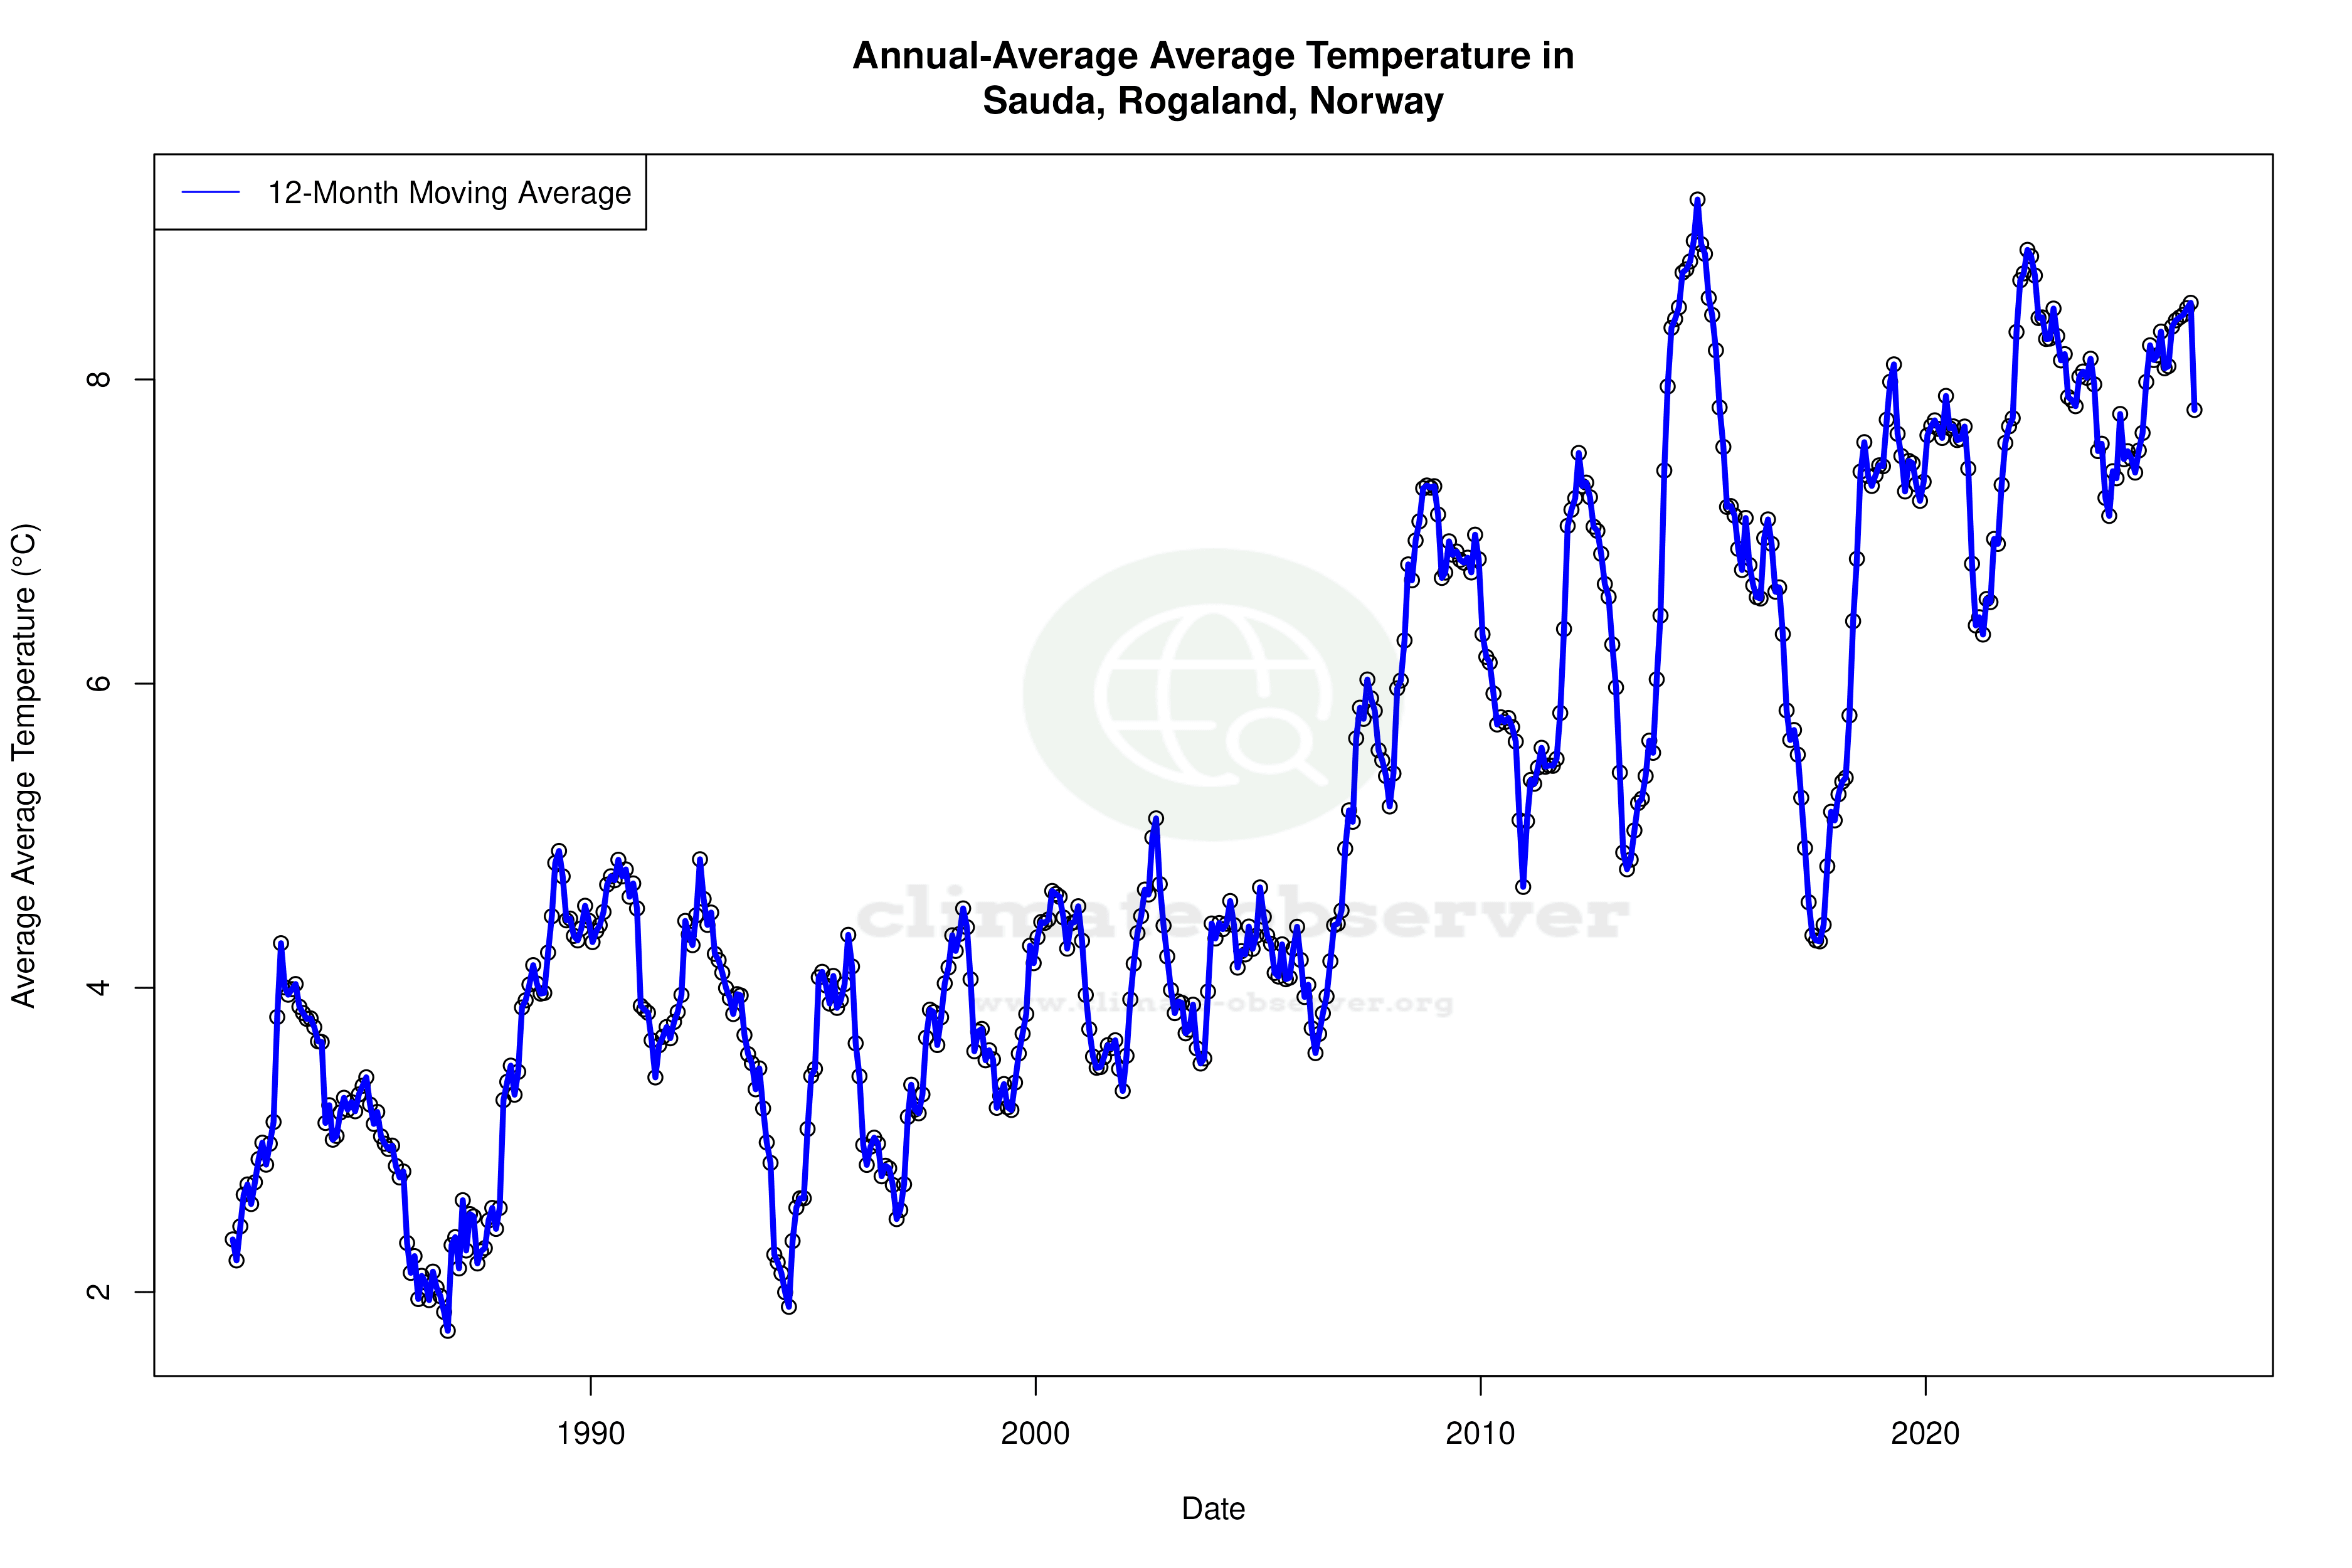
Temperature Trends: A Mixed Picture
In examining the temperature trends, Sauda presents a complex picture. Over the all-time period, there is a slight warming of high temperatures by 0.15°C (0.27°F). However, the last decade has seen a more pronounced increase in highs by 0.91°C (1.64°F), suggesting recent years have been warmer than the historical average. Conversely, the lows have shown a cooling trend over the decade, contrasting with the all-time warming trend. This dichotomy might reflect the broader regional climate goals of Norway, which aim to mitigate warming through sustainable practices.
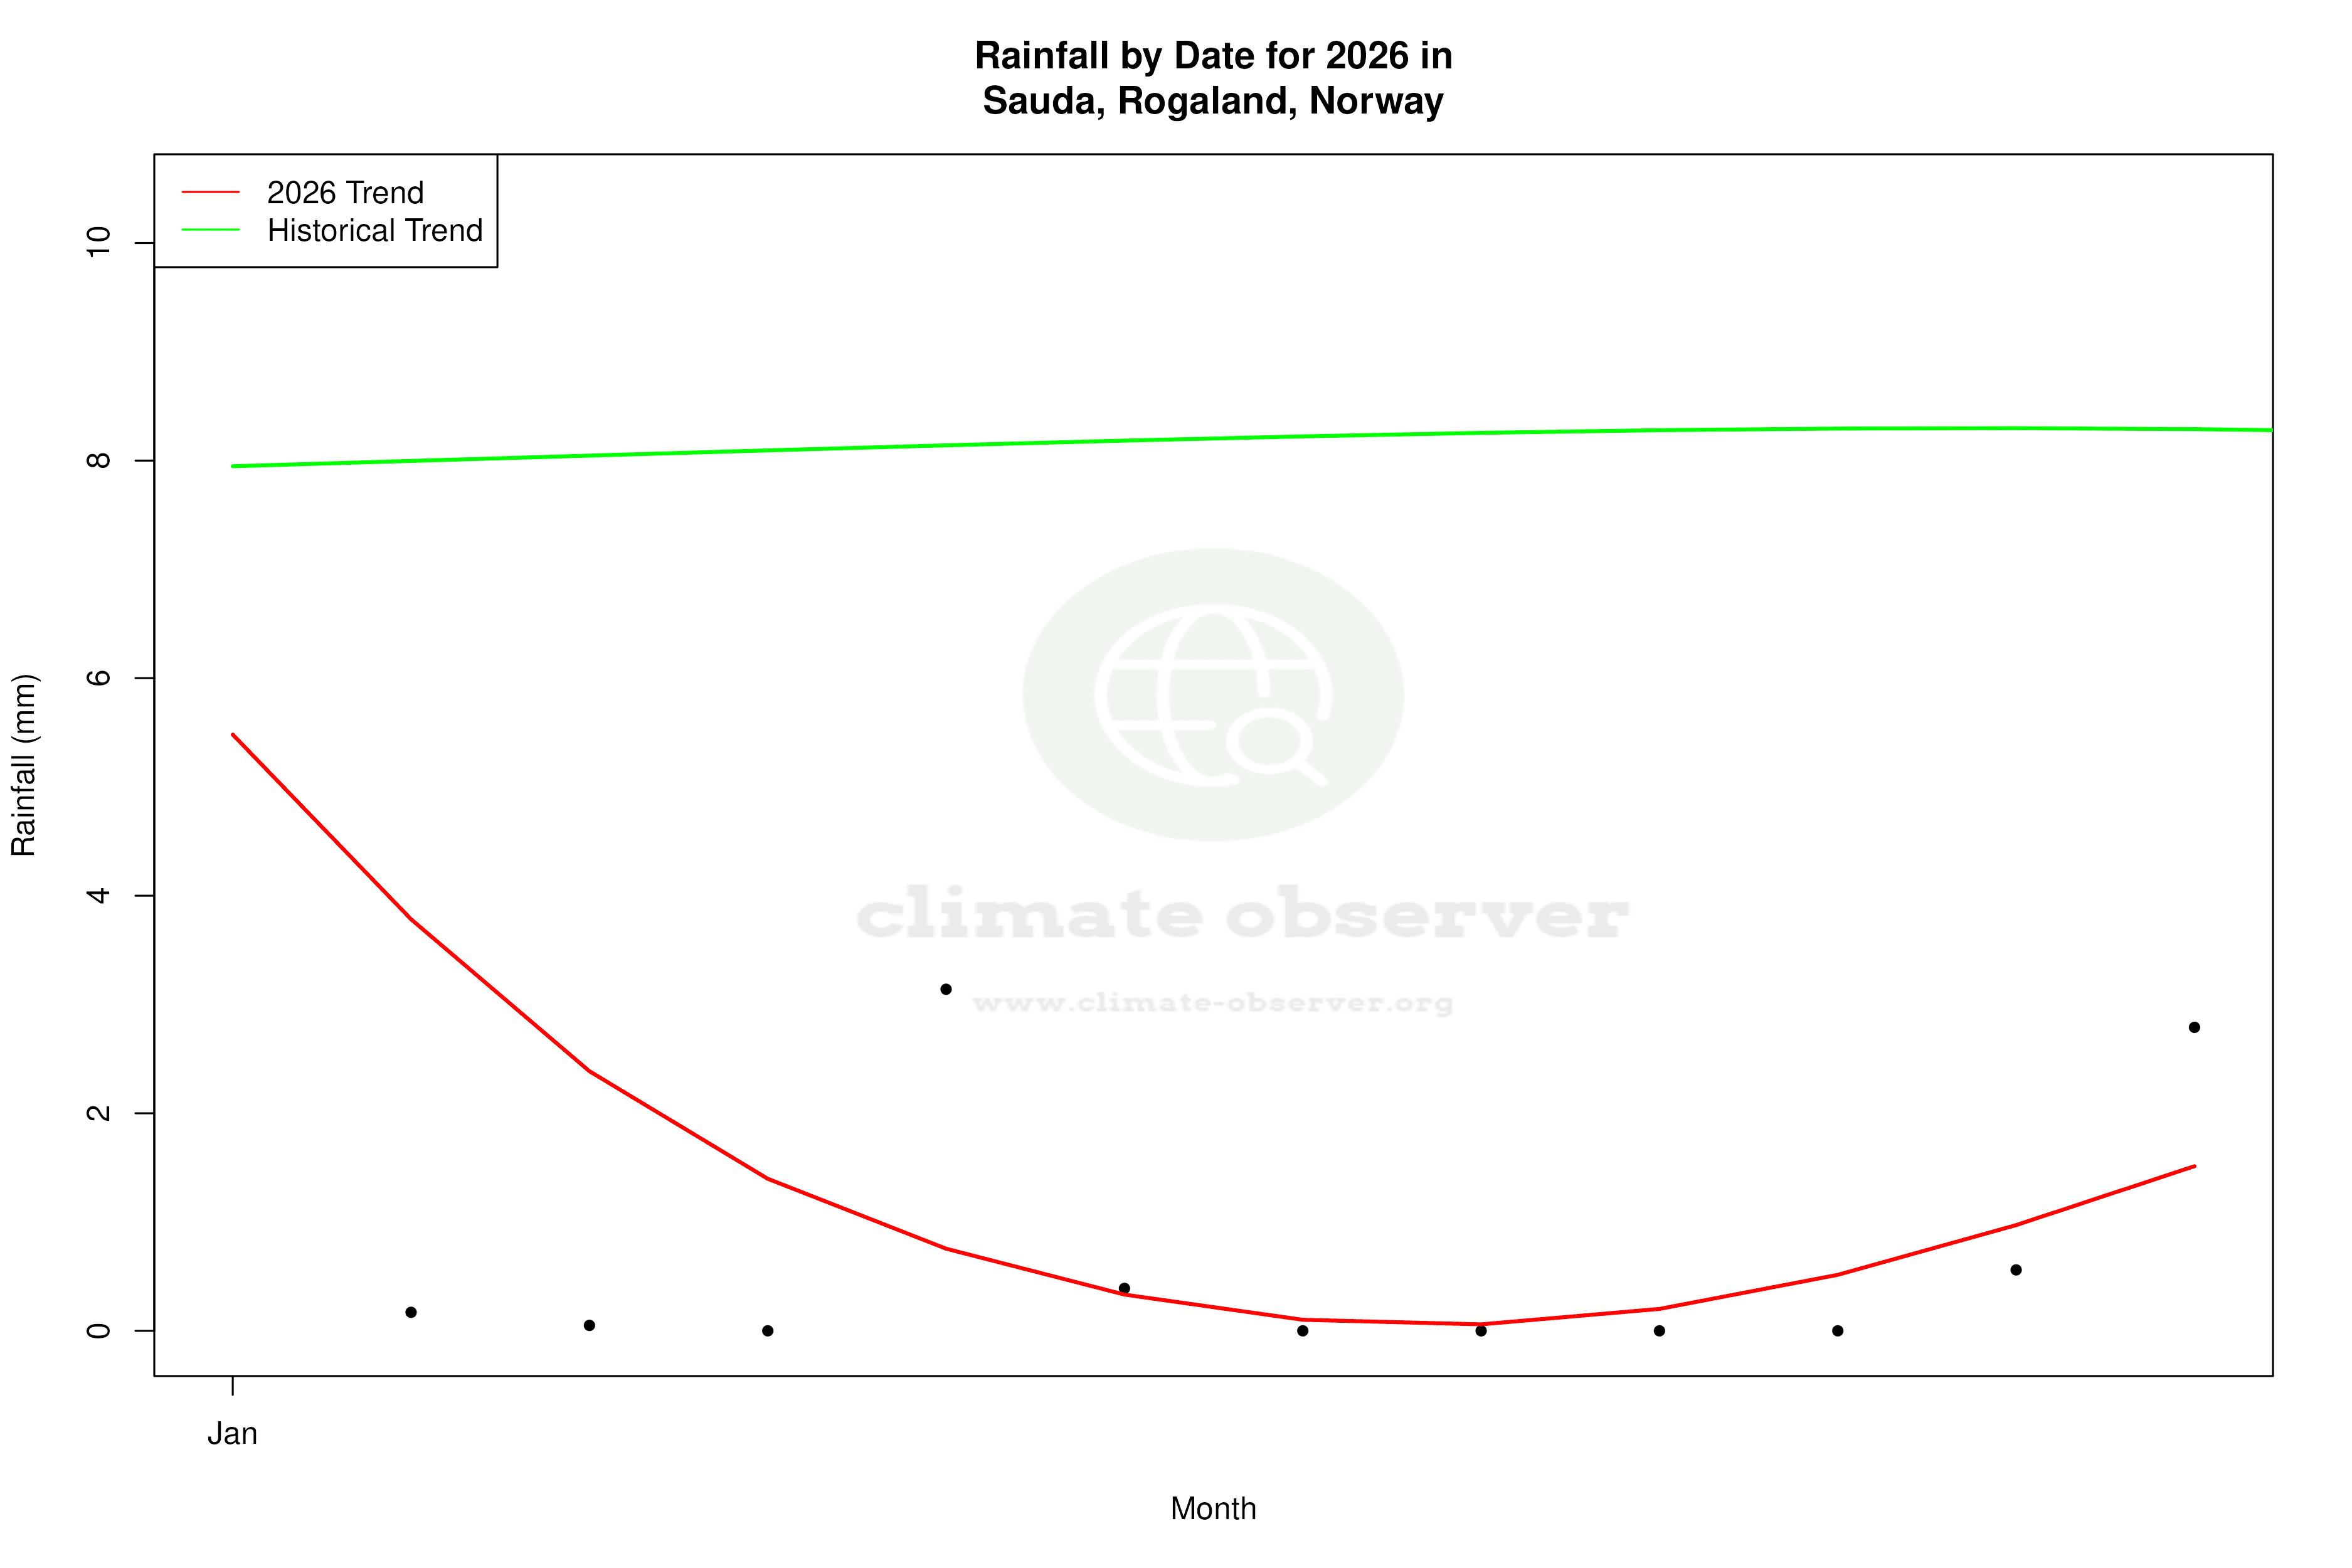
Precipitation Patterns: Toward Even Distribution
The Precipitation Concentration Index (PCI) for Sauda has decreased from a baseline of 11.67 to a current value of 9.81. This indicates a shift towards more evenly distributed precipitation events, reducing the likelihood of extreme rainfall occurrences. Such a change can lead to more stable water resources and less stress on local infrastructure, aligning with Norway's objectives to adapt to changing precipitation patterns.
Temperature Extremes: Record Highs and Lows
Sauda has recorded a maximum temperature of 34.6°C (94.3°F) and a minimum of -24.8°C (-12.6°F). These extremes highlight the region's capacity for significant thermal oscillations, influenced by its continental climate and geographical features. The ability to experience such a wide range of temperatures is indicative of the climatic variability inherent to the area.
Implications for Regional Climate Strategy
The observed trends in Sauda provide insights into the broader climatic shifts occurring in Norway. The cooling trend in recent lows and the more evenly distributed precipitation align with the country's climate adaptation strategies, which focus on reducing the impacts of climate change through sustainable development and environmental conservation. As these patterns continue to evolve, they will play a crucial role in informing future climate policies and initiatives in the region.
Station Statistics
10-Year Trend
High: +0.57 °F/decade
Low: -1.19 °F/decade
Rain: -0.000 in/decade
25-Year Trend
High: +0.76 °F/decade
Low: +0.78 °F/decade
Rain: +0.013 in/decade
50-Year Trend
High: +0.48 °F/decade
Low: +0.89 °F/decade
Rain: +0.008 in/decade
All-Time Trend
High: +0.26 °F/decade
Low: +0.47 °F/decade
Rain: +0.006 in/decade
Percentage Above-Average Days
Last 12 Months: 45.3%
This Year: 6.7%
Precipitation Concentration Index (PCI) ℹ️
Last 12 Months: 10.2
Historical Average: 11.0
Percentile Rank of Last 12 Months ℹ️
High: 89th percentile
Low: 93rd percentile
Rain: 70th percentile
Change in Variance ℹ️
High: -1.7%
Low: -7.1%
Intraday: -10.9%
Data Coverage
85.1%
First Year of Data
1928
Station Location
Historical Weather Records
| Max High | Avg High | Min High | Max Avg | Avg Avg | Min Avg | Max Low | Avg Low | Min Low | Max Precipitation | Avg Precipitation | Max Snow | Avg Snow | |
|---|---|---|---|---|---|---|---|---|---|---|---|---|---|
| Record | 94.28 °F | — | 2.66 °F | 79.52 °F | — | -16.20 °F | 73.40 °F | — | -12.64 °F | 4.88 in | — | — | — |
| January | 57.92 °F | 34.67 °F | 2.66 °F | 46.22 °F | 27.79 °F | -16.20 °F | 44.96 °F | 24.38 °F | -12.64 °F | 3.76 in | 0.31 in | — | — |
| February | 52.52 °F | 36.09 °F | 7.16 °F | 46.76 °F | 27.67 °F | -5.40 °F | 44.24 °F | 24.02 °F | -7.24 °F | 3.39 in | 0.26 in | — | — |
| March | 66.92 °F | 42.02 °F | 23.00 °F | 52.88 °F | 31.87 °F | 7.74 °F | 46.76 °F | 28.74 °F | -4.72 °F | 3.25 in | 0.21 in | — | — |
| April | 72.14 °F | 50.03 °F | 30.45 °F | 58.10 °F | 38.16 °F | 21.25 °F | 54.50 °F | 34.62 °F | 5.72 °F | 3.92 in | 0.16 in | — | — |
| May | 88.34 °F | 59.84 °F | 36.07 °F | 73.40 °F | 45.95 °F | 29.73 °F | 64.58 °F | 41.75 °F | 26.76 °F | 1.74 in | 0.13 in | — | — |
| June | 90.86 °F | 65.67 °F | 46.58 °F | 76.28 °F | 53.08 °F | 36.77 °F | 66.56 °F | 48.29 °F | 32.90 °F | 2.37 in | 0.17 in | — | — |
| July | 94.28 °F | 68.48 °F | 53.06 °F | 79.52 °F | 56.97 °F | 42.75 °F | 73.40 °F | 52.58 °F | 32.72 °F | 3.47 in | 0.17 in | — | — |
| August | 89.60 °F | 67.16 °F | 52.52 °F | 71.06 °F | 55.76 °F | 42.57 °F | 68.36 °F | 51.76 °F | 34.16 °F | 4.14 in | 0.22 in | — | — |
| September | 86.90 °F | 59.89 °F | 42.62 °F | 68.72 °F | 49.84 °F | 34.41 °F | 65.66 °F | 46.59 °F | 27.50 °F | 3.04 in | 0.29 in | — | — |
| October | 73.22 °F | 50.88 °F | 28.76 °F | 63.14 °F | 42.16 °F | 22.10 °F | 62.42 °F | 39.64 °F | 16.16 °F | 3.43 in | 0.33 in | — | — |
| November | 63.32 °F | 42.14 °F | 13.10 °F | 55.58 °F | 34.47 °F | 7.18 °F | 53.78 °F | 32.56 °F | 4.10 °F | 4.88 in | 0.33 in | — | — |
| December | 57.02 °F | 36.93 °F | 6.44 °F | 49.10 °F | 29.52 °F | 1.24 °F | 48.20 °F | 27.45 °F | -0.40 °F | 4.71 in | 0.33 in | — | — |
Data Visualisations
Remove WatermarksCurrent Year Climate Trends vs Historical


Max Temperature this Year | 1 of 6
Climate 12-Month Moving Averages


Max Temperature 12-Month MA | 1 of 6
Daily Data Points and Averages Throughout the Year


Average Max Temperature Throughout Year | 1 of 5
