Climate for Station: Capitan Carlos Martinez De Pi, La Libertad, Peru
Loading live weather...
Climate Analysis & Overview
The climate at Aeropuerto Internacional Capitán FAP Carlos Martínez de Pinillos in Trujillo, Peru, is characterised by a cooling trend over the past decade, contrasting with minor long-term changes. Precipitation patterns have become more evenly distributed, reflecting a shift in local weather dynamics.
Cooling Trends in a Coastal Climate
Located near the Pacific coast, the airport in Trujillo experiences a desert climate, classified as BWh in the Köppen system. This classification is marked by arid conditions with minimal rainfall. The past decade has seen a notable cooling trend, with high temperatures decreasing by 2.21°C (3.98°F) and lows by 0.78°C (1.40°F). This recent cooling is more pronounced than the long-term trends, where highs have fallen by only 0.38°C (0.68°F), while lows have actually risen by 0.30°C (0.54°F). This suggests a complex interplay of local and regional factors influencing the climate.
Temperature Extremes and Variability
The station's recorded temperature extremes provide further insight into its climatic profile. The highest temperature recorded is 36.0°C (96.8°F), while the lowest is 4.0°C (39.2°F). These extremes highlight the variability within the desert climate, influenced by its proximity to the ocean and the Andes mountains. The cooling trend in recent years may be linked to broader regional climatic shifts or localised phenomena such as ocean currents.
Evolving Precipitation Patterns
The Precipitation Concentration Index (PCI) at this location has decreased from a baseline of 18.8 to a current value of 13.6. This indicates that precipitation is now more evenly distributed throughout the year, moving away from the previously concentrated rainfall events. For a region accustomed to arid conditions, this shift could have significant implications for water resource management and agriculture.
Regional Climate Context
Peru's regional climate goals focus on adapting to changing weather patterns and mitigating the impacts of climate variability. The observed cooling trend and more evenly distributed precipitation at Trujillo's airport align with these objectives, offering a localised perspective on broader climatic changes. Recent weather events, such as anomalous cold spells or shifts in rainfall, may also play a role in shaping these trends.
Implications for Local Climate Adaptation
Understanding these climatic changes is crucial for local adaptation strategies. The cooling trends and altered precipitation patterns may affect agriculture, infrastructure, and water management in the region. As Peru continues to address climate challenges, the data from this station provides valuable insights into the localised effects of global climate dynamics.
Station Statistics
10-Year Trend
High: -3.57 °F/decade
Low: -0.84 °F/decade
Rain: -0.002 in/decade
25-Year Trend
High: -1.16 °F/decade
Low: +1.52 °F/decade
Rain: +0.003 in/decade
50-Year Trend
High: -0.74 °F/decade
Low: +0.50 °F/decade
Rain: +0.002 in/decade
All-Time Trend
High: -0.69 °F/decade
Low: +0.55 °F/decade
Rain: +0.002 in/decade
Percentage Above-Average Days
Last 12 Months: 41.6%
This Year: 54.4%
Precipitation Concentration Index (PCI) ℹ️
Last 12 Months: 22.6
Historical Average: 25.7
Percentile Rank of Last 12 Months ℹ️
High: 6th percentile
Low: 61st percentile
Rain: 94th percentile
Change in Variance ℹ️
High: +11.7%
Low: -19.0%
Intraday: -50.2%
Data Coverage
88.8%
First Year of Data
1963
Station Location
Historical Weather Records
| Max High | Avg High | Min High | Max Avg | Avg Avg | Min Avg | Max Low | Avg Low | Min Low | Max Precipitation | Avg Precipitation | Max Snow | Avg Snow | |
|---|---|---|---|---|---|---|---|---|---|---|---|---|---|
| Record | 96.80 °F | — | 58.46 °F | 83.48 °F | — | 54.86 °F | 79.52 °F | — | 39.20 °F | 6.18 in | — | — | — |
| January | 89.60 °F | 77.01 °F | 68.00 °F | 81.86 °F | 70.79 °F | 61.88 °F | 77.90 °F | 64.92 °F | 51.62 °F | 0.92 in | 0.01 in | — | — |
| February | 95.00 °F | 78.80 °F | 69.80 °F | 82.58 °F | 72.87 °F | 65.48 °F | 79.52 °F | 66.85 °F | 49.64 °F | 0.94 in | 0.02 in | — | — |
| March | 96.80 °F | 78.76 °F | 67.64 °F | 83.48 °F | 72.63 °F | 63.68 °F | 78.80 °F | 66.89 °F | 46.40 °F | 0.75 in | 0.02 in | — | — |
| April | 95.00 °F | 75.83 °F | 59.00 °F | 82.94 °F | 69.60 °F | 56.12 °F | 78.80 °F | 64.29 °F | 51.98 °F | 2.66 in | 0.01 in | — | — |
| May | 90.86 °F | 73.57 °F | 58.46 °F | 82.22 °F | 67.48 °F | 54.86 °F | 78.80 °F | 62.51 °F | 48.20 °F | 0.19 in | 0.00 in | — | — |
| June | 86.00 °F | 71.77 °F | 62.60 °F | 80.60 °F | 66.12 °F | 58.82 °F | 77.00 °F | 61.27 °F | 39.20 °F | 6.18 in | 0.01 in | — | — |
| July | 84.74 °F | 70.34 °F | 60.80 °F | 76.28 °F | 64.66 °F | 59.18 °F | 71.60 °F | 59.90 °F | 46.40 °F | 0.56 in | 0.00 in | — | — |
| August | 80.60 °F | 69.09 °F | 60.80 °F | 74.66 °F | 63.71 °F | 58.64 °F | 71.60 °F | 59.30 °F | 46.40 °F | 0.06 in | 0.00 in | — | — |
| September | 81.32 °F | 68.90 °F | 60.98 °F | 73.76 °F | 63.29 °F | 58.28 °F | 69.82 °F | 58.86 °F | 48.20 °F | 0.26 in | 0.00 in | — | — |
| October | 82.40 °F | 69.59 °F | 61.88 °F | 71.78 °F | 63.93 °F | 59.00 °F | 68.00 °F | 59.27 °F | 46.40 °F | 0.43 in | 0.01 in | — | — |
| November | 82.40 °F | 71.56 °F | 64.04 °F | 75.20 °F | 65.61 °F | 60.08 °F | 72.50 °F | 60.41 °F | 47.84 °F | 0.67 in | 0.01 in | — | — |
| December | 85.10 °F | 74.05 °F | 66.20 °F | 79.16 °F | 68.06 °F | 61.16 °F | 77.00 °F | 62.51 °F | 50.00 °F | 0.28 in | 0.01 in | — | — |
Data Visualisations
Remove WatermarksCurrent Year Climate Trends vs Historical
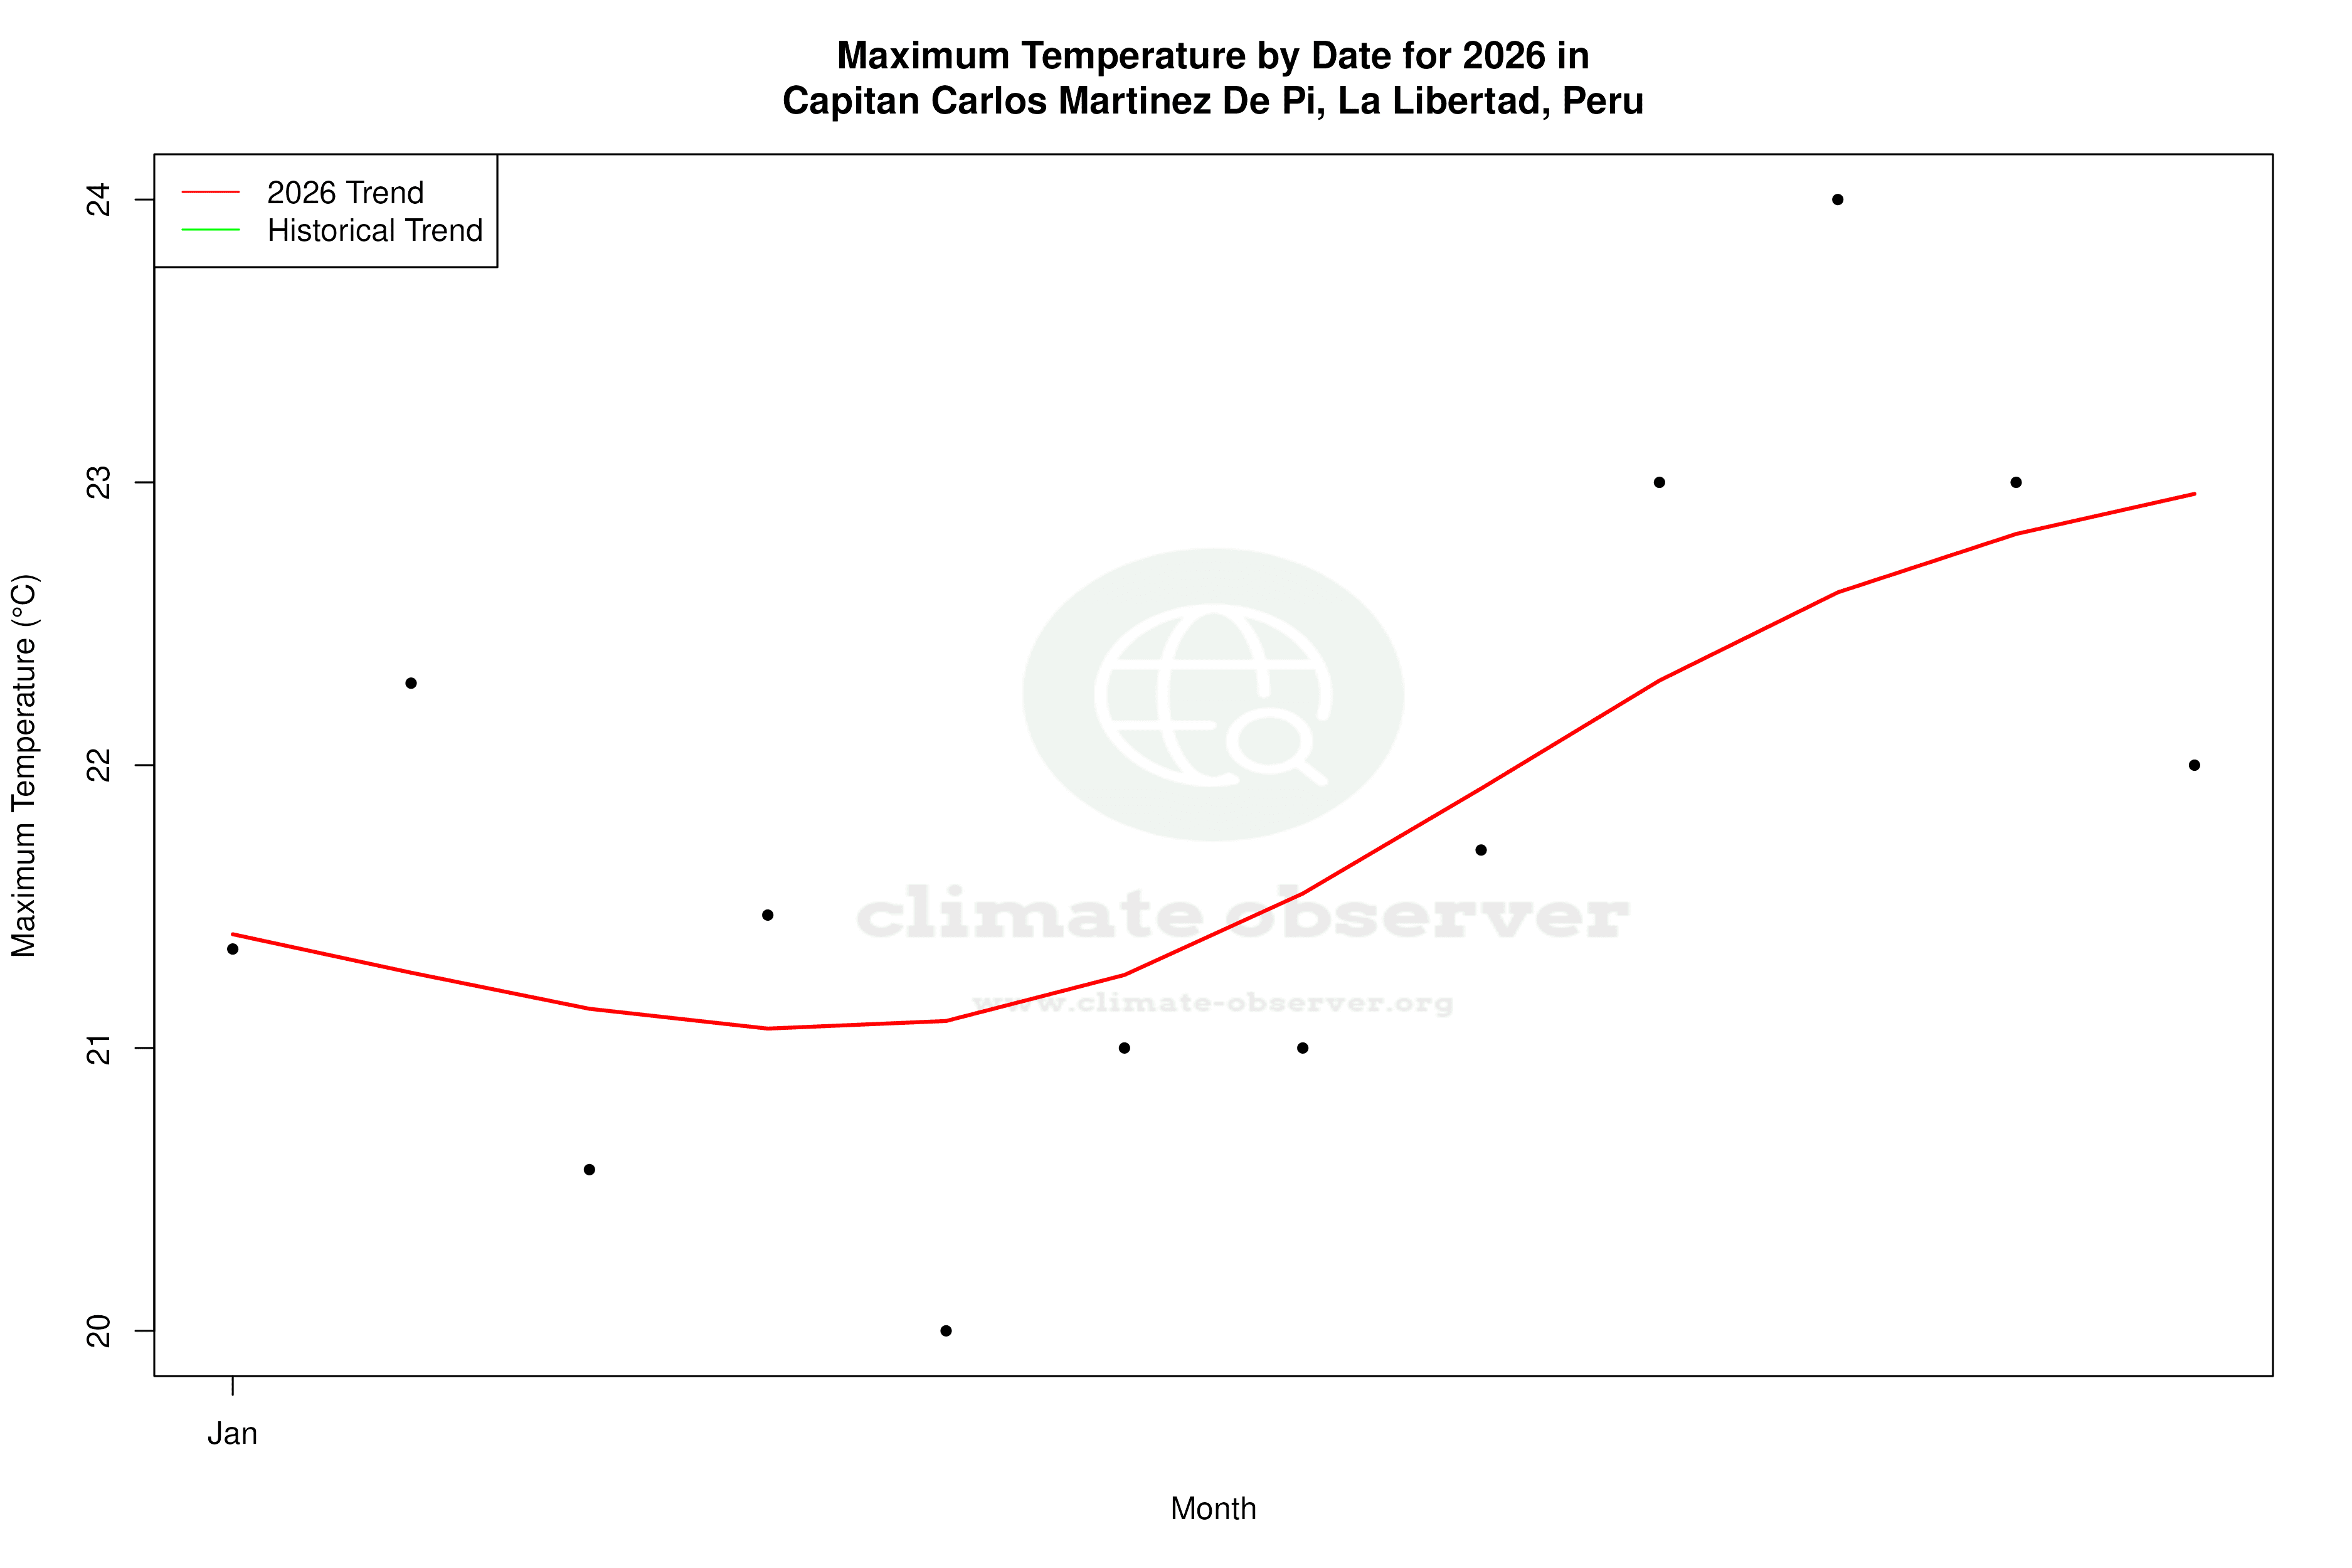


Max Temperature this Year | 1 of 6
Climate 12-Month Moving Averages


Max Temperature 12-Month MA | 1 of 6
Daily Data Points and Averages Throughout the Year


Average Max Temperature Throughout Year | 1 of 5
