Climate for Station: Jorge Chavez Intl, Callao, Peru
Loading live weather...
Climate Analysis & Overview
The Jorge Chavez International Airport, located in the coastal city of Lima, Peru, is experiencing a notable cooling trend over the past decade, with high temperatures dropping by 2.13°C (3.83°F). This contrasts with a more moderate all-time cooling of 0.15°C (0.27°F) for highs, while lows have seen a slight warming of 0.12°C (0.22°F). The Precipitation Concentration Index (PCI) has significantly increased, indicating more concentrated rainfall events.
Coastal Cooling Dynamics
Situated in the arid climate zone of the Peruvian coast, Jorge Chavez International Airport is influenced by the Humboldt Current, which brings cooler air from the Pacific Ocean. This geographical setting aligns with the observed cooling trend in high temperatures over the past decade, showing a decrease of 2.13°C (3.83°F). This recent cooling is more pronounced than the all-time trend, which shows a more modest fall of 0.15°C (0.27°F) in highs. The cooling effect is less evident in low temperatures, which have experienced a slight warming of 0.12°C (0.22°F) over the long term.
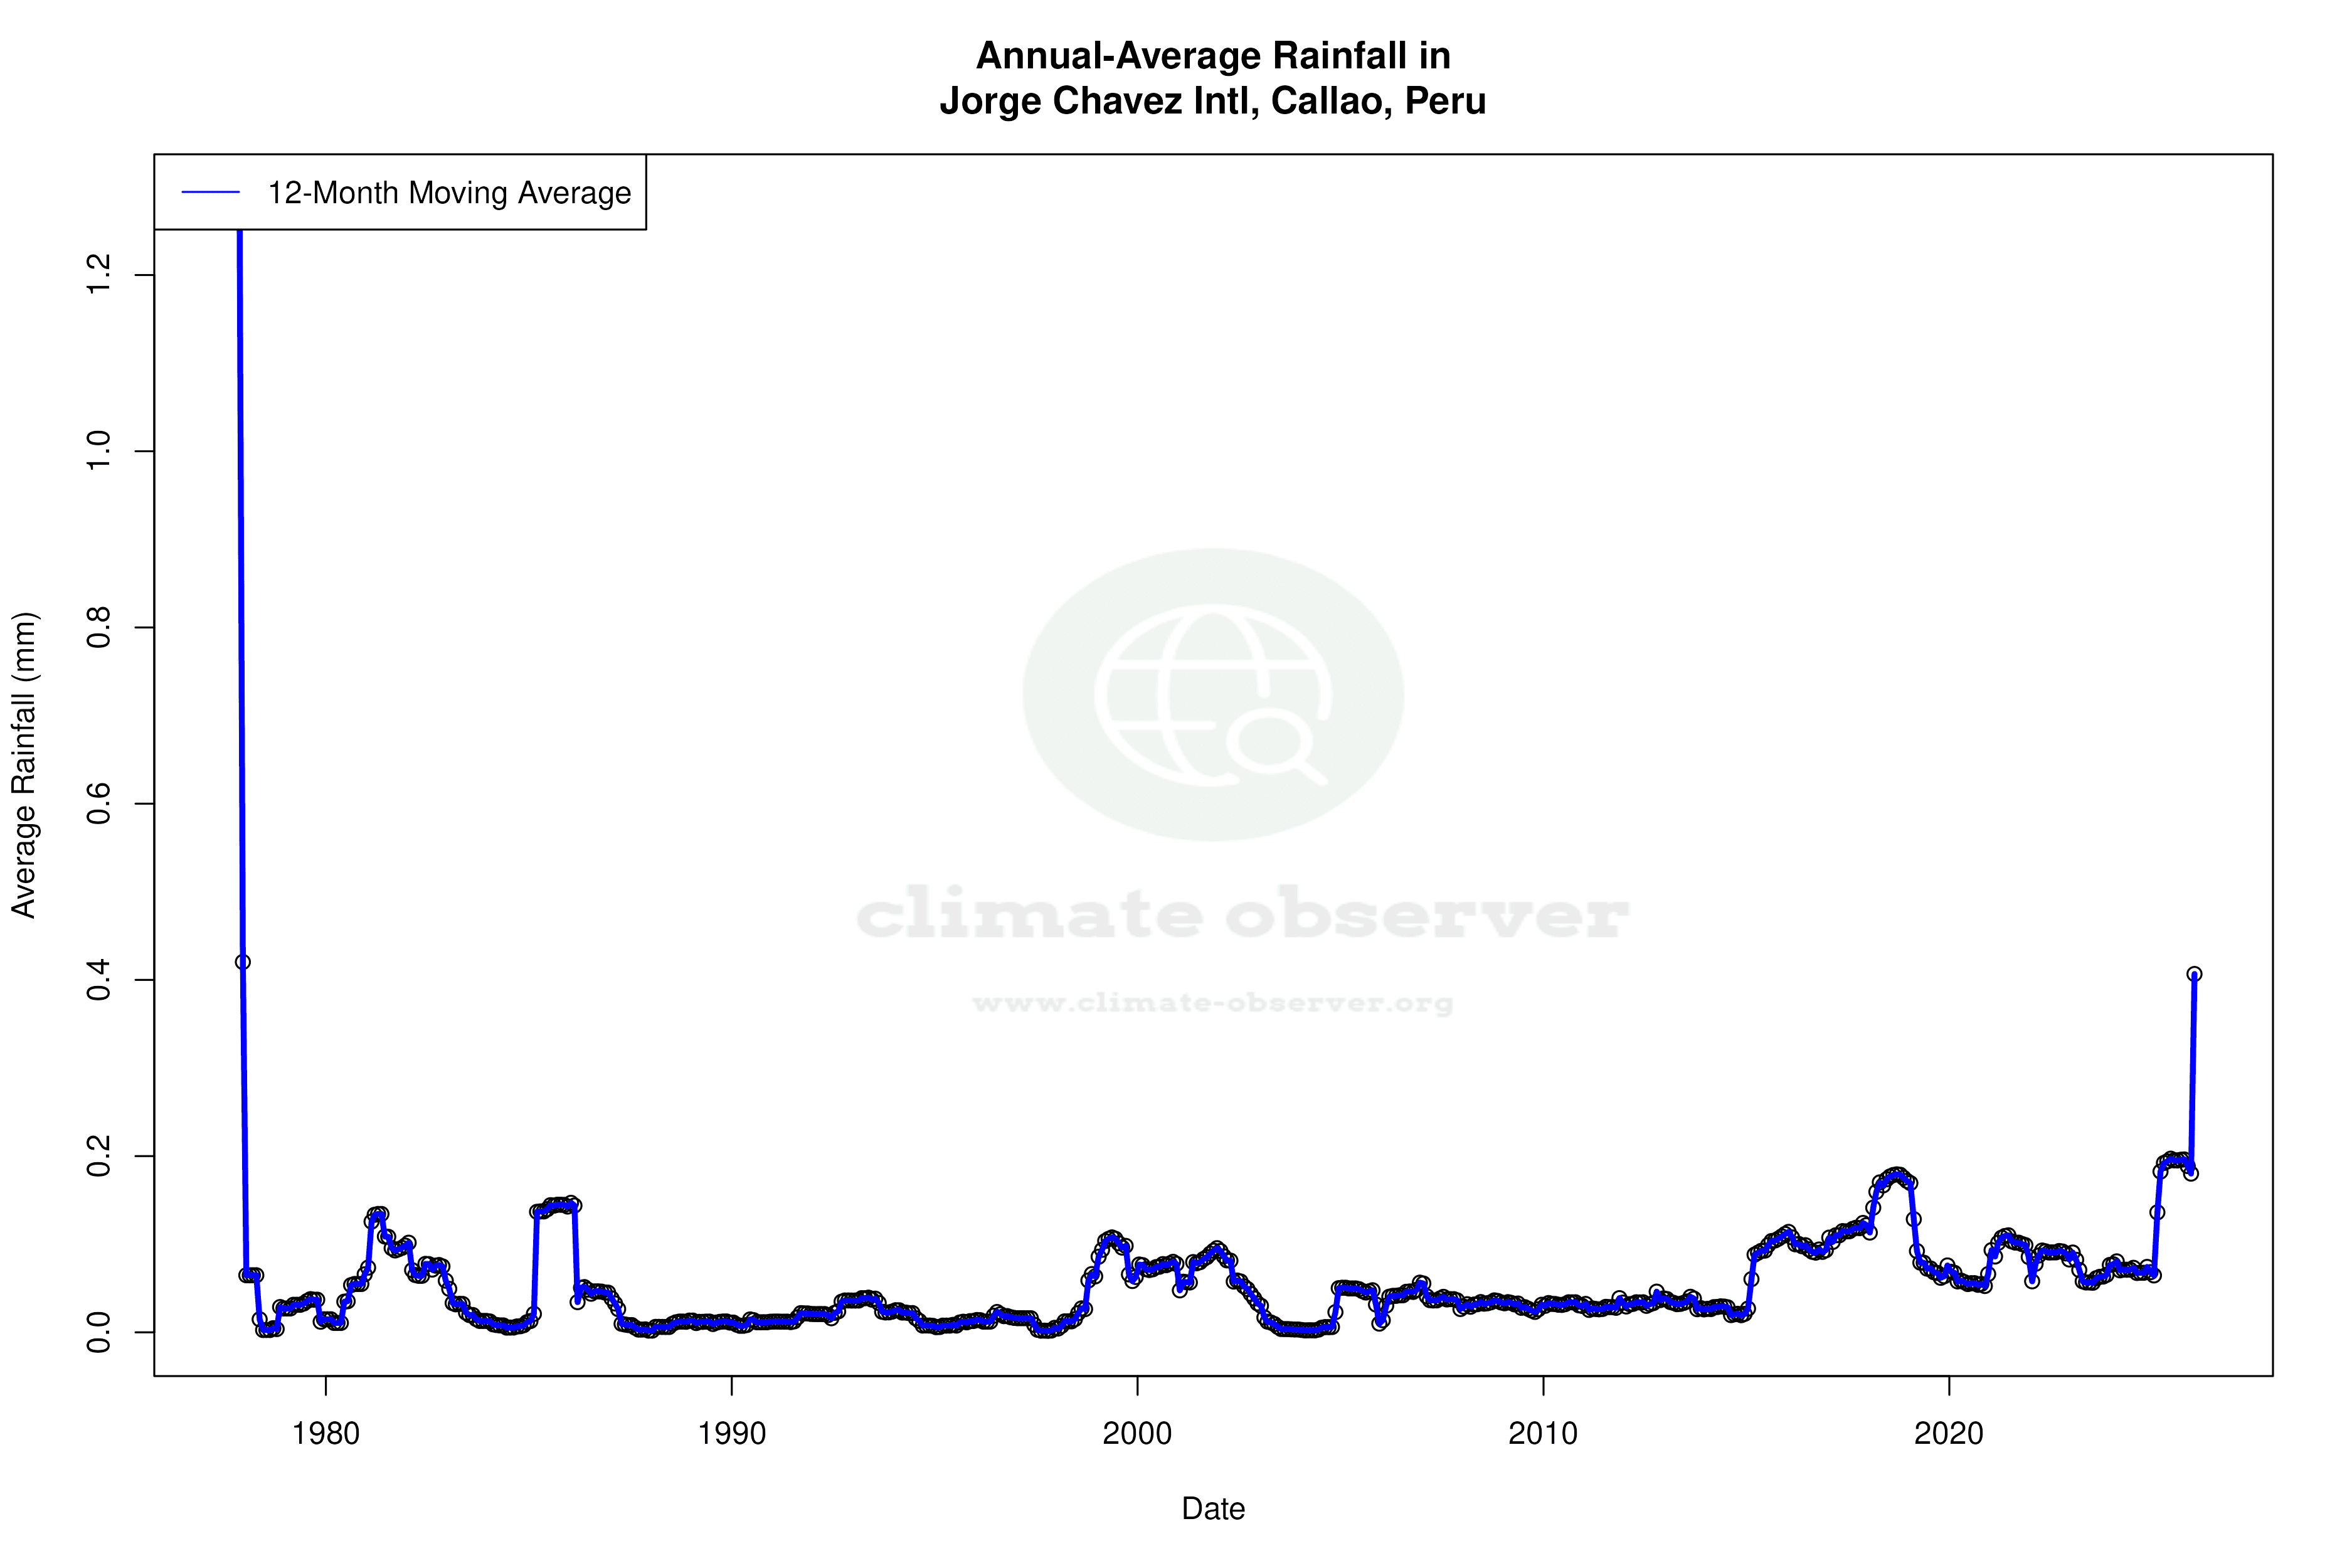
Precipitation Patterns: A Shift Towards Concentration
The Precipitation Concentration Index (PCI) at Jorge Chavez International Airport has risen from a baseline of 19.0 to a current value of 24.1. This significant increase suggests that rainfall is becoming more concentrated in fewer, more intense events. A PCI value above 20 indicates highly concentrated precipitation, which can lead to challenges in water management, especially in regions like Lima where water resources are already scarce.
Temperature Extremes: A Record Perspective
The station has recorded an all-time high of 33.4°C (92.1°F) and a low of 8.9°C (48.0°F). These extremes highlight the variability inherent in the region's climate, despite the overall cooling trend in recent years. The record temperatures are a reminder of the potential for both heatwaves and cooler spells in this coastal environment.
Regional Climate Goals and Implications
Peru has been actively engaging in climate adaptation strategies, recognising the need for sustainable water management and infrastructure resilience. The increasing PCI at Jorge Chavez International Airport underscores the importance of these initiatives, as concentrated rainfall events can exacerbate flooding risks and strain existing water systems. The cooling trend, particularly in high temperatures, may offer some relief from heat stress but also necessitates adjustments in energy consumption patterns and agricultural practices.
Decadal vs. Long-term Trends
The divergence between the decadal and all-time temperature trends at Jorge Chavez International Airport is a critical point of interest. While the last ten years have shown a sharper cooling in high temperatures, the all-time data suggests a more balanced thermal profile, with a slight warming in low temperatures. This discrepancy may reflect broader climatic changes or localised influences, such as urban development or shifts in oceanic currents, that warrant further investigation.
Station Statistics
10-Year Trend
High: -3.40 °F/decade
Low: -0.02 °F/decade
Rain: +0.005 in/decade
25-Year Trend
High: +0.13 °F/decade
Low: +0.88 °F/decade
Rain: +0.002 in/decade
50-Year Trend
High: -0.29 °F/decade
Low: +0.21 °F/decade
Rain: +0.000 in/decade
All-Time Trend
High: -0.29 °F/decade
Low: +0.21 °F/decade
Rain: +0.000 in/decade
Percentage Above-Average Days
Last 12 Months: 42.5%
This Year: 42.5%
Precipitation Concentration Index (PCI) ℹ️
Last 12 Months: 25.9
Historical Average: 24.3
Percentile Rank of Last 12 Months ℹ️
High: 6th percentile
Low: 73rd percentile
Rain: 98th percentile
Change in Variance ℹ️
High: +13.7%
Low: +7.9%
Intraday: -27.4%
Data Coverage
86.5%
First Year of Data
1963
Station Location
Historical Weather Records
| Max High | Avg High | Min High | Max Avg | Avg Avg | Min Avg | Max Low | Avg Low | Min Low | Max Precipitation | Avg Precipitation | Max Snow | Avg Snow | |
|---|---|---|---|---|---|---|---|---|---|---|---|---|---|
| Record | 92.12 °F | — | 60.08 °F | 82.58 °F | — | 56.48 °F | 78.44 °F | — | 48.02 °F | 15.08 in | — | — | — |
| January | 91.40 °F | 78.86 °F | 66.69 °F | 81.50 °F | 72.44 °F | 64.26 °F | 77.00 °F | 67.44 °F | 53.60 °F | 5.04 in | 0.01 in | — | — |
| February | 90.50 °F | 80.73 °F | 69.39 °F | 82.58 °F | 73.66 °F | 64.58 °F | 78.44 °F | 68.60 °F | 58.32 °F | 0.47 in | 0.01 in | — | — |
| March | 92.12 °F | 80.05 °F | 67.53 °F | 81.86 °F | 72.81 °F | 63.50 °F | 77.00 °F | 67.71 °F | 55.04 °F | 0.42 in | 0.01 in | — | — |
| April | 88.88 °F | 76.75 °F | 66.20 °F | 80.78 °F | 69.71 °F | 59.90 °F | 77.00 °F | 64.96 °F | 50.00 °F | 0.20 in | 0.00 in | — | — |
| May | 86.54 °F | 72.56 °F | 62.60 °F | 79.16 °F | 66.27 °F | 58.28 °F | 75.20 °F | 62.18 °F | 50.00 °F | 0.71 in | 0.00 in | — | — |
| June | 86.00 °F | 69.42 °F | 60.80 °F | 78.08 °F | 64.18 °F | 56.48 °F | 75.20 °F | 60.96 °F | 48.20 °F | 0.28 in | 0.00 in | — | — |
| July | 82.94 °F | 67.82 °F | 60.08 °F | 74.66 °F | 62.82 °F | 57.38 °F | 71.24 °F | 59.91 °F | 48.02 °F | 0.07 in | 0.00 in | — | — |
| August | 77.72 °F | 66.99 °F | 60.80 °F | 71.60 °F | 62.01 °F | 57.56 °F | 69.80 °F | 59.18 °F | 50.00 °F | 0.59 in | 0.00 in | — | — |
| September | 79.16 °F | 67.59 °F | 60.80 °F | 71.24 °F | 62.20 °F | 57.56 °F | 68.00 °F | 59.16 °F | 52.11 °F | 0.08 in | 0.00 in | — | — |
| October | 77.36 °F | 69.40 °F | 61.52 °F | 70.52 °F | 63.56 °F | 57.74 °F | 68.00 °F | 60.21 °F | 51.80 °F | 0.18 in | 0.00 in | — | — |
| November | 84.20 °F | 72.02 °F | 64.40 °F | 74.48 °F | 66.03 °F | 59.36 °F | 70.88 °F | 62.23 °F | 51.98 °F | 15.08 in | 0.01 in | — | — |
| December | 86.72 °F | 75.47 °F | 67.87 °F | 78.80 °F | 69.34 °F | 62.31 °F | 74.84 °F | 64.96 °F | 56.48 °F | 10.08 in | 0.01 in | — | — |
Data Visualisations
Remove WatermarksCurrent Year Climate Trends vs Historical


Max Temperature this Year | 1 of 6
Climate 12-Month Moving Averages


Max Temperature 12-Month MA | 1 of 6
Daily Data Points and Averages Throughout the Year


Average Max Temperature Throughout Year | 1 of 5
