Climate for Station: Padre Aldamiz, Madre de Dios, Peru
Loading live weather...
Climate Analysis & Overview
The climate profile of Padre Aldamiz reveals a complex interplay of warming and cooling trends, with recent years showing a stark warming in high temperatures. Precipitation patterns have become more evenly distributed, aligning with Peru's climate goals for sustainable water management.
Tropical Climate Dynamics
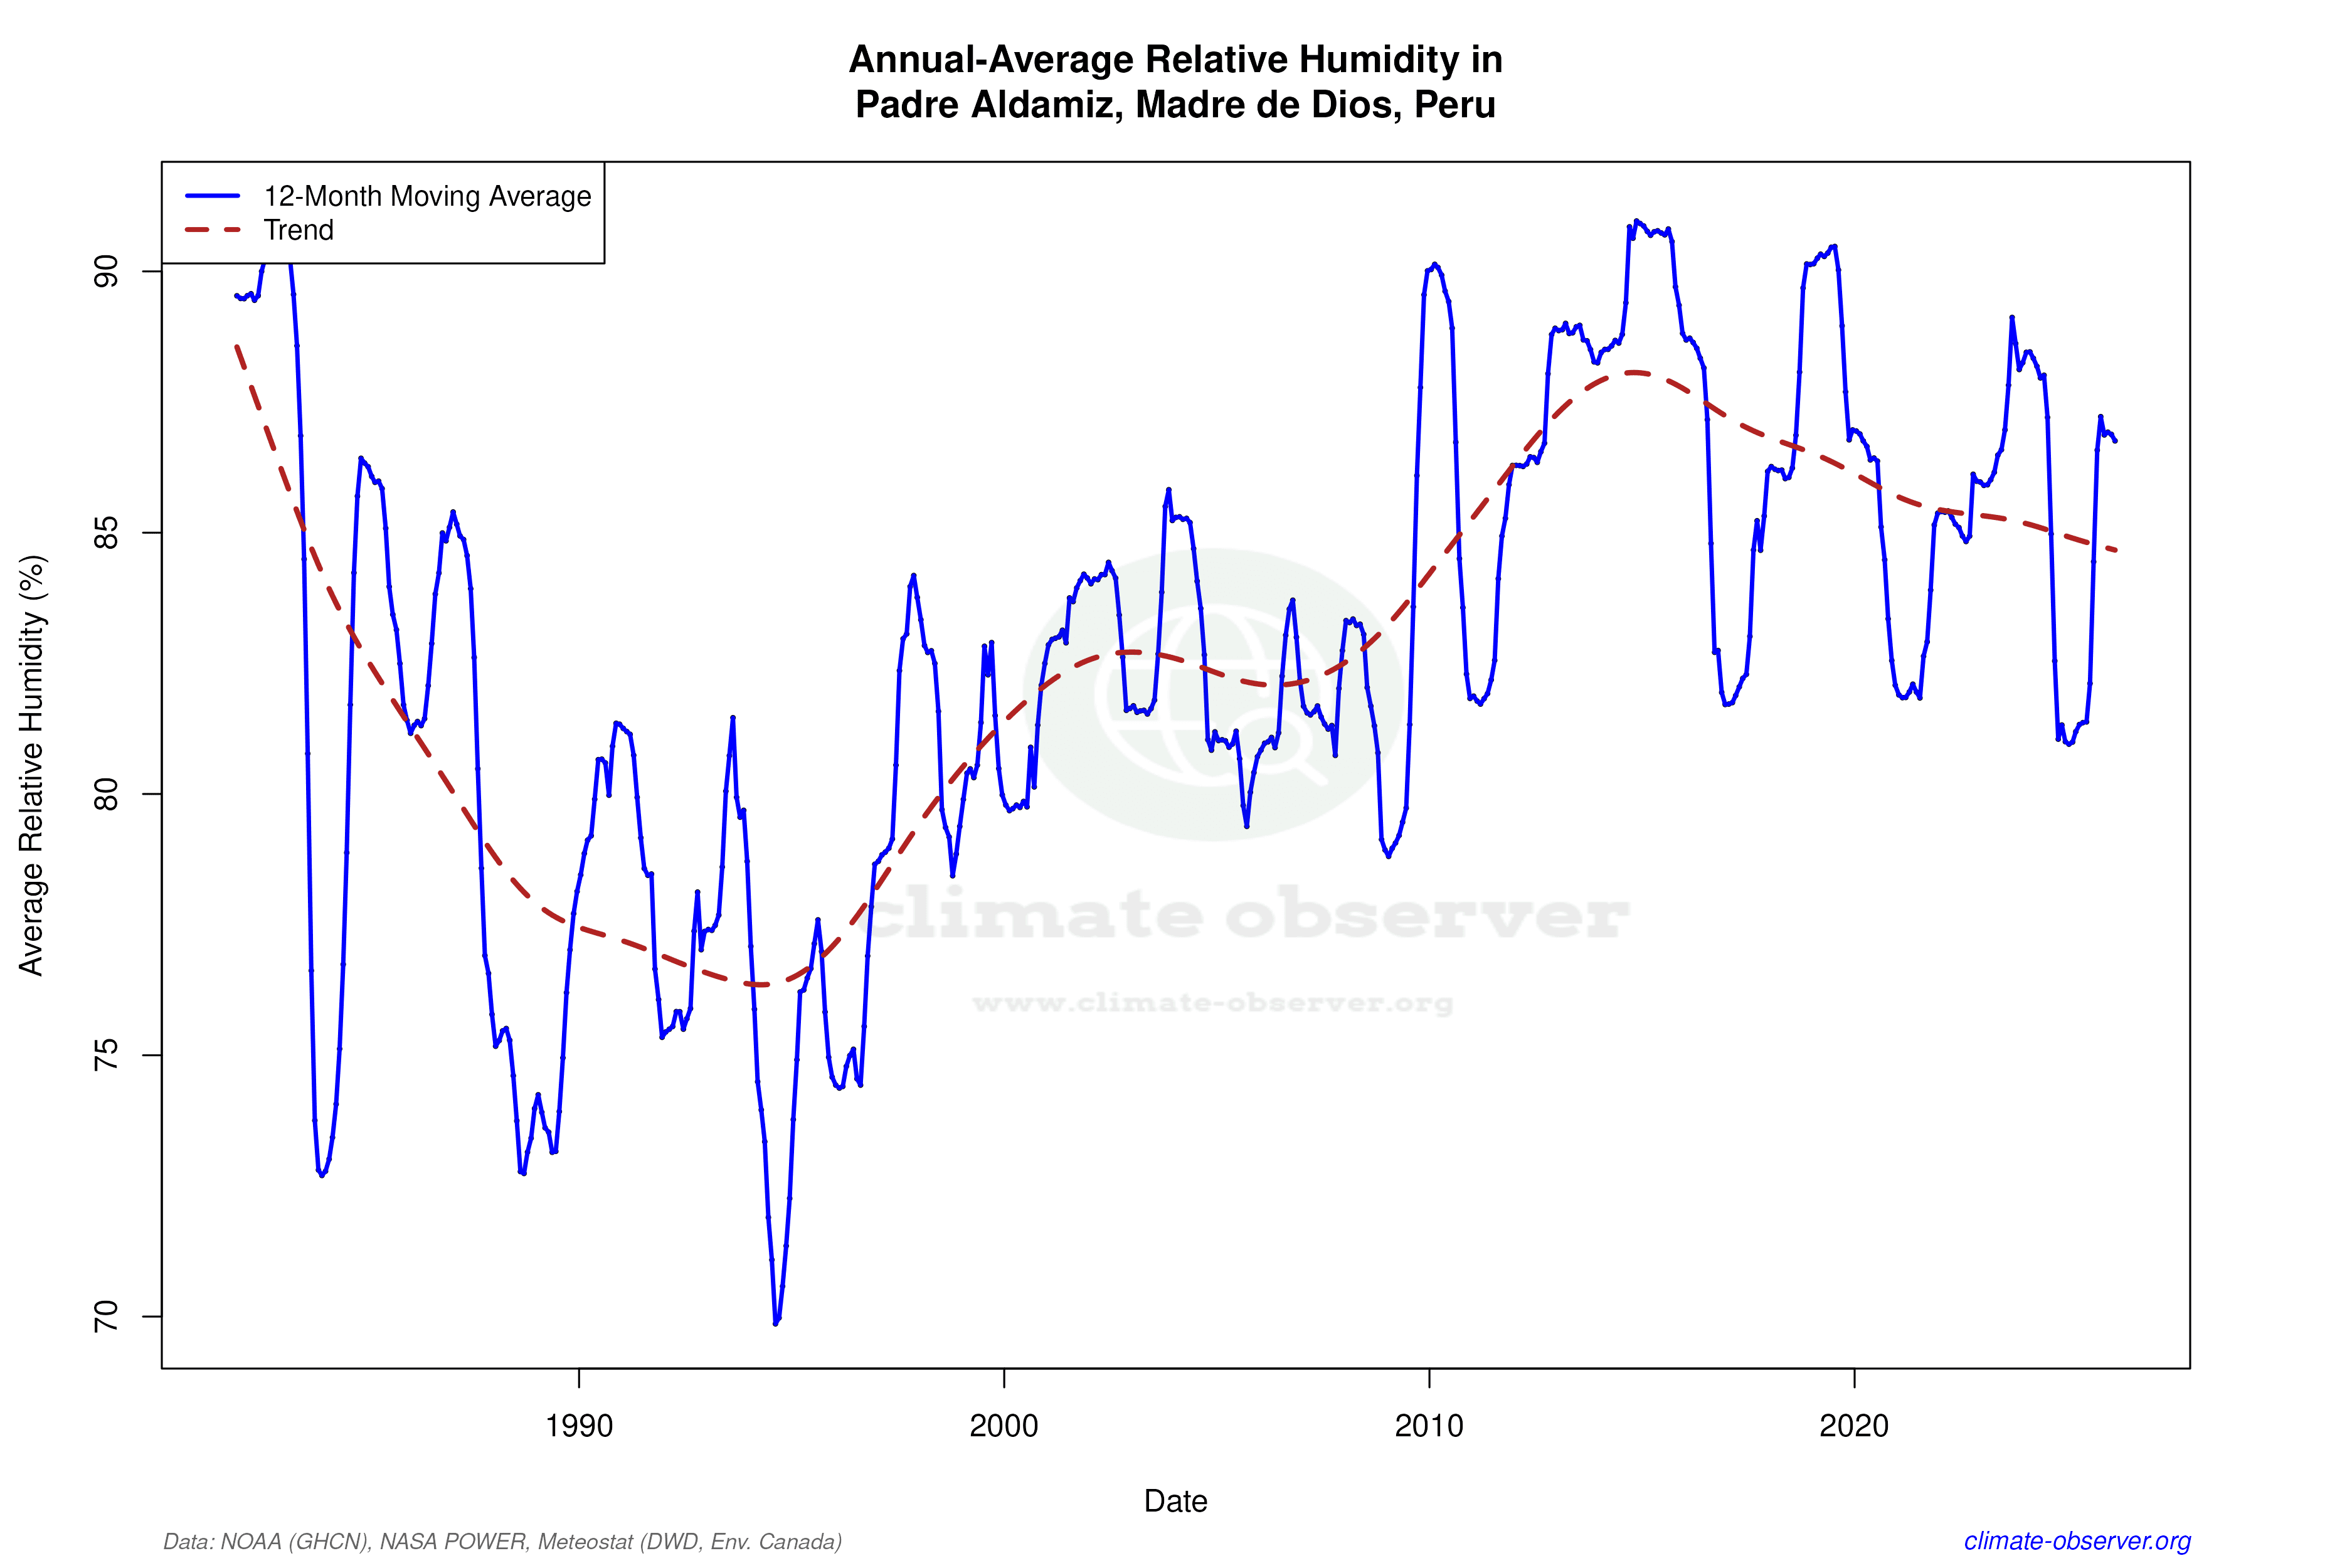
Padre Aldamiz, located in the Madre de Dios region of Peru, is characterised by a tropical rainforest climate (Af) under the Köppen classification. This area is influenced by its proximity to the Amazon Basin, which contributes to high humidity and significant rainfall. The local geography, dominated by dense forests and river systems, plays a crucial role in moderating temperature extremes and distributing precipitation.
Temperature Trends: A Dual Narrative
The temperature trends at Padre Aldamiz present a complex picture. Over the past decade, there has been a notable warming in high temperatures, with an increase of 2.63°C (4.73°F). This recent warming trend contrasts with the all-time data, which shows a slight cooling in high temperatures by 0.34°C (0.61°F). Meanwhile, low temperatures have remained relatively stable over the past decade, with a minimal rise of 0.00°C (0.01°F), and show a more pronounced warming trend of 0.31°C (0.55°F) over the all-time data. These trends highlight the variability and complexity of local climate dynamics.
Precipitation Patterns: A Shift Towards Evenness
The Precipitation Concentration Index (PCI) at Padre Aldamiz has decreased from a baseline of 14.19 to a current value of 11.70. This indicates a shift towards more evenly distributed rainfall events. Such a change suggests a reduction in extreme precipitation events, which is beneficial for managing water resources and reducing flood risks. This aligns with Peru's regional climate goals, which emphasise sustainable water management and resilience against climate variability.
Temperature Extremes: Record Highs and Lows
The station has recorded an absolute maximum temperature of 41.03°C (105.85°F) and a minimum of 0.90°C (33.62°F). These extremes underscore the range of temperatures that can occur in this tropical region, influenced by both local weather patterns and broader climatic shifts.
Regional Implications and Climate Goals
The observed trends at Padre Aldamiz are significant in the context of Peru's broader climate objectives. The recent warming trend in high temperatures and the more even distribution of precipitation are critical factors in planning for climate adaptation and mitigation strategies. These changes necessitate ongoing monitoring and research to ensure that local communities can adapt to evolving climate conditions effectively.
Station Statistics
10-Year Trend
High: +4.26 °F/decade
Low: +0.02 °F/decade
Rain: -0.006 in/decade
25-Year Trend
High: +0.94 °F/decade
Low: +0.13 °F/decade
Rain: +0.012 in/decade
50-Year Trend
High: -0.60 °F/decade
Low: +0.54 °F/decade
Rain: +0.007 in/decade
All-Time Trend
High: -0.60 °F/decade
Low: +0.54 °F/decade
Rain: +0.007 in/decade
Percentage Above-Average Days
Last 12 Months: 42.5%
This Year: 27.2%
Precipitation Concentration Index (PCI) ℹ️
Last 12 Months: 12.6
Historical Average: 13.2
Percentile Rank of Last 12 Months ℹ️
High: 54th percentile
Low: 58th percentile
Rain: 68th percentile
Change in Variance ℹ️
High: +20.1%
Low: -4.0%
Intraday: -5.8%
Data Coverage
85.6%
First Year of Data
1963
Station Location
Historical Weather Records
| Max High | Avg High | Min High | Max Avg | Avg Avg | Min Avg | Max Low | Avg Low | Min Low | Max Precipitation | Avg Precipitation | Max Snow | Avg Snow | |
|---|---|---|---|---|---|---|---|---|---|---|---|---|---|
| Record | 105.85 °F | — | 60.26 °F | 95.72 °F | — | 52.70 °F | 82.62 °F | — | 33.62 °F | 13.11 in | — | — | — |
| January | 102.20 °F | 85.53 °F | 74.66 °F | 90.68 °F | 79.91 °F | 68.36 °F | 77.54 °F | 71.71 °F | 59.00 °F | 12.44 in | 0.46 in | — | — |
| February | 96.80 °F | 84.97 °F | 73.71 °F | 90.14 °F | 79.47 °F | 66.20 °F | 77.00 °F | 71.60 °F | 60.80 °F | 8.66 in | 0.47 in | — | — |
| March | 98.60 °F | 85.20 °F | 72.68 °F | 91.76 °F | 79.87 °F | 66.20 °F | 77.36 °F | 71.37 °F | 59.86 °F | 13.11 in | 0.34 in | — | — |
| April | 97.34 °F | 85.12 °F | 69.94 °F | 88.88 °F | 79.43 °F | 63.37 °F | 77.18 °F | 70.07 °F | 54.68 °F | 9.84 in | 0.25 in | — | — |
| May | 102.20 °F | 83.83 °F | 64.40 °F | 88.34 °F | 77.27 °F | 57.56 °F | 76.10 °F | 67.48 °F | 44.96 °F | 3.43 in | 0.13 in | — | — |
| June | 100.76 °F | 83.49 °F | 60.26 °F | 87.62 °F | 75.98 °F | 53.78 °F | 74.66 °F | 65.53 °F | 44.60 °F | 2.48 in | 0.08 in | — | — |
| July | 96.80 °F | 85.09 °F | 63.48 °F | 88.16 °F | 76.17 °F | 52.70 °F | 74.61 °F | 64.10 °F | 33.62 °F | 3.35 in | 0.06 in | — | — |
| August | 101.88 °F | 89.32 °F | 64.85 °F | 92.48 °F | 78.89 °F | 56.30 °F | 81.05 °F | 65.84 °F | 44.60 °F | 2.48 in | 0.07 in | — | — |
| September | 105.85 °F | 92.12 °F | 70.36 °F | 93.74 °F | 80.73 °F | 57.56 °F | 82.62 °F | 68.72 °F | 49.10 °F | 4.33 in | 0.12 in | — | — |
| October | 104.68 °F | 91.41 °F | 71.60 °F | 95.72 °F | 81.60 °F | 63.86 °F | 81.05 °F | 71.15 °F | 53.78 °F | 7.48 in | 0.24 in | — | — |
| November | 104.45 °F | 88.59 °F | 69.49 °F | 94.46 °F | 80.72 °F | 63.39 °F | 79.30 °F | 71.43 °F | 57.20 °F | 4.37 in | 0.31 in | — | — |
| December | 104.00 °F | 86.55 °F | 73.40 °F | 90.86 °F | 80.21 °F | 64.22 °F | 77.90 °F | 71.87 °F | 57.20 °F | 5.03 in | 0.40 in | — | — |
Data Visualisations
Remove WatermarksCurrent Year Climate Trends vs Historical


Max Temperature this Year | 1 of 6
Climate 12-Month Moving Averages


Max Temperature 12-Month MA | 1 of 6
Daily Data Points and Averages Throughout the Year


Average Max Temperature Throughout Year | 1 of 5
