Climate for Station: Juliaca, Puno, Peru
Loading live weather...
Climate Analysis & Overview
Juliaca, situated in Peru's high-altitude Puno region, is experiencing a complex climate narrative. While long-term trends indicate a slight warming, recent data reveals contrasting short-term cooling. Precipitation is becoming more evenly distributed, a shift that may influence local water resources.
High-Altitude Climate Dynamics
Juliaca is located at a high elevation in the Andes, contributing to its unique climate characteristics. Classified under the Köppen system as a cold semi-arid climate (BSk), the city's weather is influenced by its altitude and proximity to Lake Titicaca. This geographical setting results in significant diurnal temperature variation. The all-time temperature trends show a 0.15°C (0.27°F) rise in high temperatures, indicating a slight warming over the decades. In contrast, the past decade has seen a cooling trend with highs decreasing by 1.79°C (3.22°F), showcasing the variability in short-term climate patterns.
Night-time Warming Phenomenon
Interestingly, Juliaca's low temperatures have been increasing over both the long and short terms. The all-time trend shows a 0.13°C (0.23°F) rise, while the past decade has seen a more pronounced increase of 2.07°C (3.73°F). This night-time warming could be attributed to various factors, including urbanisation and changes in atmospheric circulation patterns. The warming lows might affect local agriculture, which relies on predictable frost patterns.
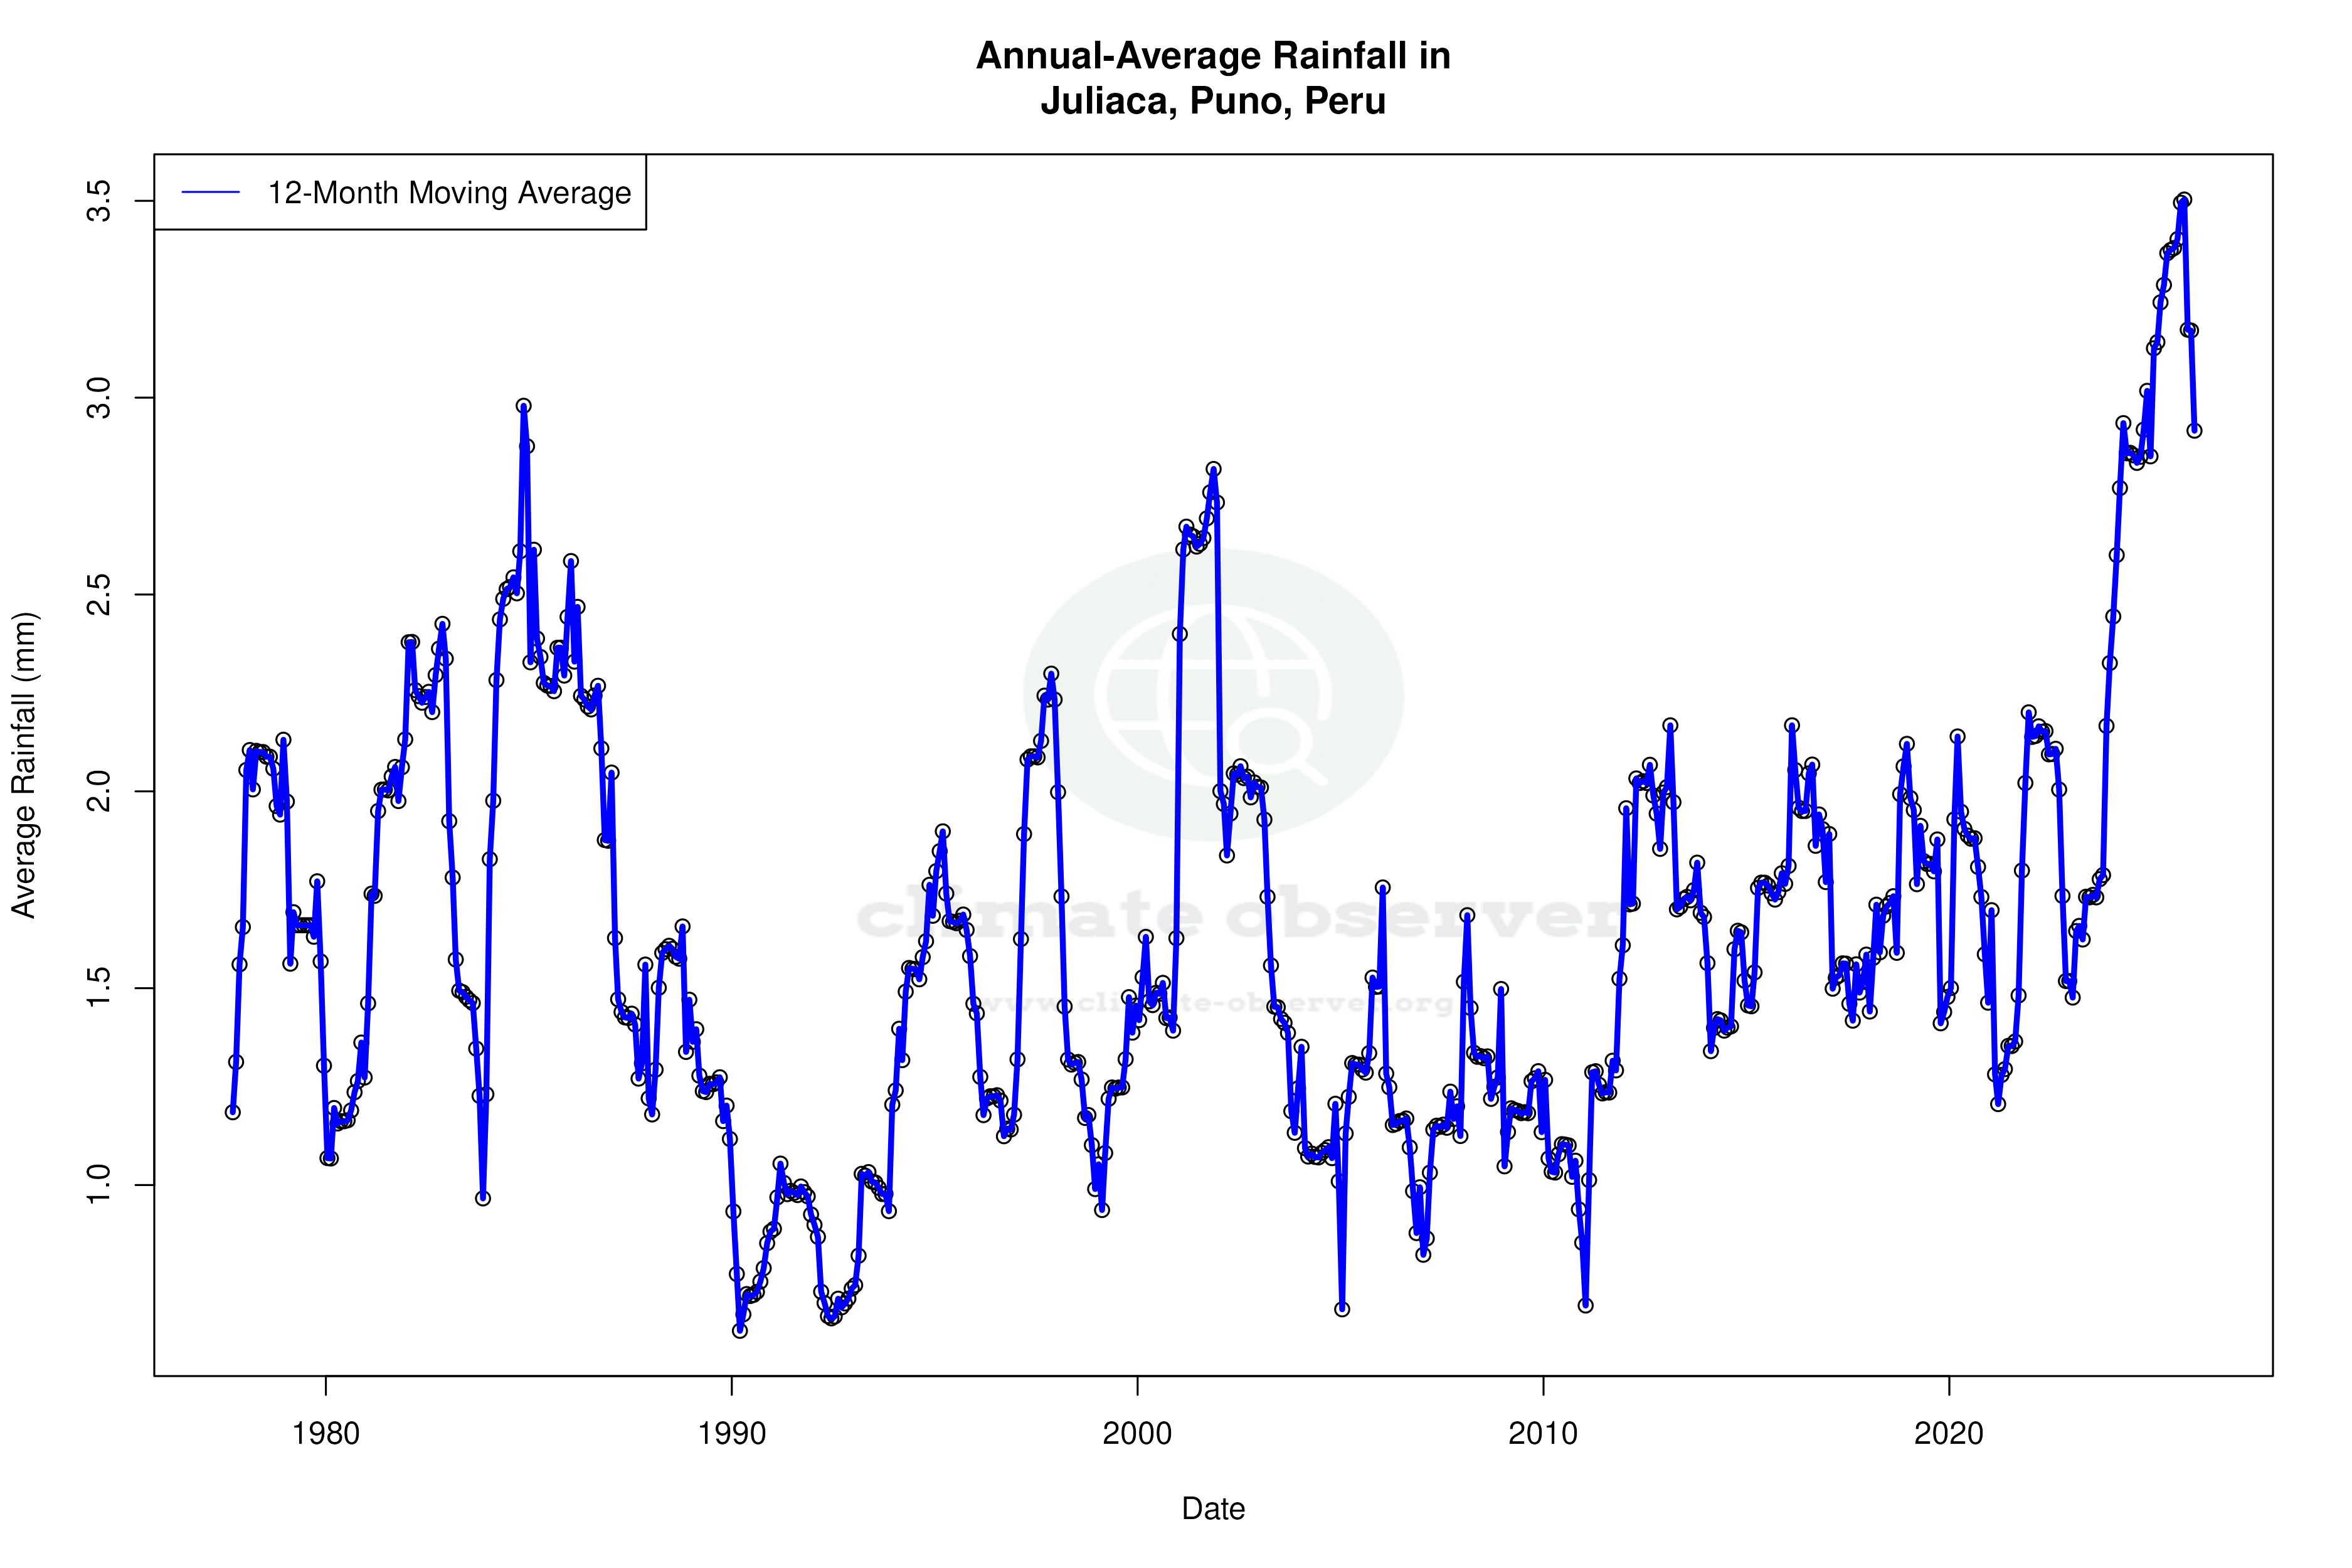
Precipitation Patterns and Distribution
The Precipitation Concentration Index (PCI) for Juliaca has decreased from a baseline of 19.4 to a current value of 15.1. This shift suggests that precipitation is becoming more evenly distributed throughout the year, rather than being concentrated in a few heavy rain events. Such a change can have significant implications for water management and agriculture, potentially reducing the risk of both droughts and floods. While the PCI is still above 10, indicating some concentration, the trend towards more even distribution is notable.
Temperature Extremes and Records
Juliaca's temperature records reflect its extreme climate variability. The highest recorded temperature is 30.4°C (86.7°F), while the lowest plummets to -12.4°C (9.7°F). These extremes highlight the challenges faced by local communities in adapting to such a broad range of temperatures. The ability to manage these extremes is crucial, particularly in the context of Peru's regional climate goals, which focus on resilience and adaptation.
Implications for Regional Climate Goals
Peru has set ambitious climate goals, including enhancing resilience to climate impacts. Juliaca's climate data provides valuable insights into the challenges and opportunities for achieving these objectives. The observed trends, particularly the recent cooling in daytime highs and the more evenly distributed precipitation, offer both challenges and opportunities for local adaptation strategies. Understanding these dynamics is essential for informed decision-making and sustainable development in the region.
Station Statistics
10-Year Trend
High: -2.81 °F/decade
Low: +4.26 °F/decade
Rain: +0.056 in/decade
25-Year Trend
High: -0.53 °F/decade
Low: +0.79 °F/decade
Rain: +0.017 in/decade
50-Year Trend
High: +0.25 °F/decade
Low: +0.29 °F/decade
Rain: +0.003 in/decade
All-Time Trend
High: +0.25 °F/decade
Low: +0.29 °F/decade
Rain: +0.003 in/decade
Percentage Above-Average Days
Last 12 Months: 29.9%
This Year: 13.0%
Precipitation Concentration Index (PCI) ℹ️
Last 12 Months: 14.8
Historical Average: 17.6
Percentile Rank of Last 12 Months ℹ️
High: 17th percentile
Low: 98th percentile
Rain: 97th percentile
Change in Variance ℹ️
High: -11.0%
Low: +13.2%
Intraday: +21.0%
Data Coverage
84.3%
First Year of Data
1963
Station Location
Historical Weather Records
| Max High | Avg High | Min High | Max Avg | Avg Avg | Min Avg | Max Low | Avg Low | Min Low | Max Precipitation | Avg Precipitation | Max Snow | Avg Snow | |
|---|---|---|---|---|---|---|---|---|---|---|---|---|---|
| Record | 86.72 °F | — | 43.63 °F | 67.46 °F | — | 33.26 °F | 49.64 °F | — | 9.68 °F | 5.65 in | — | — | — |
| January | 86.72 °F | 63.42 °F | 51.01 °F | 63.68 °F | 52.78 °F | 42.98 °F | 48.92 °F | 40.15 °F | 23.36 °F | 2.95 in | 0.16 in | — | — |
| February | 78.80 °F | 63.21 °F | 50.83 °F | 63.14 °F | 52.65 °F | 43.16 °F | 49.64 °F | 39.96 °F | 26.60 °F | 3.54 in | 0.15 in | — | — |
| March | 74.84 °F | 62.82 °F | 47.34 °F | 61.52 °F | 52.41 °F | 41.56 °F | 48.38 °F | 39.39 °F | 23.00 °F | 2.36 in | 0.12 in | — | — |
| April | 80.60 °F | 63.41 °F | 49.51 °F | 62.24 °F | 51.99 °F | 40.46 °F | 47.62 °F | 35.65 °F | 19.04 °F | 2.17 in | 0.06 in | — | — |
| May | 73.40 °F | 62.92 °F | 43.65 °F | 61.52 °F | 50.14 °F | 37.22 °F | 44.01 °F | 30.40 °F | 9.68 °F | 0.73 in | 0.01 in | — | — |
| June | 71.24 °F | 61.52 °F | 45.84 °F | 58.82 °F | 47.78 °F | 35.06 °F | 41.43 °F | 27.09 °F | 10.40 °F | 0.35 in | 0.00 in | — | — |
| July | 71.60 °F | 61.48 °F | 43.63 °F | 58.64 °F | 47.54 °F | 33.26 °F | 40.60 °F | 26.62 °F | 10.04 °F | 1.48 in | 0.00 in | — | — |
| August | 71.78 °F | 62.93 °F | 44.83 °F | 62.96 °F | 49.63 °F | 33.80 °F | 42.80 °F | 28.97 °F | 10.40 °F | 0.67 in | 0.01 in | — | — |
| September | 75.20 °F | 64.31 °F | 46.96 °F | 65.12 °F | 52.05 °F | 41.00 °F | 46.94 °F | 32.73 °F | 15.80 °F | 2.60 in | 0.03 in | — | — |
| October | 75.20 °F | 65.49 °F | 46.87 °F | 67.46 °F | 53.99 °F | 38.66 °F | 47.30 °F | 36.17 °F | 21.92 °F | 5.65 in | 0.06 in | — | — |
| November | 77.90 °F | 66.43 °F | 50.74 °F | 66.92 °F | 55.11 °F | 43.34 °F | 48.16 °F | 38.02 °F | 21.20 °F | 1.50 in | 0.07 in | — | — |
| December | 80.96 °F | 65.16 °F | 46.44 °F | 64.94 °F | 54.05 °F | 42.08 °F | 48.74 °F | 39.38 °F | 17.24 °F | 2.87 in | 0.11 in | — | — |
Data Visualisations
Remove WatermarksCurrent Year Climate Trends vs Historical


Max Temperature this Year | 1 of 6
Climate 12-Month Moving Averages


Max Temperature 12-Month MA | 1 of 6
Daily Data Points and Averages Throughout the Year


Average Max Temperature Throughout Year | 1 of 5
