Climate for Station: Coronel Carlos Ciriani Santa, Tacna, Peru
Loading live weather...
Climate Analysis & Overview
The climate profile of Coronel Carlos Ciriani Santa, located in Tacna, Peru, reveals a nuanced thermal and precipitation pattern. Over the past decade, the region has experienced a notable cooling trend in high temperatures, while the concentration of precipitation events has significantly increased, indicating more intense rainfall occurrences.
Geographical Context and Climate Classification
Coronel Carlos Ciriani Santa is situated in the arid region of Tacna, Peru, characterised by a BWh climate under the Köppen classification. This denotes a desert climate with extremely low annual precipitation. The station's proximity to the Pacific Ocean and the Andes Mountains influences its weather patterns, often resulting in dry conditions with minimal rainfall. The geographical setting contributes to the observed climatic trends and anomalies.
Thermal Trends: A Cooling Decade
Over the past decade, the station has recorded a cooling trend in high temperatures, with a decrease of 2.33°C (4.19°F). This is a significant deviation from the all-time trend, which shows a much milder cooling of 0.05°C (0.09°F) for highs. In contrast, low temperatures over the same decade have decreased by 0.19°C (0.34°F), while the all-time trend indicates a warming of 0.21°C (0.38°F). These contrasting trends suggest a complex interplay of local and broader climatic influences.
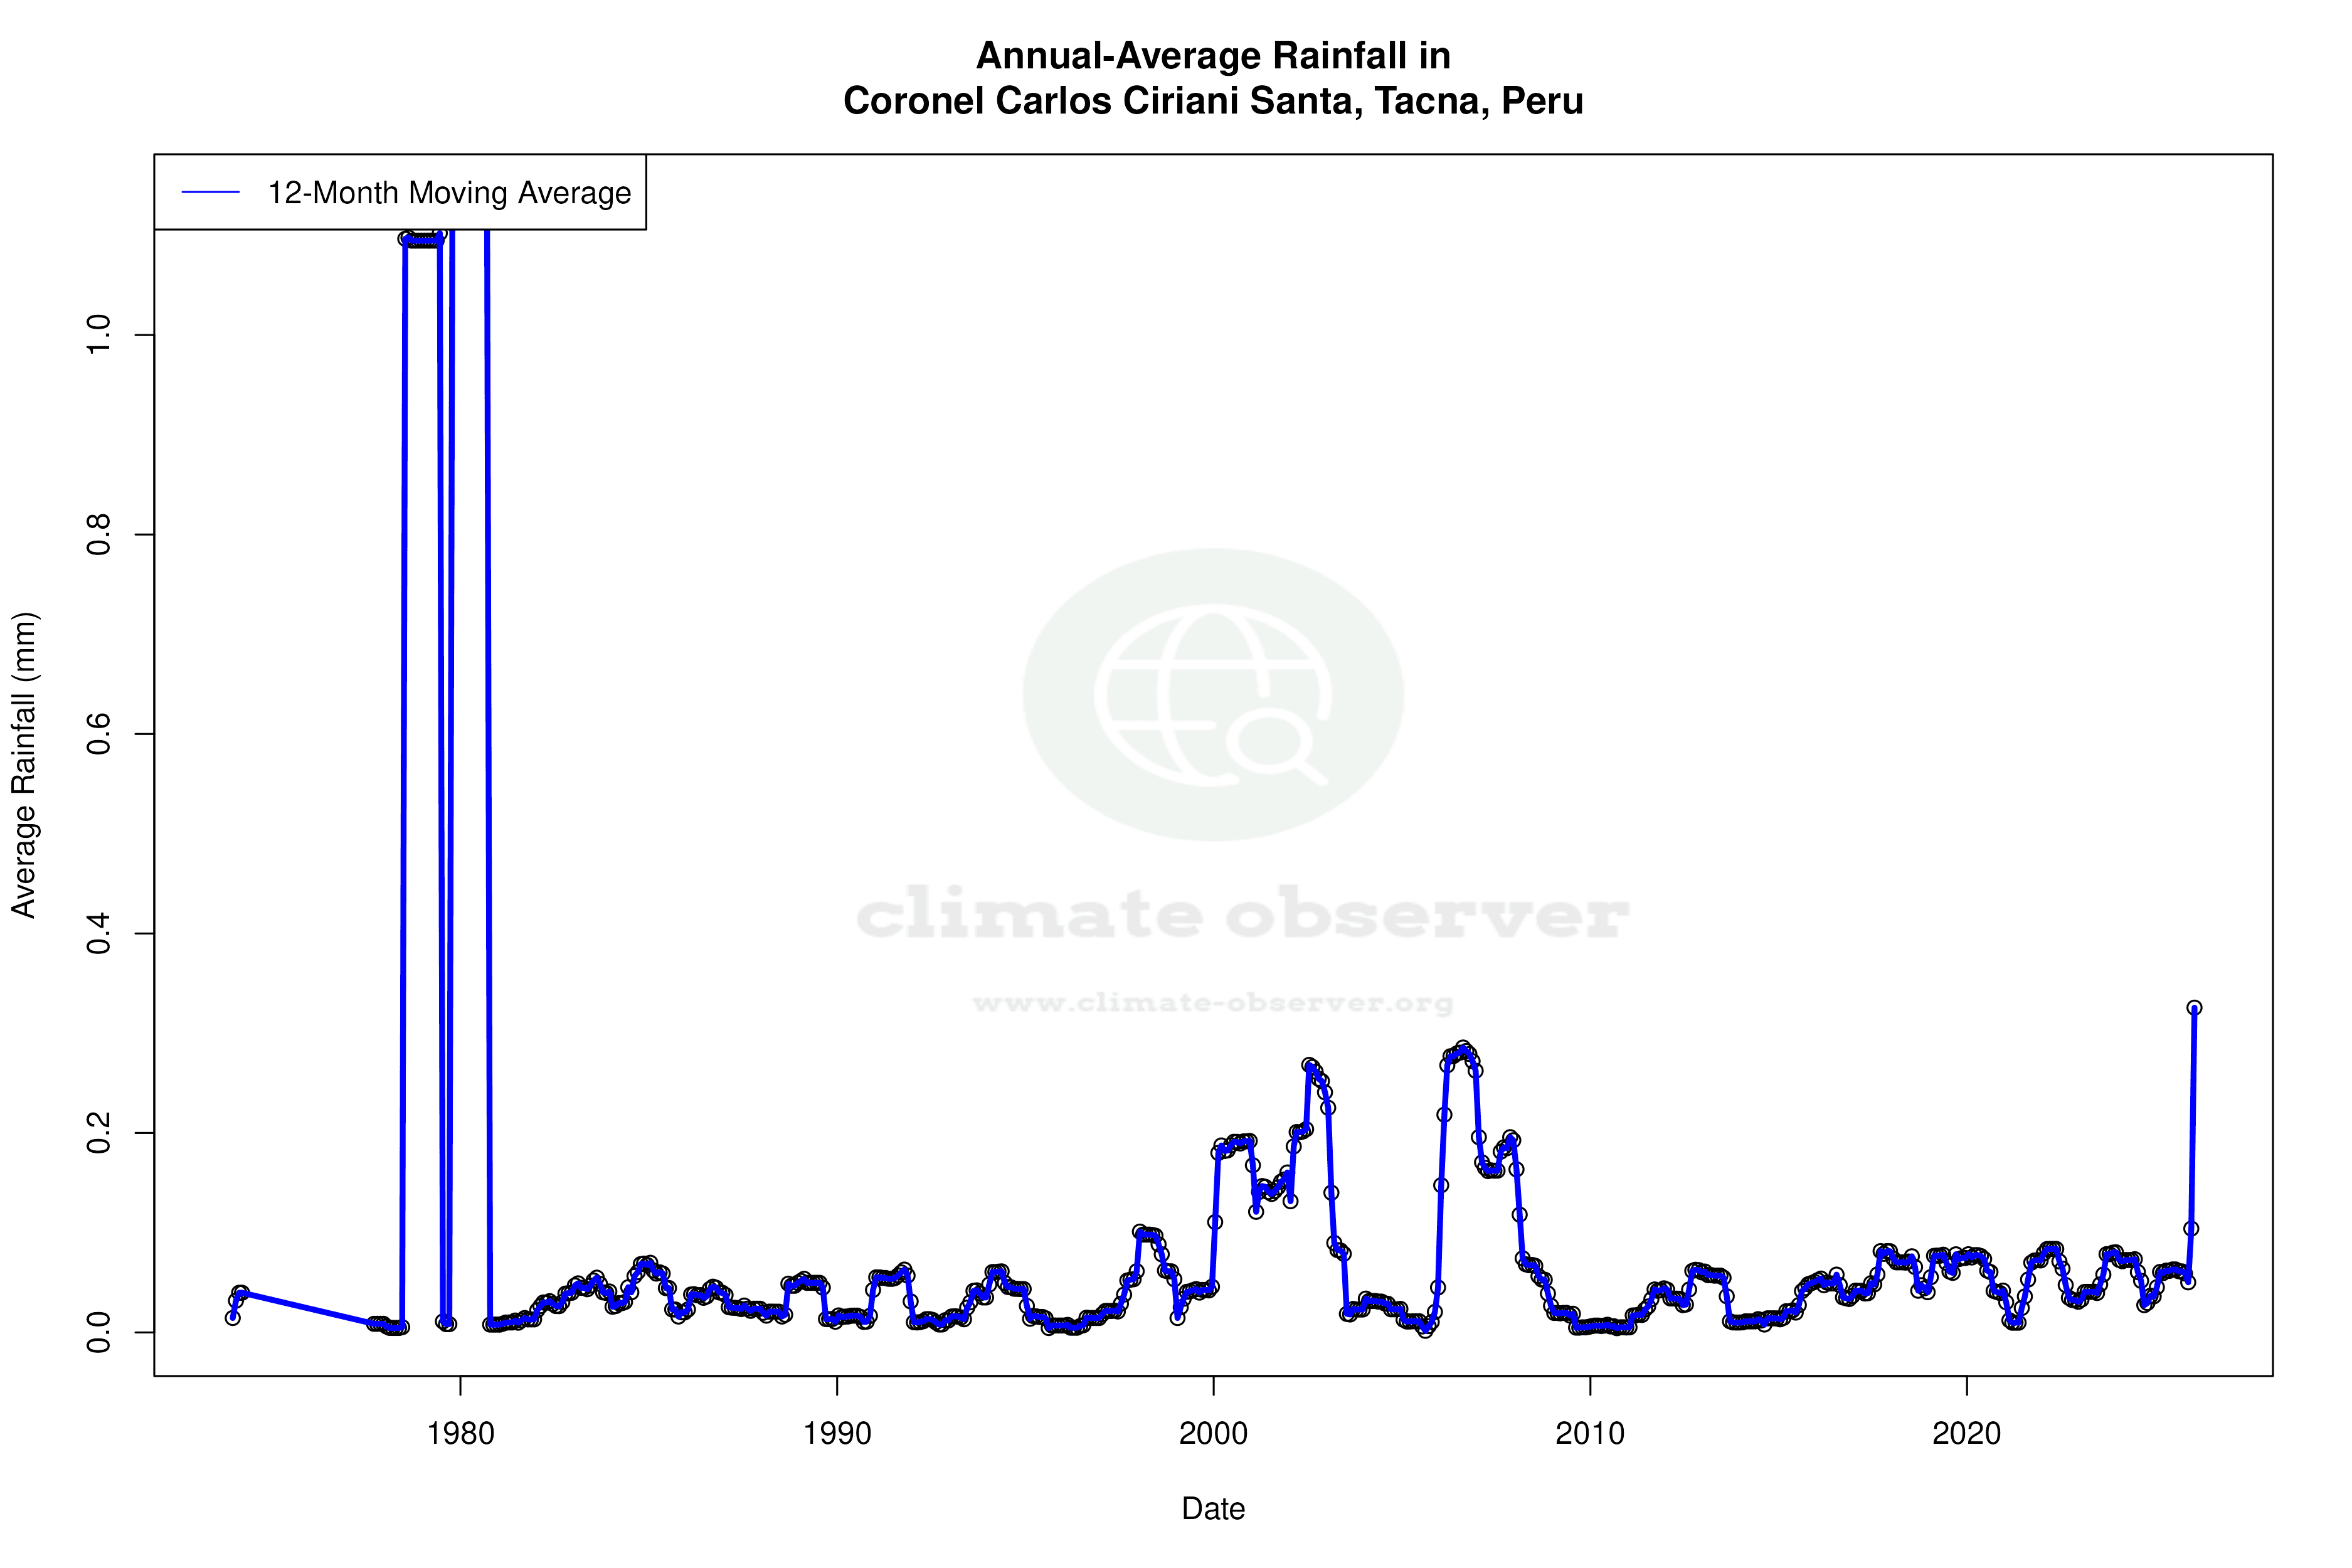
Precipitation Patterns: Intensifying Events
The Precipitation Concentration Index (PCI) at Coronel Carlos Ciriani Santa has seen a dramatic increase from a baseline of 23.9 to a current value of 47.3. This substantial rise indicates that rainfall is becoming more concentrated in fewer, more intense events. Such a shift can lead to challenges in water management and increased risk of flooding, impacting local agriculture and infrastructure.
Temperature Extremes: Record Highs and Lows
The station has recorded an absolute maximum temperature of 33.8°C (92.8°F) and a minimum of 0.0°C (32.0°F). These extremes highlight the variability within the region's arid climate, where daytime heating can be intense, but night-time temperatures can drop significantly, especially at higher altitudes.
Regional Climate Goals and Implications
Peru's climate strategy focuses on mitigating the impacts of climate change, particularly in vulnerable regions like Tacna. The observed climatic trends at Coronel Carlos Ciriani Santa, such as the increased concentration of precipitation, underscore the importance of adaptive measures. Recent weather events in the region have highlighted the necessity for infrastructure that can withstand more frequent and intense rainfall, aligning with national goals for climate resilience.
Station Statistics
10-Year Trend
High: -4.03 °F/decade
Low: -0.47 °F/decade
Rain: +0.004 in/decade
25-Year Trend
High: -0.79 °F/decade
Low: +0.75 °F/decade
Rain: -0.001 in/decade
50-Year Trend
High: -0.12 °F/decade
Low: +0.37 °F/decade
Rain: -0.002 in/decade
All-Time Trend
High: -0.12 °F/decade
Low: +0.37 °F/decade
Rain: -0.001 in/decade
Percentage Above-Average Days
Last 12 Months: 33.2%
This Year: 39.2%
Precipitation Concentration Index (PCI) ℹ️
Last 12 Months: 30.1
Historical Average: 29.1
Percentile Rank of Last 12 Months ℹ️
High: 10th percentile
Low: 76th percentile
Rain: 91st percentile
Change in Variance ℹ️
High: -1.4%
Low: -10.9%
Intraday: -30.3%
Data Coverage
81.3%
First Year of Data
1957
Station Location
Historical Weather Records
| Max High | Avg High | Min High | Max Avg | Avg Avg | Min Avg | Max Low | Avg Low | Min Low | Max Precipitation | Avg Precipitation | Max Snow | Avg Snow | |
|---|---|---|---|---|---|---|---|---|---|---|---|---|---|
| Record | 92.84 °F | — | 57.20 °F | 80.78 °F | — | 50.72 °F | 75.56 °F | — | 32.00 °F | 15.98 in | — | — | — |
| January | 91.40 °F | 81.12 °F | 62.76 °F | 80.24 °F | 71.58 °F | 59.16 °F | 73.04 °F | 63.11 °F | 47.17 °F | 0.82 in | 0.01 in | — | — |
| February | 91.76 °F | 82.17 °F | 61.21 °F | 80.78 °F | 72.54 °F | 57.63 °F | 75.56 °F | 63.91 °F | 48.13 °F | 0.51 in | 0.01 in | — | — |
| March | 92.84 °F | 80.85 °F | 63.88 °F | 79.52 °F | 70.95 °F | 56.30 °F | 75.56 °F | 62.32 °F | 48.02 °F | 0.14 in | 0.00 in | — | — |
| April | 91.40 °F | 76.98 °F | 63.19 °F | 77.54 °F | 66.92 °F | 56.62 °F | 72.32 °F | 58.70 °F | 41.00 °F | 0.27 in | 0.00 in | — | — |
| May | 88.34 °F | 72.72 °F | 61.86 °F | 71.78 °F | 62.75 °F | 55.04 °F | 69.44 °F | 54.82 °F | 39.02 °F | 0.02 in | 0.00 in | — | — |
| June | 84.20 °F | 68.89 °F | 59.00 °F | 68.00 °F | 59.50 °F | 53.42 °F | 64.04 °F | 52.33 °F | 32.00 °F | 0.17 in | 0.00 in | — | — |
| July | 78.80 °F | 67.12 °F | 57.20 °F | 66.74 °F | 57.86 °F | 51.08 °F | 62.96 °F | 51.13 °F | 37.04 °F | 15.98 in | 0.01 in | — | — |
| August | 82.40 °F | 67.73 °F | 57.20 °F | 66.74 °F | 57.96 °F | 50.72 °F | 63.32 °F | 51.18 °F | 39.02 °F | 0.19 in | 0.00 in | — | — |
| September | 84.20 °F | 69.65 °F | 57.20 °F | 66.02 °F | 59.35 °F | 52.34 °F | 62.60 °F | 52.55 °F | 39.02 °F | 0.21 in | 0.00 in | — | — |
| October | 86.00 °F | 72.26 °F | 59.00 °F | 69.44 °F | 62.08 °F | 55.76 °F | 66.02 °F | 54.92 °F | 42.98 °F | 15.98 in | 0.01 in | — | — |
| November | 86.00 °F | 75.14 °F | 65.01 °F | 74.12 °F | 65.23 °F | 58.46 °F | 68.00 °F | 57.67 °F | 44.96 °F | 0.14 in | 0.00 in | — | — |
| December | 86.00 °F | 78.12 °F | 63.09 °F | 76.64 °F | 68.58 °F | 60.44 °F | 71.06 °F | 60.34 °F | 44.96 °F | 0.11 in | 0.00 in | — | — |
Data Visualisations
Remove WatermarksCurrent Year Climate Trends vs Historical


Max Temperature this Year | 1 of 6
Climate 12-Month Moving Averages


Max Temperature 12-Month MA | 1 of 6
Daily Data Points and Averages Throughout the Year


Average Max Temperature Throughout Year | 1 of 5
